Key Words :(Demand Sales Forecast, Time Series, ARIMA, SARIMA, SARIMAX, Moving Average, Revenue, Data Leakage, Mean Absolute Error, Symmetric Mean 1.AbsoluteError)INTRODUCTION
Demand forecasting is the process of using predictive analysis [1] of past data to estimate and predict customers' future demand and sales for the company or organization. It helps the business make better informed decisions that estimate the total sales and profit for a future period. Through Demand Forecasting, different business and organization can optimize their resources and make business plans that will lead to better revenue estimates in the future. The uniqueness in studying demand forecasting time series data is that you have limitedfeaturesfromwhichtheestimationhastobemade.
1.1WHATISTIMESERIES?
These estimations help the organization to make amendmentstothecurrentbusinessplanssothattheycan
2.1IMPORTANCEOFDEMANDFORECASTING
Abstract
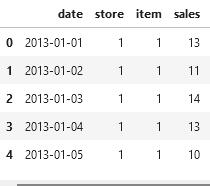
Atargetvariable whichissalesattimetisgivenandis of most importance to us. We are having a feature value of salesattimet,givenasS(t).WehavetoforecastsalesforS (t +h). In demand forecasting, the Date feature which is being denoted as t hasa lotof hidden information stored.
Walk-Through
2.WHATISDEMANDFORECASTING?
International Research Journal of Engineering and Technology (IRJET) e ISSN: 2395 0056 Volume: 09 Issue: 02 | Feb 2022 www.irjet.net p ISSN: 2395 0072
Time Series Forecasting is predicting the future from past data. Time Series Data is being used in various realistic domains such as stock price forecasting, weather forecasting, invoice delay forecasting, business planning, and many others. Time series Forecasting is a subset of supervised regression problems, where we study and perform analysis of temporal features. The proper study of time series data is very important to find changes in trends and seasonality in data. Demand sales forecasting is one of the applications where time series data is used. We are given past sales data in the Demand Sales forecast, and we have to find future 2 3 month sales. This type of forecasting helps different organizations to make a decision based on facts and human factors about everything from resource planning to running flash sales. Demand Forecasting helps an organization to have an estimate of the totalsales andrevenue for a future period.
UG Student, Dept. of Computer Science Engineering, Chandigarh University, Mohali, India *** Time Series Forecasting is the scientific prediction of future observations from the historical time stamped data. It helps an organization to build models for past analysis and create business plans that can result in high revenue in the future. Demand Sales Forecasting is one of the applications of time series where a combination of strategies is used. In Demand forecasting, we make predictive analysis on past historic data to estimate and predict customer demand in the future and the sales of the product. This helps organizations and widely spread businesses to manage their resources, create revenue plans with high gains and risk estimation. Various time series classical models can be used in predicting future demand sales. These pre defined time series state of art model create a base on which we can do our modifications according to our input data and business plan and get good results. When having seasonality in the input data, models like ARIMA, SARIMA, and SARIMAX can prove to be a better option. The techniques like Moving Averages, Weighted Average, Auto Regression can also be used while performing feature engineering. This survey shows how these techniques have been used in demand sales forecasting for a type of input data taken from anexternalsource.
A deep analysis of sales concerning date is required to have insights regarding the changing trends and seasonalityofdata.
Demand Sales Time Series Forecasting
Without demand, there is no business. If a business doesn’t have a proper understanding of demand, they aren't capable of making informed decisions and proper businessplansthatwillleadtohigherresourceusageand less revenue in the future. Demand forecasting is not 100% accurate, but it gives business organizations an estimate and approximation regarding the revenue that they will be having in the future “t” month period if they followacurrentbusinessplan.
Aditya Kumar
© 2022, IRJET | Impact Factor value: 7.529 | ISO 9001:2008 Certified Journal |
A time series is a system in which we have to make observations at certain times, and the outcome, the observedvalueateachtimewhichisarandomvariable.A time series consists of multiple assessments of a specific outcomemeasure,atgrouplevel,oratregulardifferenced time intervals. The "interruption" or "change" or “seasonality” in the time series data is an important identifiable and real world event that needs to be analyzedandmonitored.In forecasting, weareattheta(t) at time t and we are interested in knowing the outcome theta(t+h)attimet+husingonlyinformationavailableat timet.
Page680

International Research Journal of Engineering and Technology (IRJET) e ISSN: 2395 0056 Volume: 09 Issue: 02 | Feb 2022 www.irjet.net p ISSN: 2395 0072
ϕ1,ϕ2,……ϕxaretheautoregressivecoefficients. These models are excellent at handling a wide rangeofdifferenttime seriespatterns.
DemandForecastingisdoneatvariouslevels :
● Passive Demand Forecasting This type of forecasting is generally carried out for stable business that aims to grow invested capital over thelongterm.
● Auto-Regression (AR)- This method states itself asanextstepinthesequenceasalinearfunction of the observation at past time steps. [2] It is a regression of the variable against itself. The method works for univariate time series without trendandseasonalcomponents.
© 2022, IRJET | Impact Factor value: 7.529 | ISO 9001:2008 Certified Journal | Page681 increase their revenue in the future. It helps to improve productionleadtimes,resourceusage,andcostreduction. Demand Forecasting also helps to reduce the risk factor andmakeefficientfinancialinformeddecisions,profitand cost margins, and allocation of resources. It lets you analyzethe productsthatyourcustomerswantand when theywantthem.
● Macro Level Demand Forecasting This type of forecasting deals with the macroeconomic movementsinthemarketwhichiswidelyspread.
● Active Demand Forecasting- This type of forecasting is generally carried out for large business that seeks to return the highest capital gains.
2.2LEVELSOFDEMANDFORECASTING
● Short Term Demand Forecasting It is carried outforarangeofperiodsbetween3monthsto12 months. The seasonal pattern and the effect of statistical decisions on customer demand are takenintoconsideration.
The identification of the AR model is best done with a Partial Autocorrelation Factor. For an AR model, the theoretical PACF pushes off the past order of the model. Here push off means PACF's are equal to 0 beyond that point. In another way, the number of non zero partial autocorrelations gives the order of the AR model. By the “order of the model” we mean the most extreme lag of p thatisusedasapredictor.
2.3 CLASSICAL METHODS OF TIME SERIES USED IN DEMANDSALESFORECASTING
● Internal Business Level Demand Forecasting It is carried out for businesses such as product category, sales, etc. The annual sales forecast is oneoftheexamplesthatfallinthiscategory.
h(t)=β+ϕ1h(t 1) +ϕ2h(t 2) +….+ϕxh(t x) +£t, where £t is the white noise and βisaconstant.
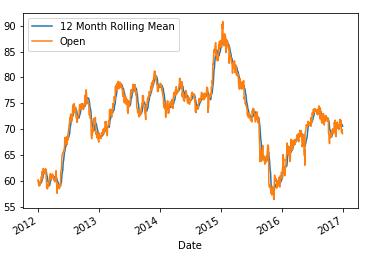
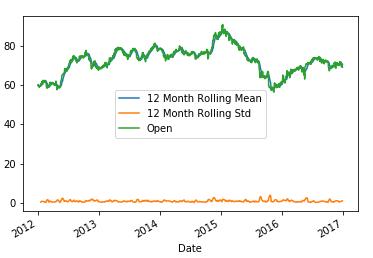
● Moving Averages (MA) Thismethodstatesitself asanextstepinthesequenceasalinear function oftheresidualerrorsfromameanprocessatpast time steps. [2] A series of the mean of different subsets of the entire dataset is calculated for the analysis. A top down sliding window is made of fixeditems for which theaverageiscalculated by dropping the top items of the previous window and adding new items from the below. It is also calledRollingMean(RM)orMovingMean(MM).If thedatasetcontains n entrieswithX1,X2,X3,...,
● Medium to Long Term Demand Forecasting It iscarriedoutmainlyforaperiodofmorethan12 months to 24 months which could sometimes increase to 36 48 months in certain businesses andorganizations.
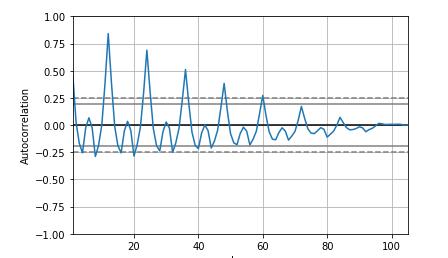
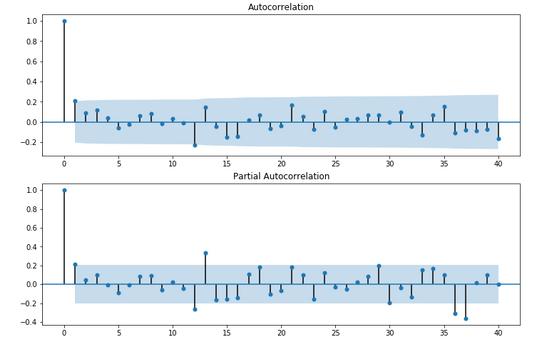
3. Plot the correlation and autocorrelation charts.
© 2022, IRJET | Impact Factor value: 7.529 | ISO 9001:2008 Certified Journal | Page682
Xn, then the moving average of over the last m entriesiscalculatedas : MA(m)=1/m∑Xi,wherei=n m+1ton. Now when calculating the next average, the same sampling width of m is taken which will range fromn m+2ton+1. MA(m,next)=1/m∑Xi,wherei=n m+2ton+1.
RollingMeanExample1.1
On MAexpansion,(m,next)=MA(m,prev)+1/m[Xn+1 Xn+k 1]
ARIMA
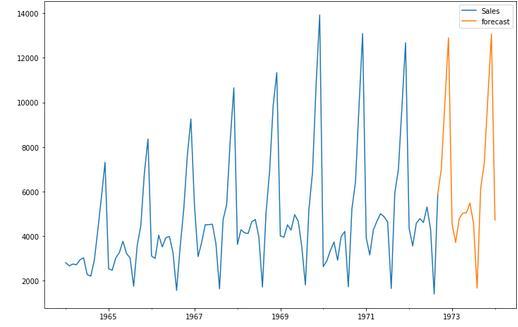
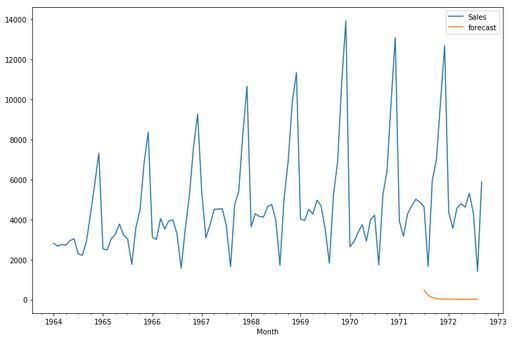
4. Construct ARIMA and Seasonal ARIMA modelsbasedonthedata.
SeasonalARIMAExtendedforecast forecast
RollingMeanwithRollingStandardDeviationExample1.2 ● Autoregressive Integrated Moving Average (ARIMA) and Seasonal Autoregressive Integrated Moving Average (SARIMA) This method states itself as the next step in the sequence as a linear function of the differenced observation and residual errors at prior time steps.ItisacombinationofARandMAmodelsas wellasthedifferencingpre processingstepofthe sequencetomakeitstationary.TheARIMAmodel can be imported from statsmodel.tsa.arima_model and SARIMA model by importing statsmodel.api in Python. The generalpurposeoftheARIMAmodelsis : 1. Visualizetimeseriesdata. 2. Makethetimeseriesdatastationary.
Volume: 09 Issue: 02 | Feb 2022 www.irjet.net p ISSN: 2395 0072
International Research Journal of Engineering and Technology (IRJET) e ISSN: 2395 0056
5. Usethemodeltomakepredictions.
Various methods can be used to perform feature engineering when working on demand sales forecasting datasets.Butthecorrectmethodwill beonethatcanlead youtotherightanalysisandlesserror.
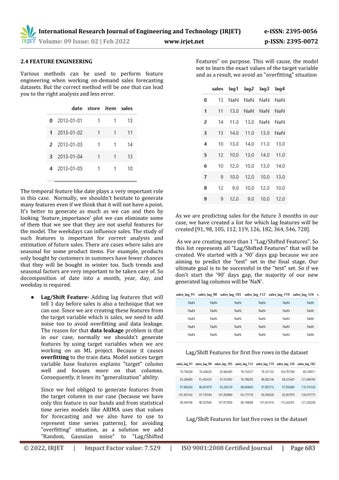
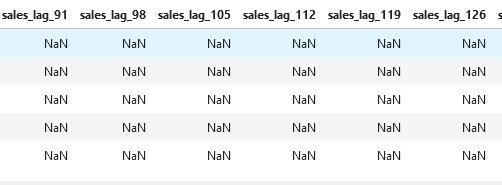
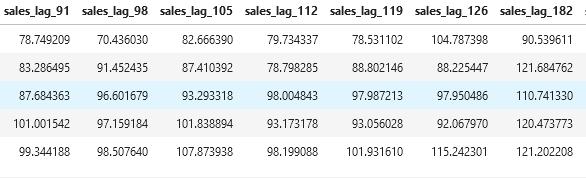
Aswearecreatingmorethan1"Lag/ShiftedFeatures".So this list represents all "Lag/Shifted Features" that will be created. We started with a '90' days gap because we are aiming to predict the "test" set in the final stage. Our ultimate goal is to be successful in the "test" set. So if we don't start the '90' days gap, the majority of our new generatedlagcolumnswillbe'NaN'.
© 2022, IRJET | Impact Factor value: 7.529 | ISO 9001:2008 Certified Journal | Page683
Lag/ShiftFeaturesforlastfiverowsinthedataset
International Research Journal of Engineering and Technology (IRJET) e ISSN: 2395 0056 Volume: 09 Issue: 02 | Feb 2022 www.irjet.net p ISSN: 2395 0072
As we are predicting sales for the future 3 months in our case, we have created a list for which lag features will be created[91,98,105,112,119,126,182,364,546,728].
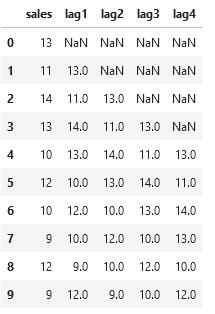
Lag/ShiftFeaturesforfirstfiverowsinthedataset
● Lag/Shift Feature Adding lag features that will tell 1 day before sales is also a technique that we canuse.Sincewearecreatingthesefeaturesfrom thetargetvariable whichis sales,weneedtoadd noise too to avoid overfitting and data leakage. The reasonforthat data leakage problemisthat in our case, normally we shouldn't generate features by using target variables when we are working on an ML project. Because it causes overfitting tothetraindata.Modelnoticestarget variable base features explains "target" column well and focuses more on that columns. Consequently,itlosesits"generalization"ability.
2.4FEATUREENGINEERING
Thetemporalfeaturelikedateplaysaveryimportantrole in this case. Normally, we shouldn't hesitate to generate manyfeaturesevenifwethinkthatitwillnothaveapoint. It's better to generate as much as we can and then by looking 'feature_importance' plot we can eliminate some of them that we see that they are not useful features for themodel.Theweekdayscaninfluencesales.Thestudyof such features is important for correct analysis and estimationoffuturesales.Therearecaseswheresalesare seasonal for some product items. For example, products onlyboughtbycustomersinsummershavefewerchances that they will be bought in winter too. Such trends and seasonalfactorsareveryimportanttobetakencareof.So decomposition of date into a month, year, day, and weekdayisrequired.
Since we feel obliged to generate features from the target column in our case (because we have onlythisfeatureinourhandsandfromstatistical time series models like ARIMA uses that values for forecasting and we also have to use to represent time series patterns), for avoiding "overfitting" situation, as a solution we add "Random, Gaussian noise" to "Lag/Shifted Features" on purpose. This will cause, the model nottolearntheexactvaluesofthetargetvariable andasaresult,weavoidan"overfitting"situation
MeanFeature ● Exponentially Weighted Mean Feature-
International Research Journal of Engineering and Technology (IRJET) e ISSN: 2395 0056 Volume: 09 Issue: 02 | Feb 2022 www.irjet.net p ISSN: 2395 0072
SosincewesaidthatwhileusingtheMLapproach we have to generate features that represent time series patterns, we act help from traditional methodsforthatpurpose.
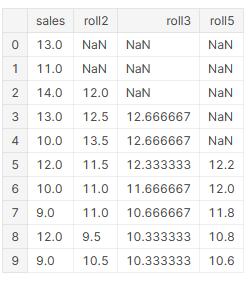
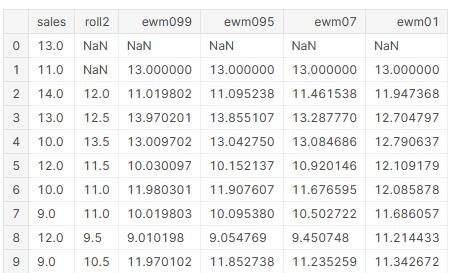
So since these varieties of predictions may cause overfitting to training data weadd again random, Gaussian noise to these new generated features onpurpose.Rolling
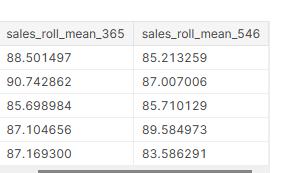
● Rolling Mean Features "Moving Average Method" is used for forecasting "Time Series" problems. This method simply takes "n" previous target variables and averages them and returns themasanewvalue. Sosinceweknowthat,thiskindofmethodisused for forecasting "Time Series" problems, again we generateanewfeaturebyusingthatmethod. Youmayask,whyweusetraditional"TimeSeries Forecasting methods" when we generate new features. Because normally when we work on Machine Learning problems we try to generate features that we think these new features can predicttargetvariables. Since this kind of traditional method has been used for forecasting target variables, when we wanttogeneratenewfeaturesbylookingatthese methodswebecomesurethatthesenewfeatures will have predictive ability for predicting target variables. Because they have been used in the traditional"TimeSeriesMethod",thatmeansthey haveapredictiveabilityfortargetvariables.
You can read about this method more on the internet, but briefly normally in time series
© 2022, IRJET | Impact Factor value: 7.529 | ISO 9001:2008 Certified Journal | Page684
For instance, if we intend to create the 'lag1' feature, this feature will be almost 'NaN' for the 'test' data, and we probably will not be successful in the test set, since this columnwillbealmost'NaN'forthe'test'column.Onlyone observation (the observation that comes after the last observation of the 'train' set because only for that observation do we have the 'lag1' feature) will not be 'NaN'otherswillbe.Soforthatreason,westartwitha'90' days gap. In this case, we will not have any 'NaN' in the "Lag/ShiftedFeatures"inthe'test'set. We add more than 1 "Lag/Shifted Features" because we willtrywhich"Lag/ShiftedFeatures"makessenseforour data,whichmeansyoucantryothervaluesinthislistand seetheeffect. We need such features as we have to generate some features that represent "Time series" patterns. By using "Lag/Shifted Features" we add that kind of feature to our data. Because if you are familiar with well known "Time Series" statistical modelslikeARIMA,Holt Winters,etc, in almostallthesemodels'formulasweseethat"Lag/Shifted Features"actuallyisused.
Wetrytoaddourvarietyofpredictionsfortarget variablestothecolumnsasanewfeaturebyusing thetraditional"TimeSeriesMethods"approach.
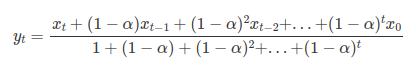
Another traditional "Time Series Method" is the "Exponentially Weighted Mean" method. This method has a parameter called alpha used as a smoothingfactor.Thisparameterrangesbetween [0, 1]. If alpha is close to 1 while taking the averageforlastforinstance10days(rollingmean features also was taking averages but without giving weight), it gives more weight to the close days and decreases the weight when going to morepastdays.
h(t)=β+ϕ1h(t 1) +ϕ2h(t 2) +….+ϕxh(0) +£t, Hereh(t 1),h(t 2)arenothingbutlagfeatures.
As,a resultofthisanalysis,outofall thefeaturescreated, therollingmeanfeatureandlagfeaturehadhigherfeature importance. Also the year, weekday, and weekend days also affected our forecasting but not by much percentage. In our case, the SMAPE was found to be 11.234. It can be further reduced by creating a more refined and tuned machine learning model, which can be done by cross validation and hyper parameter tuning. There are a lot of combinationstrategiesotherthanwhatwehaveused,that canbeimplementedindemandforecastingproblems.The strategy to be chosen and to be used best depends upon the input data and the business goal, but you can use the pre defined state of the art approaches to create your ownbusiness.
[2] Athiyarath,S.,Paul,M.&Krishnaswamy,S.A Comparative Study and Analysis of Time Series Forecasting Techniques. SN COMPUT. SCI. 1, 175 (2020). Elissa,“Titleofpaperifknown,”unpublished.
International Research Journal of Engineering and Technology (IRJET) e ISSN: 2395 0056 Volume: 09 Issue: 02 | Feb 2022 www.irjet.net p ISSN: 2395 0072
MAPE=1/n*∑|(At Ft)/At|wherei=1ton. At=ActualValue,Ft=ForecastValue,n=numberof timesummationiterationhappens.
2.6 HOWTOVALIDATETIMESERIESMODEL?
As we see when it goes more past values it decreases the weight.
● MAPE (mean absolute percentage error) It representsaccuracyasapercentageoferror.Asit isapercentage,itisbettertounderstandthanthe other accurate statistics.
forecasting, it's better to give more weight to the more recent days rather them giving the same weight toallpastdays. Becausemorerecentdayshavemoreinfluenceto the current day. Therefore, giving more weight to themorerecentdaysmakessense. This method uses that formula behind in its calculations(xt:pastdaysvalues)
● SMAPE(symmetric mean absolutepercentage) error (adjusted MAPE). It is a relative percentage error.
REFERENCES [1] Seyedan, M., Mafakheri, F. Predictive big data analytics for supply chain demand forecasting: methods, applications, and research opportunities. J Big Data 7, 53 (2020). https://doi.org/10.1186/s40537 020 00329 2M. Young, The Technical Writer’s Handbook. Mill Valley,CA:UniversityScience,1989.
● MAE (mean absolute error) is the absolute value of the difference between the forecasted value and the actual value. It tells us how big an errorcanweexpectfromtheforecastonaverage. MAE=1/n*∑|yi xi|wherei=1ton. yi= predicted value, xi= actual value, n= total numberofdatapoints.
We have to define a validation set for optimizing our model. Normally in typical ML projects, we define validation set either 'Hold out validation set' approach or 'K fold cross validation' approach. Since it's a time series problem and the order of the time matters 'K fold cross validation' approach will not be useful. So we had used Hold OutApproach.Forthisapproachtowork,wehaveto create a validation set similar to the test set, as our ultimategoalwillbeassessedinthetestset.Asinourcase weareforecastingsalesforthebeginning3monthsofthe nextyear(2019asinthedataset).Wehavetakenthefirst 3monthsofthepreviousyear(2018asinthedataset)asa validationset. 3.CONCLUSION
© 2022, IRJET | Impact Factor value: 7.529 | ISO 9001:2008 Certified Journal | Page685
SMAPE = 2/n * ∑|(Ft At)/(At+Ft)| wherei=1ton.
[4] Ghalehkhondabi, I., Ardjmand, E., Weckman, G.R., et al. An overview of energy demand forecasting
[3] JanG.DeGooijer,RobJ.Hyndman,25yearsoftime series forecasting, International Journal of Forecasting,Volume22,Issue3,2006,Pages443 473,ISSN01692070.
2.5 CUSTOMCOSTFUNCTION
Aditya Kumar is a grounded and solution oriented Data Scientist, pursuing a Bachelor of Engineering in Computer Science at Chandigarh University. Efficient in Performing Exploratory Data Analysis and Feature Engineering, data modeling as well as in scripting languageslikepython.
methods published in 2005 2015. Energy Syst 8, 411 447(2017).
Page
BIOGRAPHIES
International Research Journal of Engineering and Technology (IRJET) e ISSN: 2395 0056 Volume: 09 Issue: 02 | Feb 2022 www.irjet.net p ISSN: 2395 0072 © 2022, IRJET | Impact Factor value: 7.529 | ISO 9001:2008 Certified Journal | 686