3 minute read
Use the model to make predictions

International Research Journal of Engineering and Technology (IRJET) e-ISSN: 2395-0056 Volume: 09 Issue: 02 | Feb 2022 www.irjet.net p-ISSN: 2395-0072
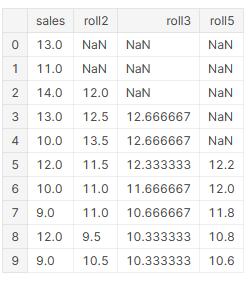
forecasting, it's better to give more weight to the more recent days rather them giving the same weight to all past days.
Advertisement
Because more recent days have more influence to the current day. Therefore, giving more weight to the more recent days makes sense.
This method uses that formula behind in its calculations (xt : past days values)
As we see when it goes more past values it decreases the weight.

2.5 CUSTOM COST FUNCTION
● MAE (mean absolute error)- is the absolute value of the difference between the forecasted value and the actual value. It tells us how big an error can weexpect from the forecast on average.
MAE= 1/n * ∑|yi-xi| where i=1 to n.
yi= predicted value, xi= actual value, n= total number of data points.
● MAPE (mean absolute percentage error)- It represents accuracy as a percentage of error. As it is a percentage, it is better to understand than the other accurate statistics.
MAPE= 1/n * ∑|(At-Ft)/At| where i=1 to n.
At=Actual Value, Ft= Forecast Value, n= number of time summation iteration happens.
● SMAPE (symmetric mean absolute percentage) error (adjusted MAPE). It is a relative percentage error.
2.6 HOW TO VALIDATE TIME SERIES MODEL?
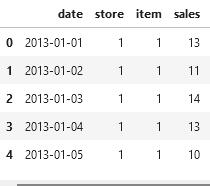
We have to define a validation set for optimizing our model. Normally in typical ML projects, we define validation set either 'Hold-out validation set' approach or 'K-fold cross validation' approach. Since it's a time series problem and the order of the time matters 'K-fold cross validation' approach will not be useful. So we had used Hold-Out Approach. For this approach to work, we have to create a validation set similar to the test set, as our ultimate goal will be assessed in the test set. As in our case we are forecasting sales for the beginning 3 months of the next year (2019 as in the dataset). We have taken the first 3 months of the previous year (2018 as in the dataset) as a validation set.
3. CONCLUSION
As, a result of this analysis, out of all the features created, the rolling mean feature and lag feature had higher feature importance. Also the year, weekday, and weekend days also affected our forecasting but not by much percentage. In our case, the SMAPE was found to be 11.234. It can be further reduced by creating a more refined and tuned machine learning model, which can be done by crossvalidation and hyper-parameter tuning. There are a lot of combination strategies other than what we have used, that can be implemented in demand forecasting problems. The strategy to be chosen and to be used best depends upon the input data and the business goal, but you can use the pre-defined state-of-the-art approaches to create your own business.
REFERENCES
[1] Seyedan, M., Mafakheri, F. Predictive big data analytics for supply chain demand forecasting: methods, applications, and research opportunities. J Big Data 7, 53 (2020). https://doi.org/10.1186/s40537-020-00329-2M.
Young, The Technical Writer’s Handbook. Mill Valley, CA: University Science, 1989.
[2] Athiyarath, S., Paul, M. & Krishnaswamy, S. A
Comparative Study and Analysis of Time Series Forecasting Techniques. SN COMPUT. SCI. 1, 175 (2020).
Elissa, “Title of paper if known,” unpublished. [3] Jan G. De Gooijer, Rob J. Hyndman,25years of time series forecasting, International Journal of Forecasting, Volume 22, Issue 3, 2006, Pages 443473, ISSN 0169 2070.
[4] Ghalehkhondabi, I., Ardjmand, E., Weckman, G.R., et al. An overview of energy demand forecasting SMAPE = 2/n * ∑|(Ft- At)/(At+Ft)| where i=1 to n.
International Research Journal of Engineering and Technology (IRJET) e-ISSN: 2395-0056 Volume: 09 Issue: 02 | Feb 2022 www.irjet.net p-ISSN: 2395-0072
methods published in 2005–2015. Energy Syst 8, 411–447 (2017).
BIOGRAPHIES
Aditya Kumar is a grounded and solution-oriented Data Scientist, pursuing a Bachelor of Engineering in Computer Science at Chandigarh University. Efficient in Performing Exploratory Data Analysis and Feature Engineering, data modeling as well as in scripting languages like python.