2 minute read
Plot the correlation and autocorrelation charts.

International Research Journal of Engineering and Technology (IRJET) e-ISSN: 2395-0056 Volume: 09 Issue: 02 | Feb 2022 www.irjet.net p-ISSN: 2395-0072
2.4 FEATURE ENGINEERING
Advertisement
Various methods can be used to perform feature engineering when working on-demand sales forecasting datasets. But the correct method will be one that can lead you to the right analysis and less error.
The temporal feature like date plays a very important role in this case. Normally, we shouldn't hesitate to generate many features even if we think that it will not have a point. It's better to generate as much as we can and then by looking 'feature_importance' plot we can eliminate some of them that we see that they are not useful features for the model.The weekdays can influence sales. The study of such features is important for correct analysis and estimation of future sales. There are cases where sales are seasonal for some product items. For example, products only bought by customers in summers have fewer chances that they will be bought in winter too. Such trends and seasonal factors are very important to be taken care of. So decomposition of date into a month, year, day, and weekday is required.
● Lag/Shift Feature- Adding lag features that will tell 1 day before sales is also a technique that we can use. Since we are creating these features from the target variable which is sales, we need to add noise too to avoid overfitting and data leakage.
The reason for that data leakage problem is that in our case, normally we shouldn't generate features by using target variables when we are working on an ML project. Because it causes overfitting to the train data. Model notices target variable base features explains "target" column well and focuses more on that columns.
Consequently, it loses its "generalization" ability.
Since we feel obliged to generate features from the target column in our case (because we have only this feature in our hands and from statistical time series models like ARIMA uses that values for forecasting and we also have to use to represent time series patterns), for avoiding "overfitting" situation, as a solution we add "Random, Gaussian noise" to "Lag/Shifted Features" on purpose. This will cause, the model not to learn the exact values of the target variable and as a result, we avoid an "overfitting" situation
As we are predicting sales for the future 3 months in our case, we have created a list for which lag features will be created [91, 98, 105, 112, 119, 126, 182, 364, 546, 728].
As we are creating more than 1 "Lag/Shifted Features". So this list represents all "Lag/Shifted Features" that will be created. We started with a '90' days gap because we are aiming to predict the "test" set in the final stage. Our ultimate goal is to be successful in the "test" set. So if we don't start the '90' days gap, the majority of our new generated lag columns will be 'NaN'.
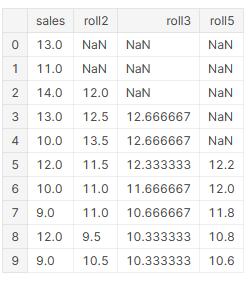
Lag/Shift Features for first five rows in the dataset
Lag/Shift Features for last five rows in the dataset