International Research Journal of Engineering and Technology (IRJET)
e-ISSN: 2395-0056
Volume: 09 Issue: 01 | Jan 2022
p-ISSN: 2395-0072
www.irjet.net
Detection and Analyzation of Candlestick Pattern using YOLO Object Recognition Laukik Pathak1, Sharvari Tamboli2, Anuja Tamboli3 1Bachelors
in E&TC Technology, Gokhale Education Society’s R H Sapat College of Engineering, Nashik, India Bachelors in Computer Technology, Gokhale Education Society’s R H Sapat College of Engineering, Nashik, India 3Bachelors in Computer Technology, MVPS’s KBT College of Engineering, Nashik, India ---------------------------------------------------------------------***---------------------------------------------------------------------2Student,
Abstract - The financial market if accompanied by the latest technology, the chance to generate high income can increase effectively. The traders use candlestick charts to visualize the market in a better way and also to study the movement of the market. The candlestick chart depicts four main values of HOLC i.e., High, Open, Low, Close. The candle pattern chart is plotted by using these values for a specific period. When closely observed, the different charts from historic data or a long period of various quotes we can find some similar occurring patterns formed by the candles. So we used the same occurring patterns to feed our model to recognize similar occurring patterns if found in the realtime chart plotted of the financial market. Key Words: Financial Market, Candlestick, Patterns, YOLO, Chart plotting, Pattern Recognitions 1. INTRODUCTION Human intelligence can make better decisions by using graphic presentations. And in the finance sector, all the formations, indicators and technical analysis that is done is Closely studied and predicted using charts. To help make this process of prediction and classification easier artificial intelligence can be used. As technology has grown and artificial intelligence has evolved over the years, its implementation can be seen in the financial market also. The prediction methods of AI classification based on data like video, audio, and images in deep learning have shown great performance. The following proposed model is based on a supervised Yolo model of object classification based on labels given through labelImg software. The model can help to recognize patterns in the real time market, thus enabling the trader to have an insight of the direction of the market in the future. The main motive of the study is the same, i.e., providing a platform to easily predict the direction of the market and highlight the patterns in the chart.
© 2022, IRJET
|
Impact Factor value: 7.529
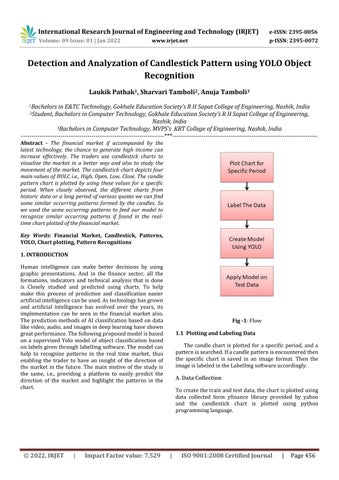
Fig -1: Flow 1.1 Plotting and Labeling Data The candle chart is plotted for a specific period, and a pattern is searched. If a candle pattern is encountered then the specific chart is saved in an image format. Then the image is labeled in the LabelImg software accordingly. A. Data Collection To create the train and test data, the chart is plotted using data collected form yfinance library provided by yahoo and the candlestick chart is plotted using python programming language.
|
ISO 9001:2008 Certified Journal
|
Page 456