A confidential small oyster farm operation in the Chesapeake Bay was recorded and studied to understand the oyster farming process well. According to this small oyster farm, the oyster farming environment comprises five essential components: the oyster processing crew, processingplatform,oysterboat,oysterfield,andthefinal processing stage. In final processing, oysters are washed, boxed, and shipped to market. These components are situatedintheBay. The final staging process is carried out in a land based facility. Oysters are bred and harvested in the oyster farmers’ leased portion of the Bay. Oysters are grown in cages and linked by ropes. The cages are used to protect theoysterfrompredators. The boat's primary purpose is to assist the crew on the farm to move cages from the oyster fields to the processingplatform.Someboatswillbefittedwithaboom forraisingandloweringoystercagesintheareaandatthe processing platform. Finally, the oyster processing platform is where the oysters are unloaded from the oysterboatontothedocktobeginprocessing.
Starting an oyster farming business for small oyster farmers is difficult. Many techniques and tools are considered, such as farm location, types of tools, and operating procedures. In addition, they must develop an understanding of the process, starting from seedlings to the final delivery. Small farmers find it hard to decide on best farming practices as well as locations. The oyster aquaculture industry is growing. For smaller farmers to achieve profitability, they must grow by meeting the challenges facing their size and the economy. Integrating system engineering technology into the small farming business can enhance the efficiency of oyster farming by considering all the farming components and optimally managingthem.
Oysters fall in the family of Ostreidae, which includes the edibleoysters[1].Everyaspectoftheoyster'slifecycleis influenced by salinity and temperature, mainlyreproduction, growth, and mortality [2]. Oysters takeabout18to24monthstogrowintoadults[3]. The Chesapeake Bay has approximately 173 oyster farms [4]. Each farm has its method of growing oysters. There are many farming methods; the most common are the suspended culture method, surface culture, and bottom culture. Each technique is influenced by factors such as environment, weather, and geographical location, to mention a few. Every growing method affects the oysters' quality of meat, shell, and flavor profile as they all have advantagesanddisadvantages[5]
This research aims to develop, implement, and evaluate a processtoimproveoysterfarminginChesapeakeBay.The oyster farming process is being viewed as a system. By defining the oyster farming process as a system, it will makeiteasierforanalysis.Forexample,tounderstandthe farming process more clearly, complex conceptual and object oriented models are defined. These models are much easier to construct and analyze from a system perspective. In addition, these models are input to a simulation process wheresystemstheory will simplify the simulation and analysis process. Although large farmers willbenefitfromthisresearch,theprimaryfocuswillbeon thesmallfarmers.Inaddition,apythonsimulationmodelis
International Research Journal of Engineering and Technology (IRJET) e ISSN: 2395 0056 Volume: 09 Issue: 01 | Jan 2022 www.irjet.net p ISSN: 2395 0072 © 2022, IRJET | Impact Factor value: 7.529 | ISO 9001:2008 Certified Journal | Page397 Using Systems Engineering Technology to Improve Efficiency of Small Oyster Farmers in the Chesapeake Bay Nermeen Abdullah1 , LeeRoy Bronner2 1Doctoral Candidate, Dept of Industrial and Systems Engineering, Morgan State University, Maryland, USA 2Associate Professor Dept of Industrial and Systems Engineering, Morgan State University, Maryland, USA *** Abstract
The oyster agriculture industry is growing very fast. For the small farmers to achieve profitability, they must grow by meeting the challenge facing their size and economics. This research aims to use system engineering technology to develop, implement, evaluate, and deliver a process recommendation to improve efficiency for small oyster farming in the Chesapeake Bay in the State of Maryland. In addition, system engineering will provide a structured approach for the analysis and modeling of small oyster farming processes. These models are used for current and future research in the oyster industry. This research explores the small oyster farming gap in the state of the art of small oyster farming research. It develops a methodology and solution for filling this gap. The study explores the small oyster farming process. In addition, this research will explore the challenges small oyster farmers face, recommend, and implement solutions
1.1 Oyster Farming Process
Key Words: Cages, Equipment, Oysters, Systems Engineering, Systems Development Life cycle (SDLC)
1.INTRODUCTION
1.2 Problem Definition
1.3 Purpose of the Study

The methodology used in this research is the System Development Life Cycle (SDLC). SDLC is a system engineeringapproachthatdefinesthestagesofbringinga project from inception to solution. This methodology includes planning, analysis, design, development, implementation,integration,andtesting. AsshowninFig 2, the initial stage is the planning stage, where the problem definition occurs. The problem definition identifies the issue at hand. This definition sets a level based on initial research conducted as well as engaging different system engineering skills. In the initial phase of the methodology, system information provided by users and stakeholders is used. Consultation with experienced systemengineersisconductedthroughaJointApplication Development (JAD) session. Through the JAD session, the problem is defined and diagrammed. It is a high level
International Research Journal of Engineering and Technology (IRJET) e ISSN: 2395 0056 Volume: 09 Issue: 01 | Jan 2022 www.irjet.net p ISSN: 2395 0072 © 2022, IRJET | Impact Factor value: 7.529 | ISO 9001:2008 Certified Journal | Page398 developed to simulate and model the oyster farming businessactivitiestoevaluateefficiency. 2. REVIEW OF THE LITERATURE
[5] in their research article, “the effect of aquaculture gear on the growth and shape of the oyster Crassostrea virginica during a “finishing period” in the Chesapeake Bay, USA”, discusses the equipment type and tidal zone location impact on the shell shape and the product quality of the oyster Crassostrea virginica, which is produced for the market consumption by hatchery in theeasterncoastofUSA,ChesapeakeBay Theresearcher studied the total oysters and the wet meat inside it by examining the shell length, height, weight, and width. The data were collected from August to December 2015. The researchers found out that the oysters grow with a low death rate in all equipment, but the OysterGro had more impact on the weight and height of the Oysters compared to the subtidal cage, rack, and bag gear. Shell shape also improvedbyusingtheOysterGro.
2.1 Gap Analysis
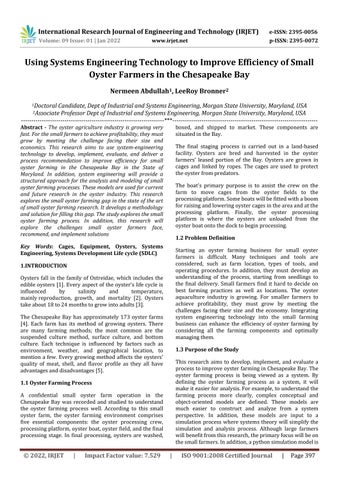
Ananalysisoftheliteratureinoysterfarmingshowsagap in using systems engineering as an approach for analysis, especiallyintheChesapeakeBay.Asasmalloysterfarmer, itishardtostartafarmingbusinesssinceitincludesmany areas to be considered. Several questions arise when a small farmer tries to start a business. Some of these questionsthatneedtobeconsideredare:whereisthebest location to farm oysters? What is the optimal water salinity? What is the best farm growing method? Should oysters be farmed on the top or the bottom of the water? Whatarethefarmingtoolsthatareneededtoenhancethe farming operation? The scope of this research focuses on small scale farmer. This study aims to fill the system engineering gap by improving the efficiency of oyster farmingamongsmall scalefarmersintheChesapeakeBay. There appears to be no research addressing the small oyster farming business from a system engineering perspective. Fig 1 shows how system engineering technologycanaidinfillingthisgapandhelpsmallfarmers improve their businesses. The systems engineering approach considers the oyster farming process from growingoysterseedlingstofinalmarketdelivery.
Fig 1:GapAnalysis
Molly Marie Rybovich [7] in her master’s dissertation, “Growth and Mortality of Spat, Seed, and Market Sized Oysters (Crassostrea virginica) in low salinities and high temperatures”, discusses the impact of the change in climatic conditions in affecting the growth of the oyster population.Theresearcherconductedthestudyofthelow salinity and high temperature on the growth of the oysters.Theauthorconductedanexperimentin2012and 2013 in which she took the hatchery produced oysters and placed them in bags, some bags were kept closed whileothersremainedopen,inBretonSoundLosAngeles. The growth and the death of the oysters were recorded monthly. The author found out that in the places where thesalinitywaslowthegrowthoftheoysterswaslowand theplaceswherethesalinitywashigherthegrowthofthe oysters Thomaswerehigh.andcolleagues
Kraeuteretal[6]intheirresearcharticle,“OysterGrowth Analysis: A comparison of Methods”, have analyzed the growth of the adult oysters on Delaware Bay Seedbeds. The authors used three methods for studying the growth ofadultoysters.First,thegrowthonthelipoftheoysters retrieved from the bottom is considered. Second, the oystersareplacedindividuallyinaspecialframemadefor the study. Third, the age and size information has been collected through studying the marks on the axis of the oysters.Theresearcherfoundoutthattheexistingstudies have focused on those regions where the growth of oysters is rapid rather than discussing the climatic conditions. The local climatic conditions determine the averageageofanoyster.Thesalinityaffectsthegrowthof the oysters. The more saline the region is the more it is a probabilitythatthegrowthoftheoysterswouldincrease.
3. METHODOLGY
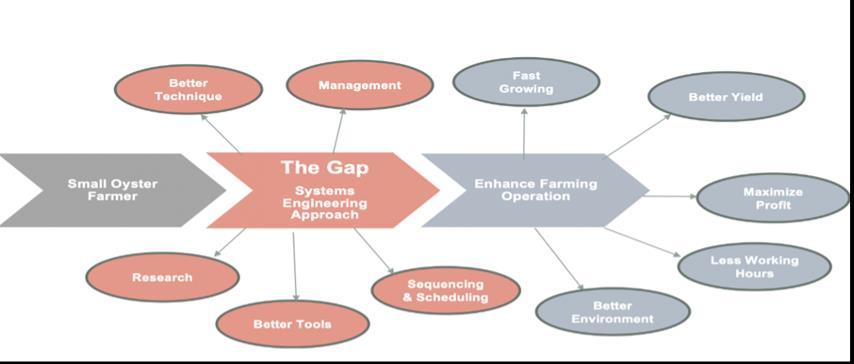
Fig 2:EnhancedSystemsDevelopmentLifeCycle[8] RESULTS
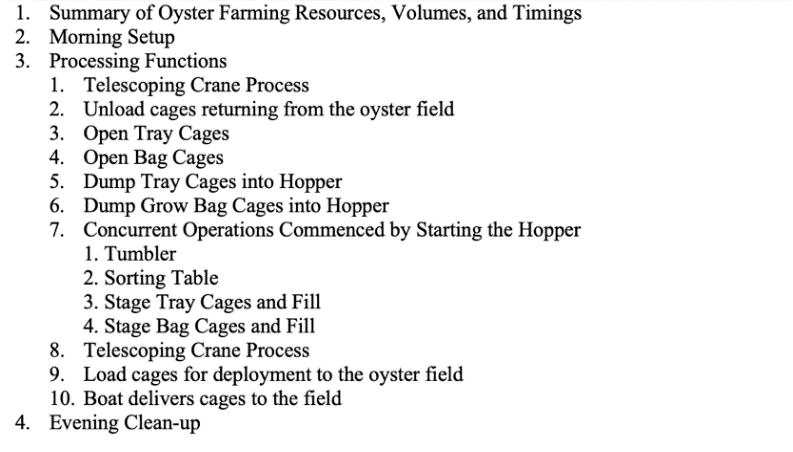
The primary objective of this research is to make oyster productionandprocessingmorestructuredandorganized to increase productivity and profitability. The methodology section explains the term “structure.’ A business cannot advance and become efficient unless the variousstagesandprocessesarestructured.Workingwith oysterfarmingpersonnel,aneight hourdaywasmodelled using object oriented technology. This modeling captured the farming process, including many stages: setup and shut down of machines such as motors, pumps, hopper, tumbler, and conveyors. The model also included accessing oysters in the field, transferring and staging oystersontheplatform,returningoystercagestothefield, andfinallyprocessingoysters,includingdeliveringoysters to market. This model a guide for simulation of farming processes before and after improvements. Models are usedtoask what if questions.Somequestionsincludethe speed of the tumbler, the number of crew, the size of the hopper, the number of oyster cages available, and other systemvariables.
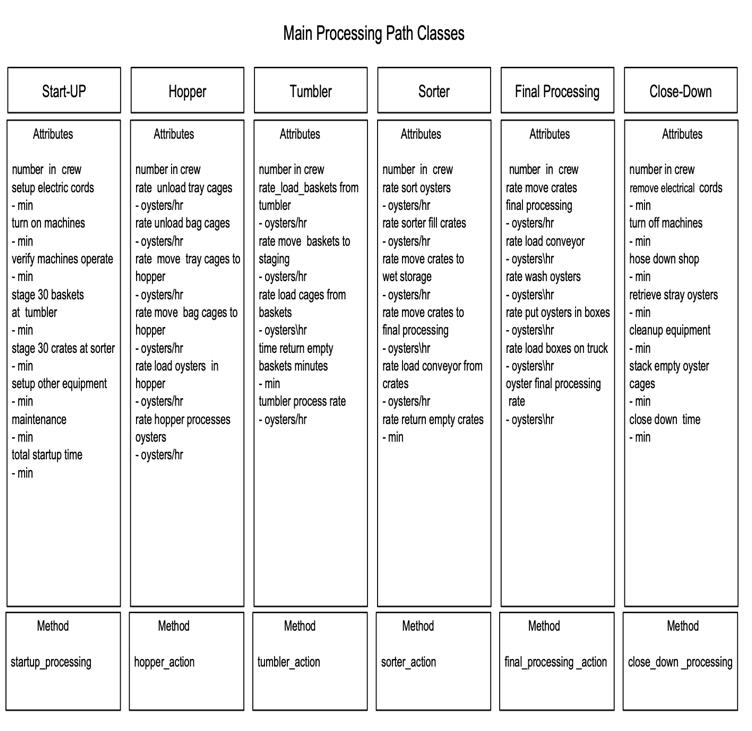
4.1 Class Diagrams Duringtheanalysisphase,classdiagramsdefinetheoyster farmingprocess.Classdiagramsillustrateparticipantsand anyentities(i.e.,machinery,boats,trucks,etc.),attributes, and methods (i.e., the class's actions) that describe the oyster processing environment. In addition, class diagrams are the templates for object diagrams Fig 3 outlinestheclassdiagramsforthemainpathoftheoyster processing: start up, hopper, tumbler, sorter, final processing,andclose down.
International Research Journal of Engineering and Technology (IRJET) e ISSN: 2395 0056 Volume: 09 Issue: 01 | Jan 2022 www.irjet.net p ISSN: 2395 0072 © 2022, IRJET | Impact Factor value: 7.529 | ISO 9001:2008 Certified Journal | Page399
definition of the problem. In preparation for developing the conceptual model, a problem description is created. The problemdescription is a moredetailed description of theproblem.Itrequiredmorein depthresearch.
4.
Fig 3:MainOysterProcessingClassDiagrams Fig 4outlinesclassdiagramsforfillingtrayandbagcages forstagingatthedock.Thesecageswillbereturnedtothe fieldforfurtheroystergrowth.
In the next phase, a conceptual model develops from the problem description. The problem conceptualization integrates with that of the solution. In addition, the conceptual model is the base for developing the Use Case model. This model creates the requirements that govern theanswertotheproblem.Inessence,ifalltheconditions produced by the Use Case model are satisfied, this solves the problem. Following the development of the Use Case Model, the next step is object oriented analysis. This process produces the following artifacts of analysis: class, object, sequence, activity, and state diagrams. These diagrams capture and define the solution to the problem. In essence, these diagrams become a guide for the design andimplementationofthesolution.AsshowninFig 2,the solution is tested and evaluated following the design and implementation. As part of the testing and evaluation phase,theusersandstakeholdersarecontinuallyengaged in the input. There will be an interaction between all phases of the analysis to determine the best solution. The evaluation determines whether the objectives and requirements developed in the initial phases have been satisfied.Itensuresthatanynewlydevelopedsubsystems workappropriatelywiththeexistingsystem.
4.2 A Numerical Model
Oyster farms in the Chesapeake Bay were visited and studiedfortwoyearsaspartofthisstudy.Fortheobject oriented model and the python simulation, this farm's operations were recorded and timed. This section's data, numbers, measurements, and farming operations are accordingtothissmalloysterfarmintheChesapeakeBay. The goal of this research is to help small oyster farms in Maryland's Chesapeake Bay improve their practices. Oystersaregrownandsoldatthisoysterfarmeveryyear. Three times a week, 52 weeks a year, they harvest. The farming action was timed and recorded on videotape.
International Research Journal of Engineering and Technology (IRJET) e ISSN: 2395 0056 Volume: 09 Issue: 01 | Jan 2022 www.irjet.net p ISSN: 2395 0072 © 2022, IRJET | Impact Factor value: 7.529 | ISO 9001:2008 Certified Journal | Page400
The last group of class diagrams is the final processing of oysterssummarizedinFig 6 Eachclassdiagramcontains attributes and methods. Attributes can vary and play an important part in understanding productivity, working hours, and business expenses. In Fig 3, for instance, the tumblerclasshassixattributes.Oneoftheseattributesis the tumbler processing rate. If the tumbler process rate increases, it could affect the overall production rate of oysters.
Fig 6:FinalProcessingofOystersClassDiagram
Fig 5outlinesclassdiagramsformovingcagesbyboatto the oyster field and returning to the dock. In addition, a boatrequiresacrewoftwotooperate.
Table1showsa breakdown offarmingoperationsonthis small oyster farm, from morning set up through closing. Thisisarepresentationofthedailycycle.Itisthepurpose of the numerical timing model to define and govern the Object Oriented diagrams and the Python model. Class diagramsareusedtoconstructobjectdiagramsinPython. At a given point in time, the state of objects can be captured in an object diagram (through the diagram's attributes). Since they define the data structures required forcoding,objectdiagramsserveasaguideforthePython model. There can be dynamic changes to attribute values that are defined using object diagrams. The Python farming model is affected by changes in attribute values, which can identify potential bottlenecks. Amount of tray/bag cages and oysters used in the daily processing cycleareamongtheattributes
Fig 4:FillTrayandBagClassDiagram
Fig 5:MoveBoattoOysterFieldClassDiagram
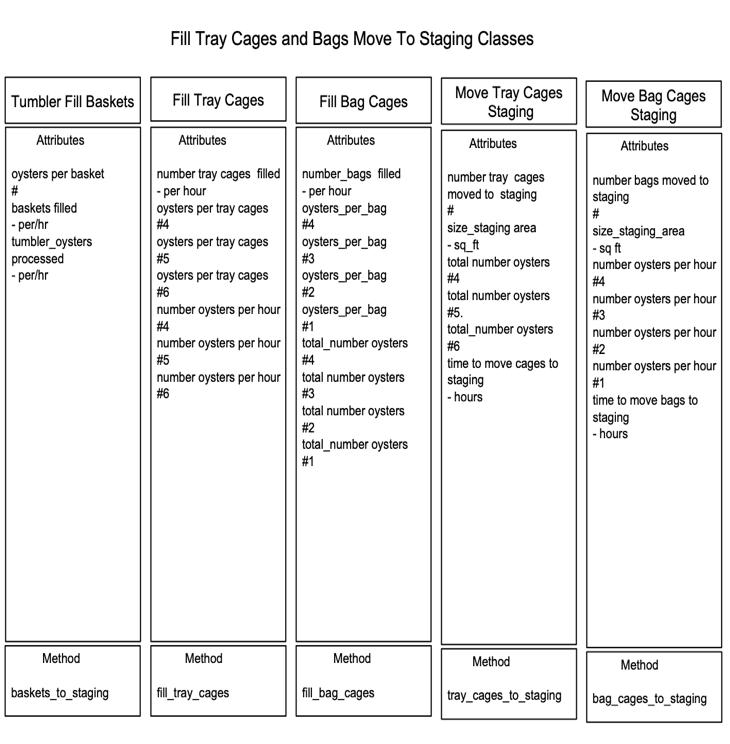
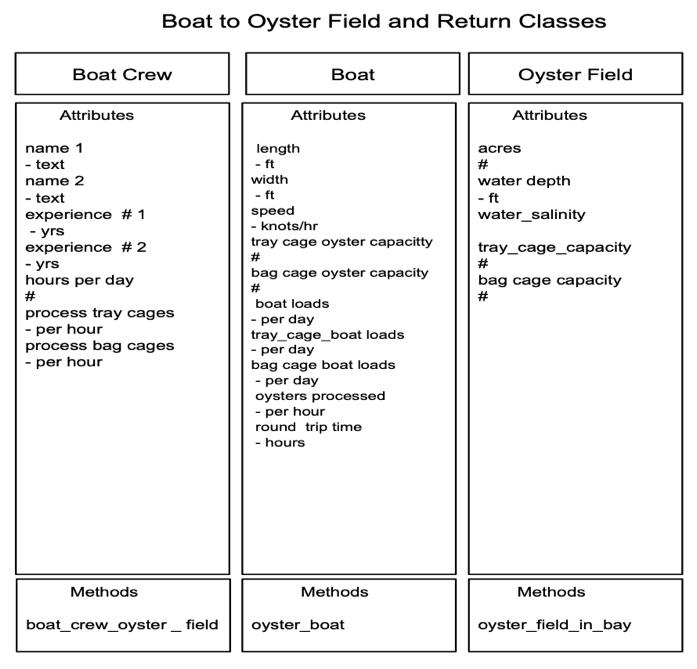
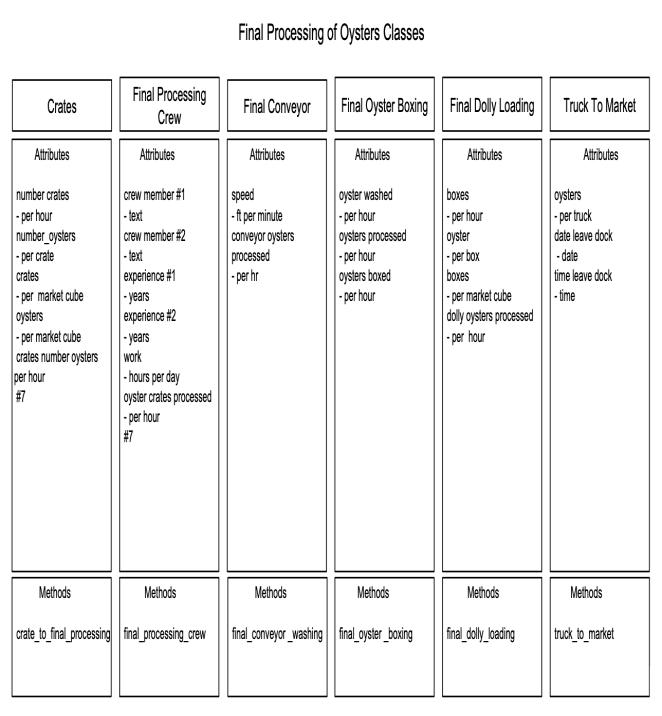
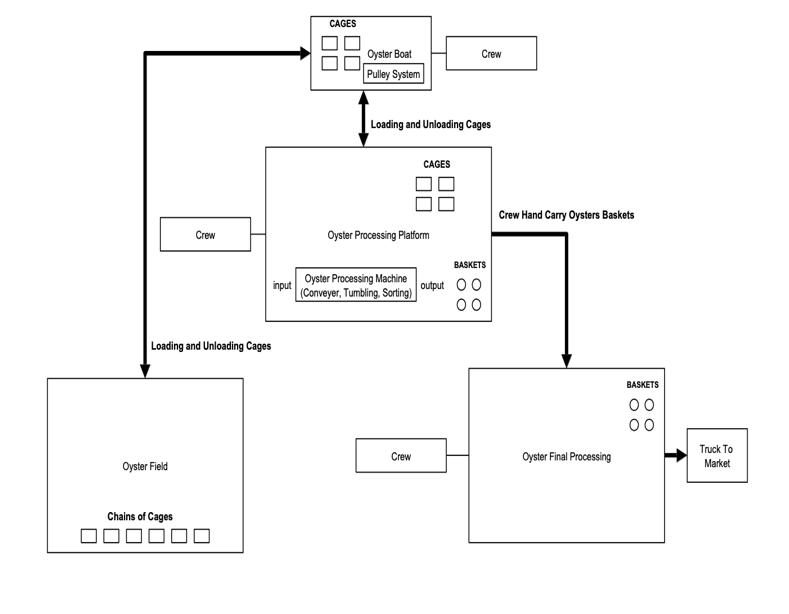
Fig 7:TheCurrentOysterProcessingSystem
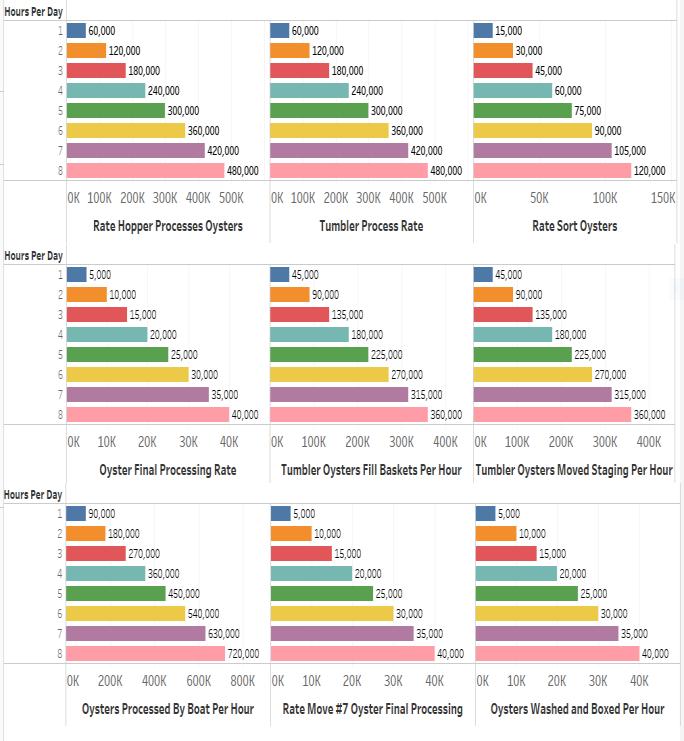
Using class diagrams as a starting point, these processes' object models were created to demonstrate the values of many general properties. In Fig 8, the results of this modeling work can be shown. Oysters handled over the courseofan8 hourdaycanbeseeninthereport'soutput. Althoughoystersarestagedatarateof90,000oystersper hour at the hopper during the evaluation of the present small oyster business understudy, hopper processes 60,000 oysters per hour Overall, 8 hours of oyster processing is depicted in Fig 8. The hopper and tumbler process 480,000 oysters in an eight hour shift. At the sorting table, oysters are manually sorted. Therefore, the processing rate drops to 15,000 oysters per hour. Final processing (i.e., #7 sized oysters) or return to the oyster field (i.e., #6 sized oysters) are the options for oysters processedatthesortingtable.Inaddition,alargenumber of oysters processed at the tumbler returned to the field (i.e., 45,000 oysters). In the main path, the tumbler was found to be the bottleneck, as predicted by the modeling effort.Asa result,purchasinga newtumblertomatchthe hopper'sspeedcapabilitiesof90,000oystersperhourwas recommended.
Fig 8:CurrentOysterProcessingOutputs
Small oyster farming procedures are simulated using Python in this study. It was feasible to operate multiple CPUs in parallel using the system's multi processing capabilities. As a result, it was now able to run many oyster processing operations at once. Certain application functionsrequiredtobeperformedinparallelratherthan sequentially since they occurred at the same time. The current oyster processing system under study is outlined in Fig 7. There are four steps in this model. As a last step before oysters are delivered to market, they go through a series of steps that include the use of a hopper, tumbler, sorter, and a conveyor belt. The next process is loading oysters into baskets from the tumbler, where baskets of oysters are placed in cages and staged for shipping back by boat to the oyster field for further growth. The third process is modeling the boat trip to and from the oyster field. The final stage of oyster processing is washing, packing,andshippingtheoysterstomarket.
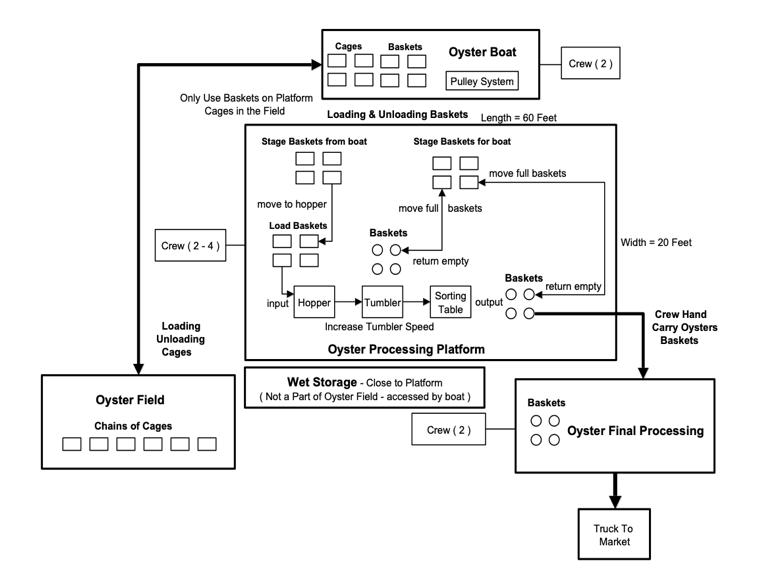
There is a need to reimagine the platform design to improve the efficiency and productivity of oyster farming. The recommended platform design is shown in Fig 9. It is pertinent to mention that the size of the platform is especially important. If the size of the platform is small, the overall efficiency and productivity will be average or below average. A large platform can exponentially increase the efficiency of the work.
Secondly, it is advisable to use baskets to carry oysters fromtheboattotheplatform.Movingcagesofoystersto the platform is not only time consuming, but it involves
International Research Journal of Engineering and Technology (IRJET) e ISSN: 2395 0056 Volume: 09 Issue: 01 | Jan 2022 www.irjet.net p ISSN: 2395 0072 © 2022, IRJET | Impact Factor value: 7.529 | ISO 9001:2008 Certified Journal | Page401 Table 1: SummaryofNumericalTimingModel 4.3 Python Model
4.4 Recommendation Based on Results
[8]L. Davis, and L. R. Bronner, “Development of an application model for the analysis of aircraft flight decks,”IIEAnnualConference,23 44.
International Research Journal of Engineering and Technology (IRJET) e ISSN: 2395 0056 Volume: 09 Issue: 01 | Jan 2022 www.irjet.net p ISSN: 2395 0072 © 2022, IRJET | Impact Factor value: 7.529 | ISO 9001:2008 Certified Journal | Page402
REFERENCES
5. CONCLUSIONS
physical attrition. Physical pressure on the crew can reduce productivity and increase working hours. Cartablehandbasketsareusedinplaceofheavycages.In addition, the dock may be covered with a roof so crews can cope with bad weather such as wind, rain, storm, or hot sun. Also, it is recommended to purchase a new tumbler toupgrade the speed to90,000 oysters perhour, matching the speed capability of the hopper. This process increases productivity across the board. With one additional crew at the sorting table, sorting is now producing30,000oystersperhour. NewlyRedesignedOysterProcessingSystem
Fig -9:
Oysterfarmingisahighlycomplexoperation,andthereis a need to break the process into subsystems to improve system analysis. The systems engineering approach addresses the small oyster farming business in a more detailed and structured way than most previous analysis. Fromtheliteraturereview, itcan be concludedthat small oyster framers need to enhance their farming operations to compete favorably with other farmers in the market. The current environment puts small scale oyster farmers atadisadvantageintheirmarketsharecomparedtoother farmers since their existing system is inadequate to servicethecurrentoysterbusiness.Smallfarmersneedto consider all oyster farming subsystems such as the farmingoperation,tools,andtechniques. The current research study addresses the best ways to farm oysters, improve the growing cycle and maximize farming profits. In addition, propose a more efficient way to operate the oyster farm using systems engineering technology. A simulation model is developed to evaluate theoysterfarmingprocesstoimprovefarmingoperations from the first stage of introducing oyster seedlings to the finalstageofdeliveringoysterstomarket.
[1]W. D. Hautmann, and H. Bucher, Geologically oldest oysterswereepizoansonEarlyTriassicammonoids.J. Molluscan Stud, Jan. 2017, pp. 253 260. Available: https://doi.org/10.1093/mollus/eyx018
[6]J.N.Kraeuter,S.Ford,andM.Cummings,Oystergrowth analysis: A comparison of the method. J. Shellfish Res, Aug. 2007, 26, pp. 479 491, Available: 8000(2007)26[479:OGAACO]2.0.CO;2https://doi.org/10.2983/0730
BIOGRAPHIES
Nermeen Abdullah received her B.S. and M.S. degrees in Systems Engineering from George Mason University, Virginia, United States, 2018. She is currently pursuing a Doctor of Engineering degree in Industrial and Systems Engineering at Morgan State University, Maryland, United States. From 2017 to 2018, she worked as a Graduate Teaching Assistant at George Mason University.
[2]T. Sehlinger, “Analysis of temperature and salinity effectsongrowthandmortalityofoysters(Crassostrea virginica)inLouisiana,”M.S.thesis,UnivNewOrleans, USA,2018. [3]L.Xu,Q.Li,H.Yu,andL.Kong,Estimatesofheritability for growth and shell color traits and their genetic correlations in the black shell strain of pacific oyster Crassostrea gigas, Marine Biotechnol, Aug. 2017, pp. 421 429, Available: https://doi.org/10.1007/s10126 017 9772 6 [4]R. Kobell, Bay's oyster farm success overtaking public oyster harvest, Chesapeake Bay Magazine, Nov. 2017, Available: https://chesapeakebaymagazine.com/bays oyster farm success overtaking public oyster harvest/ [5]L. L. Thomas, S. K. Allen, and L. V. Plough, The effect of aquaculture gear on the growth and shape of the oysterCrassostreavirginicaduringa“finishingperiod” in Chesapeake Bay, USA. Aquaculture, Jun. 2019, 508, pp. 1 9. Available: https://doi.org/10.1016/j.aquaculture.2019.03.061
[7]M. M. Rybovich, “Growth and mortality of spat, seed, and market sized oysters (Crassostrea virginica) in low salinities and high temperatures,” M.S. thesis, Agric.Mech.College,LouisianaStateUniv.,USA,2014.
Currently, she is working as Graduate Research Assistant with the industrial and Systems Engineering Department at Morgan State University. Her research interests are Model Based Systems Engineering, Decision Support Systems, Systems Architecture, Systems Modeling, and Optimization.
International Research Journal of Engineering and Technology (IRJET) e ISSN: 2395 0056 Volume: 09 Issue: 01 | Jan 2022 www.irjet.net p ISSN: 2395 0072 © 2022, IRJET | Impact Factor value: 7.529 | ISO 9001:2008 Certified Journal | Page403
LeeRoy Bronner received his B.S. in Electrical Engineering from the UniversityofAkron,Akron,Ohio,1963. He received his M.S in Electrical Engineering from Northeastern University in Boston, Massachusetts, 1966. LeeRoy received a Doctor of Philosophy degree in System Engineering from Case Western Reserve in Cleveland, Ohio, 1973. He worked as a System Engineer for the IBM Corporation for 25 years and taught System Engineer at Morgan State University for 22 years. His teaching and research interests are in Systems, Big Data, Cloud Computing, Networking, Simulation, and Conceptual Modeling and Analysis. LeeRoy is currently a member of thefacultyatMorganStateUniversity.