MOTIVATION
International Research Journal of Engineering and Technology (IRJET) e-ISSN: 2395-0056 Volume: 09 Issue: 01 | Jan 2022 www.irjet.net p-ISSN: 2395-0072 © 2022, IRJET | Impact Factor value: 7.529 | ISO 9001:2008 Certified Journal | Page18 Quantitative Analysis of Equities using Machine Learning and Textual Analysis Aditya Bagla1, Vaibhav Kudke2, Sarthak Dongre3, Surya Dhole4, Tanuja Mulla5 1 4Dept. of Computer Engineering, JSPM’s Narhe Technical Campus, Pune, Maharashtra. India 5Assistant Professor, Dept. of Computer Engineering, JSPM’s Narhe Technical Campus, Pune, Maharashtra, India ***
Marketischanginginaninstantaneousrateeven inadaytherearemanyhighsandlowsinthemarketand havingsaidtheresourcesandthetimingtheexternaland internal agent. Stock is a fascinating resource to start with.
ABSTRACT: AstheStock Marketsaroundtheglobe are constantly increasing in Volume, the participants are also increasing exponentially. This increase in market participantsisamajorfactorwhichcausesalotofvolatility inthepricesofequities. We are currently in the age where data is readily available, its use for the prediction of future stock prices and movement trends is becoming very popular Thus we willbereviewingthemostappropriateandefficientmethod topredictthestockmovementwithhigheraccuracy.
Time is money or even more valuable than money so instead of spending time on reading reports, charts and figuringoutthefuturevalueofacompanystockthroughthe long process, we can let the highly developed and modern automatedtechniquesinthefieldofMachineLearning,High Performance Computation, and Artificial Intelligence to do thistaskofFinancialmarketanalysisforus. 1.1 INFORMATION ON STOCK
Chapter 1 INTRODUCTION
Weallhaveheardthewordstockonewayorthe other.Particularlystockisrelatedwiththeassociatesand companies which are commercialized and are to settling in the world of marketization. The other word used for stock is share which is prominently used in day to day life. People even term it as an investment plan and its something people see as a long term investment that secures and provides an abundant funds during the retirementBuyingage. a company stock is purchasing a small share of it. People invest on the same to get a long term benefit which they think is less value for now but has to potential to grow with the time. Its an investment that providesthelongtimerunanddealswithlongtimegoals with the fair objectives. The value of share you invest today has to give you an yield of best tomorrow but its notthesame.Marketisunpredictablesoaretheresourcesand the factors that are taken to drive it off or on the set. Its neverbeenonthesamelevelandthepatternofthesame is still unpredictable till the time. Some closeness and prediction method had been derived and approximates valuesandtheroughfiguresaregeneratedhopingforthe best but all of the resource can’t be trusted and are still unpredictableKnowinginnature.themarket situation and researching on the same is the best way to find the reliability for whichtherearemanyagentswhohavetakenthesameas a profession and are making a fortune out of it. They predictandadvisebuttheadvisorycostandthechargeis higherandthestockevaluationisneverlessthesame.
The stock price of a company is an important metric in finding out the growth or prosperity of the company, and many factors can affect these values. Various events taking place in a company and the news revolving around it can affect public sentiments and emotions regarding their investmentsinsuchcompany,whichmayhave an effecton thetrend ofstock market prices. Intime of marketdistress the reaction of stock prices to news is even more pronouncedandtherecentCOVID 19pandemichasproven that on multiple occasions. Performing successful stock marketpredictionisstillachallenge.Newsarticlesarevery useful and important in financial prediction, but currently no good method exists that can take these into consideration to provide better analysis of the financial market. Successfully predicting the future movement of the stock price will be a great tool for the investment institutions and will provide real life solutions to the problems that stock investors face while taking decisions relatedtoinvestments.
Stock in other term is defined as the fair share or ownership representation explaining the security measuresand the agreementbetween twoparties which are an individual and the company. Stock is there from the start and due to its tendency of uncertainty it has beenawordoffancy.Peopleresearchingonthesameand implementing on the daily basis had made a fortune out of it. There are various agents available in market for making you understand and invest on the same and the chargesofthesamearehecticandinsanelyexpensive.

Stock is another way for company to collect revenueand boost up theproduction for theupperyield and to gain the most out of the business plan for the bigger pictures. This is found to be an effective way to invest and grow in the commercial field and a better alternative to tackle the financial crisis during the requirement.Foran investor its a risk phenomenon where they invest their saving and hope it brings back the return in higher yield. If the evaluation of the same increases then the stock evaluation and its price increasescausingthefinancialgaintoboththeparties.In IndianSocietyitisevenconsiderasasidepointbusiness andpeoplebelieveitasahandofluck.
This is totally based on Machine Learning Algorithm to proceed and provide an effective result. Getting the data, processing it and generating a forecast is the problemstatementhere.
Everythingflows ina pattern.Patternistheway ofderivationandsoholdstrueforthestocktoo.Stockin day to day life follows a pattern movement. Increase in some resource can increase the price of some whereas decreasethepriceratefortheothers,Thesourceandthe outcome are derived on the polarity basis which can either be positive, neutral or an negative flow. Correlation of the given polarity is determined and an effectivesourceandreliabilityisestablished.
Themainresourcesforthecompanyarethefund tocarryoutthedailyworkandcreateaprofitoutofit.In time of need for an higher budget estimation and to overgrow from the resources they need the finance and undergoing a finance loan for approval, passing and havingoneishecticandthebanksarevulturesforwhich the interest rate is higher than the other form of investmenthencelimitingthemarginoftheproduct.
1.3 PROJECT PURPOSE
1.2 PROBLEM DEFINITION
When an individual purchases a company stock thenthey’rereferredasashareholderandtheywillgeta shareoutofthesameastheyhaveinvestedintheirprofit or the gain. A investor can sell and buy the stock as per theirneeds.Theycansharetheirstocktotheirrespective or the other individuals where as there are many stock brokersavailableoutinthefirmplayingwiththesame.
Stock is an unpredictable curve that had been in picture ever since. Its essence had been ever long living andindulging.Ithadgrownitspopularitywithrespectto time. People are more fascinating and interested on the same then before times. Same for the case for the organization. Organization had created it as a better source of revenue generation rather than investing and taking a loan approval from the bank It's way efficient andlesshecticfromthefirmpointofview. Stock is unpredictable and its been the same fromthestart.Itswayofescalatinganddeescalatinghad been phenomenonand experiencingthesameisthe best integral part of it. It has its upper hand and flexibility withthechangesthathasthechancesofuprisingaswell as crashing the whole market. Its easily defined in few words but making an essence and understanding the sameiswaymorehecticandtimeconsuming. Simpler it sound complex are its phenomenon and integrating the same. It has its whole different sets of dependencies and integration from different agents which fluctuate the same in the market. Finding an accurate and getting the exact values out of the same is still unaligned and no particular model of the same is seeninthemarketvalue. Findingtheclosestandgettinganaccurateproximate valueoutofsuchanunpredictabilityisaprobleminitself. Merging of the data getting the best prediction to increasetheefficiencyalongsideconsideringthedifferent expects of the moderator is tough and we took the same in consideration and implemented with every aspect to generatethebestoutofthesameandgetaresultthatcan bebetterinterruptedandtheefficiencyremainsthesame with the value of different aspects of creating an impact of reducing the risk and influencing the same over the timeperiodtogainthemostoutofit.
International Research Journal of Engineering and Technology (IRJET) e-ISSN: 2395-0056 Volume: 09 Issue: 01 | Jan 2022 www.irjet.net p-ISSN: 2395-0072 © 2022, IRJET | Impact Factor value: 7.529 | ISO 9001:2008 Certified Journal | Page19
Data is considered as the digital fuel that gives the possibilities of higher yearn and gives the upcoming terms. Knowledge is power and same holds correct with the stock. Stock is unpredictable and over changing its dynamicinnature.Theriseandfallofthesameisuneven and can’t be classified so easily. Dependencies of the samedealswithflexibleresourcesandtheagentsbehind it.
Stock market prediction is a prediction system software that illuminate the risk that undergoes during theinvestmentinstockmarket.Itpredictsthestockrates and its rate of exchange acknowledging the basic understanding and the statistical analysis in front of users.
Investment during a fiscal day determines the opening stock market for the next day. It has its dependencies and is total integration with the level of finances and revenue generation. The stock is tremendous and hectic in nature. The main theme of the project is to predict the turning curves and bring the predictability method and undergo the process and algorithmstoconcludetoaviableresourcesource.
This project helps in bridging the resources and empowering the people to know and trade the most out
Features deals with the flexibilities and the top marksthatonecanpresent.Theprojectwasheadedwith the resource available and the most that the market demands and that is finance. Talking about finance and learning on the same gave an idea on the fiscal and stocks. So the featuring of the idea came with handling and automating the resource which other agents are makingfortuneoutofit.
1.5.2 DATA AbstractionABSTRACTIONisthefindingoftheresourceto its best to categorized the above dataset and learningthebestoutofit.Abstractionofthedatais theintegralparttotheflow.Allthedataareahuge set of chunks which on processing can limit the yield result and the computational mean too. Thus with the available resources the data yield had to bederivative.Abstraction of the dataset is to customize the datasetandfindingthebestsuitableconstraintsto take into consideration and the unwanted resourcesarethedump whichwill be dumped and the supreme cluster is created with the valuable constrains and a pattern is needed to be derived fromtheDatasame.are cleared on this level for the beginning oftheprocess.Thevaluabledata arethe setthatbringsthevaluetothedatasetfora better understanding and giving a better yield and productionbyevaluatingthesame. This is a feature abstraction module to extractthefeaturingofthedataset.Thisisafeature model process where all the feasible resources are categorized and the same will be in use for the
There are various models that outflows in market which are trying their best on creating a resource and give the predictability to most of it accurate but everythingisnotthesameandtheconclusionofthesame arenotideal.Theefficiency variesasthevariationinthe stockmarketanditsprediction.
This is the fundamental module before starting of the project. The dataset is a group of data that are mended together to show the data variations in a time span to undergo further estimation and the source of the resources and its outcome for the later time of evaluation. It generates the result optimization and gives a feasible time period to customize and get the flow tothederivation.Thisincreases and are used in the level of researchand findingthe bestsuitable resourceout ofthesametheresourceshastobefinelyestimated and derived for the best possible outcome and the finest the value become the better is the level of extraction and closure is the best yield values that needstobeconsidered.
1.4 PROJECT FEATURES
1.5.1 DATASET
Theprojectispurposedwiththe soleintent tomake and undergo the following way of computing. The first deals with the data extraction that is done with clearing of data and its chunks from the database or the dataset. Thesecondflowisthetrainingfromthesourcetrainingis doneandclassified. During thesame supervisionisdone and the last part is the generation of the yield which providestheresultaftercomputationofthesame. Salient features included are the Visualization and the prediction that gives a boost. Uses of different forecasting algorithm to forecast that holds true and are suffice in nature to yield to the positive resource source. Diving and initializing the expects that needs to be considered.Mitigatingtheriskfactorstobridgeanduplift theinvestment.Analyzingand utilizing the same to support the live environment. Keep a track of progressive result and it’s evaluation on day to day basis to find the flows and the levelofintegration.Automatingfortheideasandmaking it most by using feasible algorithms which can undergo learning and implement the updates in itself to summon theeffortsthatoneneedstotakeforthebest.
Knowledge is a bliss and learning is the curiosity whereasoutcomeistheexpectationsotheresourcedeals with the importation and extraction of multiple machine learningalgorithmstolearn, processandyieldthe result to derive and conclude a possible outcome set that is effectiveandgenerativeinnature.
1.5 MODULES DESCRIPTION
1.5.3featuring.TRAININGDATASET
International Research Journal of Engineering and Technology (IRJET) e-ISSN: 2395-0056 Volume: 09 Issue: 01 | Jan 2022 www.irjet.net p-ISSN: 2395-0072 © 2022, IRJET | Impact Factor value: 7.529 | ISO 9001:2008 Certified Journal | Page20
of stock and understand the generation and the vulnerabilities that has to be seen and predicted. The enhancementofthesameisdonewiththeresourcegraph which makes a user to analyses the same and take the needs and important details before dealing and consider those things for the yield that the person is willing to invest on. Forecasting of the stock prediction is done by the available data source and the prediction is done for the upcoming period. The predictability itself is a challengeandthat’sthemainpurposeofthereport.
After the abstraction of the data and clustering of the same. The machine had to be trained for which the training data plays the
1.5.5 RESULTEVALUATION This is the main part for any implementationoftheproject.Evaluationofthekey point to the success. All the categorization of the work and the best to know the resource fundaments and again establishing the same to check the validity and the work flow and check on the output is must. The evaluation, utilization and implementation undergoes various level of extractionandevaluation.
One of the integral parts to maintain the consistency is the literature survey. It’s the crucial steps to be followed in the development process. The Software Development needs authenticity of the resources and the availability of the same. This part helps in discovering the content that been worked on and find the utilization and the implementation of the same in today’s time. The key factor to the development is the economy and the strength of the product. Once the innovation of thesameundergoesthroughthebuildingphasethe support and the resource flow is to be monitored and computed. This is also known as the Research phasewherealltheresearchisembeddedanddone tocarrytheflow.
This is a supervised learning form where theinputarepassedsothatthesystemlearnsfrom the same. Various variants of inputs are passed whichwerestoredinthedataset.Everyresourceis considered and taken into consideration. After considering the whole set of information and the resourcethemachinetriestolearnfromthepassed dataset. The dataset has to be wide and versatile. After considering the learning it tries to integrate with the same type and flow like the same as the human mind and creates a pattern and the links betweenthesame.
After the evaluation and customization of thesametheresultistobepottedinavisibleform and the best form of visibility is the graph. The Graph visualization is the best way of visualization that keeps the audience engaged for a long time.
One of the finest word heard in today time is MachineLearning.Eitheritbeatworkordifferentplaces themachinelearninghasbeenanintegralpartoftoday’ s technology.Thoughitsevolvinganddevelopinginarapid rateanddevelopmentanddeploymentofthesameisstill in progress. The machine learning itself had brought a random changes in today worlds because of which automationisinframewhichwasamereexistenceinthe
important role. There are thousands of machine learningalgorithmsthatareintoplaceandevolving with the same. The best to the practice of machine learning is to yield the result and the content to derivewhat’sneededwiththetimeframe.
International Research Journal of Engineering and Technology (IRJET) e-ISSN: 2395-0056 Volume: 09 Issue: 01 | Jan 2022 www.irjet.net p-ISSN: 2395-0072 © 2022, IRJET | Impact Factor value: 7.529 | ISO 9001:2008 Certified Journal | Page21
Chapter 2 LITERATURE SURVEY
2.1 MACHINE LEARNING
Derivation of the outcome is easily accessible and interpretedandtheflowdiagramisshownwiththe stock prediction that gives an upper hold to the appearanceandshowsthebestlevelofthecontent.
After establishing a graph connectivity the customerortheusertakestimetoprocessthedata and take that picture into consideration and can avail for the upcoming stock by investing in the same.
The process undergoes the same for various time and phase. Testing of the same undergoes sequential iteration for many more to meetuptotheconstituency.Theremarksaretobe noted and further work is done on the same with the implementation of the different aligned resources that are integrated with the available resourcesanditsoutcome.
of data that gives the result after learning from the data. This is the test generation with the output result. Results are generated in each phase of testing. This is also termed as the testing phase. Now a new set of datasets are passed which are deliberately like the training dataset and the efficiency of the same is calculated.Over Fitting of the dataset. Validation of the same with the effective constraints and hyper parametersare checked.Thisphaseis trainingand the output is evaluated with the set of training. After each process of computation the set of data are trained and efficiency of the same is measured andisevaluatedwiththeothers. Various batches ofthe test is implemented to get to the level of accuracy and derive result to fetch and yield for the best performance and to be true to the effectiveness of the data which is not biased with any constrains available. This determines the efficiency of the system which is mustforthepredictions.
1.5.4 TEST TheseDATASETarethesets
Themainthemeistoprovideandcomeup with the output with an accuracy that can be used andimplemented.Fromthestartingtothefinalthe process is categorized, supervised and efficiency is check and the working is undergone. Testing is doneanditsevaluationaremended.
International Research Journal of Engineering and Technology (IRJET) e-ISSN: 2395-0056 Volume: 09 Issue: 01 | Jan 2022 www.irjet.net p-ISSN: 2395-0072 © 2022, IRJET | Impact Factor value: 7.529 | ISO 9001:2008 Certified Journal | Page22 past.
Thevariousmachinelearningtoolsinvolvedareas follows;
2.1.2 UNSUPERVISED LEARNING
Though its being evolved in nature but it has integrateditselfwellwiththetermsofcomputationaland digitalization. Various computational fields like Data Mining, Statistical Analysis, Optimization of resources, Automation are a major part of it. Here the machine has the capacity to process the result on its own as same as the human bring. This process can be initiator as well as the derivable. The statistical flow is mainly reasonable with data driven pattern even the unstructured or the semi structured data can be processed and approximate answertothesamecanbederived.Alltheequations are derived and the closest value to it’s aligned field is foundandtheproximityisdetermined.
Algorithm of such are improvising in nature which learns by themselves and fit themselves in the world of impairment by getting the required data and adjustingwiththesamegivingtheeffectiveresultsoutof the same. ML is a subsidiary or the subset of an AI(Artificial Intelligence). It is a mathematical model where computation of the testcases plays the major role indrivingoftheresults. A wide level of machine learning architectures are implemented today to turn on the yield factor and make people life more efficient in terms of livelihood. Various use of such in Message Filtering like spams, Trash automation are automated and carried out by the same. Since the efficiency is way more than a human tendency. Multi tasking and processing is also initiated by the same giving a dual output which a human can nevereverpossiblybeableto. Statistics is the major key role in driving the machine learning in figure. It deals with computation of statisticsinawiderangeviewandprocessingthesameto give a data driven output causing it to be more sensible Not only to the same it optimizes the resources and the efficiencyisunbitableandreliableintermsofanymeans.
It's an aspiring term in today’s time. One of the moves that all the firm are interested into. It’s a leading pillarfortomorrowleadingtheworldtoabetterfutureof evolutionwherethecustomizationandlaborworkcanbe reduce to half and the safety of the survival can be withheld to stand tall for the better utilization of human mind. Keeping that in picture it’s been a hazard to many more in terms of irrespective field of interest. Since Machine is considered most efficient and the level of mistakesarekeptattheminimumthelevelofwork flow canbeaworkofhazardandfurtherimprovementonthe samemaycreate thousandssittingidleinhomecreating a larger impact on unemployment and livelihood. Which inotherwayisathreattothesocietytoo. ML is the abbreviation for Machine Learning. In other word it is making a human mind fitting inside a machine which uses the same to perform the task of thousands. Machine Learning deals with the higher aspects of learning techniques and algorithm which are highly aligned to make the work flow seamlessly effortlesswiththehumantendencyofdoingwork.
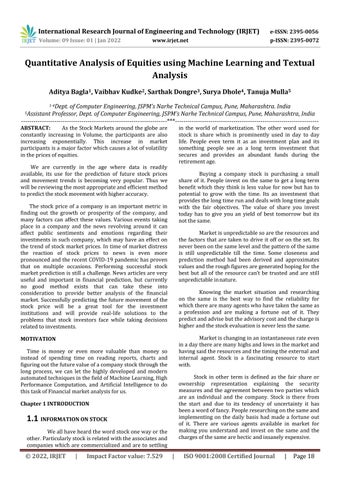
2.1.1 SUPERVISED LEARNING Supervised Learning deals with the supervision ofthemachinetoderivethenecessaryinputrequired.It’s amathematicalmodelwheretheinputsandoutputofthe same is already known and is passed to the machine to get expected output so that the efficiency is determined and this is the learning phase for the machine. Here the feedingandderivationofthesameismeasured. Here the machines filters the inputs learns from the functional unit. Compute it and stores it into its memory forfurtherprocessandiffoundamatchingpatternit
Fig2.1:SupervisedLearning uses the same and learns from it and plot a result out of thesame.Thisisadependentprocess.Themachinetotally depends on the user who has to feed the inputs and has tochecktheefficiencyofthesameandcorrectitwiththe flowofiteration.It’sanANNnetwork.Duringthetraining phasevectorsaretakenintoconsideration.
Up in the above figure There’s an input vector andtheoutputvector.Theinputvectorderivesandgives an output flow of the output vector. If the error signal is generated then the iteration is undergone where as lackingofthesamemeanstheoutputfieldisderivedand theoutputresultisaccurateandnomodificationneedsto beundergoneforsame.
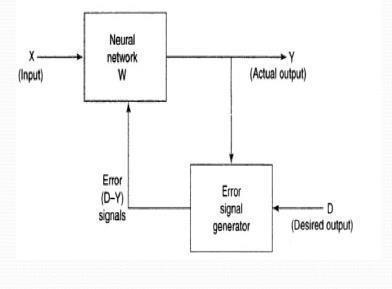
Unsupervised learning deals with learning by itself. It is also known as self learning algorithm. Here only the input vector is known and passed. So the variance of the result deals with the input factors. Here theinputfactorsaregroupedandclustered.Clusteristhe
These algorithms are used in Games and Automationofthevehicleresources.
International Research Journal of Engineering and Technology (IRJET) e-ISSN: 2395-0056 Volume: 09 Issue: 01 | Jan 2022 www.irjet.net p-ISSN: 2395-0072 © 2022, IRJET | Impact Factor value: 7.529 | ISO 9001:2008 Certified Journal | Page23 mainessenceofthistechnique.
TestDataarepassedandwiththeiterationofthe same it learns from it derives itself more closer to the conclusion part. Labelled is missed in the data set and classification and categorization of the same had to be donemythemachineitself.ClusterandCommunalization isthemainessenceofit.
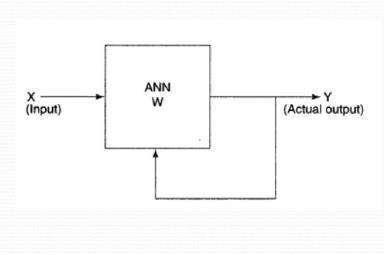
2.1.3 REINFORCEMENT LEARNING
As described in the figure 2.3 the input vector is passed to a ANN model where the functionalities of the same are stored. If the accurate output is derived then a rewardisgiventotheusermakingitgotothenextlevel forfurthertaskofcompletion.IfnotthentheErrorsignal isgeneratedforthesame.Theaccuracyleveliscalculated andpasseddowntotheuserstatingthesame. The user sees the percentage of match and pass downandtriesotherkeysofiterationtogetthemostout of it and complete the task to carry on the ladder of success. This is the same with the machine. Machine iterates the same and to the error signal an add on of reinforced signal is passed which the machine learn and iteratesonthesametogetclosertotheactualresults.
As described in the figure 2.2, In this ANN network whentheinputisprocessedbythefunctionthe outputhadtobeselfderivedandtobematchedwiththe cluster set to provide the result. If the result lacks the interpretationthenitundergoestheiteration.Allthedata sets are formed and combined in a cluster set for the effectiveusesofthesameinfurthercases.
Fig2.3:ReinforcementLearning
After the data collection, all articles are tokenized. This is done using the Natural Language Toolkit (NLTK), one of the leading platforms for building Python programs to work with human language data. Figure 2.4 displays the preprocessing.Ingeneral,tokenizationmeansdividingabig quantity of text into smaller parts called tokens. Machine learningmodels need numericdata to be trained andmake a prediction. Word tokenization becomes a crucial part of the text (string) to numeric data conversion. Following the tokenization, we can compute the “compounded sentiment score” using the BERT based Financial Sentiment Index (Hiew et al., 2019). This textual based sentiment index reliesonBERT(BidirectionalEncoderRepresentationsfrom Transformers)originallydevelopedbyGoogleandDevlinet al.(2018).BERT is an open source model that was pre trained with millions of words from the entire Wikipedia corpus, employing a bidirectional Transformer encoder to predict masked words. The model performs two tasks. First, BERT randomlymasksafractionofwordsandpredictsthewords thathavebeenmasked out.
In this type of learning a reinforced strategy is used. Its deals with blooming of the knowledge. It’s neither Supervised nor Unsupervised form of learning. They use dynamic techniques for letting the user know theoutputandthederivationofthesame. Inthesesortofalgorithmsetstheydon’tassume theenvironmentalset.Theseareevenusedinhigherand complexmechanismfindinglikesgeneticalgorithm.They are widely in progress and implemented most in automationforthebetterefficiencyoftheestablishment.
Fig2.2:UnsupervisedLearning
2.1.4 NATURAL LANGUAGE TOOLKIT
Feedbacksarenotreciprocatedincaseofsuchit responds to commonalities. If the commonalities are found between the dataset then it applies the previous functionalitiesandderivethedata.Ifnotsetthenitlearns andidentifiesfortheothers.
2.2.2 SURVEY II
Random forest algorithm is being used for the stock market prediction. Since it has been termed as one of the easiest to use and flexible machine learning algorithm, it givesgoodaccuracyintheprediction.Thisisusuallyusedin the classification tasks. Because of the high volatility in the stock market, the task of predicting is quite challenging. In stock market prediction we use random forest classifier whichhasthesamehyper parametersasofa decisiontree. The decision tool has a model similar to that of a tree. It takes the decision based on possible consequences, which includes variables like event outcome, resource cost, and utility. The random forest algorithm represents an algorithm where it randomly selects different observations and features to build several decision trees and then takes the aggregate of the several decision trees outcomes. The dataissplitintopartitionsbasedonthequestionsonalabel oranattribute.Thedata setweuseishistorical stockprice data,80%ofdataisusedtotrainthemachineandtherest 20%totestthedata.Thebasicapproachofthesupervised learning model is to learn the patterns and relationships in the data from the training set and then reproduce them for thetestdata.
2.2.3 SURVEY III
Neural Networks in finance are highly useful tools to analyze financial markets trends based on preprocessing and transforming a large amount of information into machine readable data And its main advantage is its wide variety of applications and the ability to process vast amount of information simultaneously, ignoring inclinations and biases to particularschoolofthoughts
2.2 TECHNICAL SURVEY
Using Neural Network as a case learning based method, the results of the research work demonstrated thatthenewssentimentsrelevanttostockmarketcanbe used to improve the performance of the learning based prediction. How many days the effects of the news will lastisalsoaninterestingthing,whichisworthyoffurther research.
2.1.5 RANDOM FOREST ALGORITHM
Sentimentfollows:=
The Sentiment is therefore the probability that the sentenceispositiveminustheprobabilitythatthesentence isnegative.
2.2.4 SURVEY IV
tokenized sentences are classified as positive, negative or neutral along with the respective probabilities (logits). The sentiment is calculated as LogitPositive LogitNegative
2.3 EXISTING SYSTEM
To evaluate the effectiveness of the model a comparison is made between the two techniques on five different sector companies using both Artificial Neural Network and Random Forest Model to predict closing prices. These predicted closing prices are subjected to Root Mean Square Error(RMSE), Mean Absolute PercentageError(MAPE),andMeanBiasError(MBE)for finding the final minimalized errors in the predicted price. The comparative analysis based on RMSE, MAPE, MBE values clearly indicate that Artificial Neural Network gives better prediction compared to Random Forest.
Fig2.4:ThepreprocessingstepsusingtheNaturalLanguage Toolkit(NLTK) Due to this pre training approach, BERT has outperformed various state of the art NLP techniques. For instance, it achieves an accuracy of 94.9 percent in thecompletionoftheStanfordSentimentTreebank.Hiew et al. (2019) apply BERT for the stock market prediction and we use this pre trained model for the sentiment analysis.All
International Research Journal of Engineering and Technology (IRJET) e-ISSN: 2395-0056 Volume: 09 Issue: 01 | Jan 2022 www.irjet.net p-ISSN: 2395-0072 © 2022, IRJET | Impact Factor value: 7.529 | ISO 9001:2008 Certified Journal | Page24
2.2.5 SURVEY V
2.2.1 SURVEY I
Among the most suitable algorithms for predicting the market price of stocks based on various datapointsfromthehistoricaldataisthe‘RandomForest Algorithm’alongwith‘SupportVectorMachine’.Random Forest is one of the easiest to use and flexible machine learning algorithm, having good accuracy in prediction models. This algorithm is used in classification tasks usually.
The application of long short term memory networks and Random Forest model to forecast directional movements of stock prices is researched. Siami Namini and Namin (2018) compare LSTM with an Autoregressive Integrated Moving Average (ARIMA) model. Multi feature setting consisting not only of the returns with respect to the closing prices, but also with respect to opening prices and intraday returns , outperformthesinglefeatureof Kraussetal.(2017)and FischerandKrauss(2018), bothwithrespecttoRandom ForestandLSTM.
As many have invested their time and effort in this world trade for getting it closer and more reliable to the
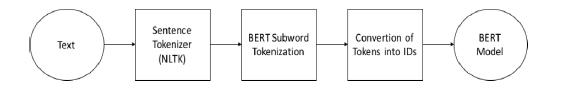
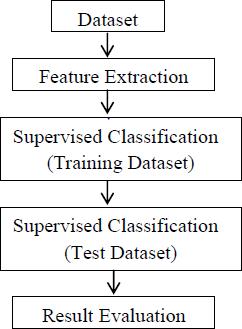
Fig2.5:ExistingSystemArchitecture 2.4 PROPOSED SYSTEM Stock is unpredicted and liberal in nature. The follow of the same is impressive and reluctant in nature. Finding the predictability and getting the nearest is the best hit goal for the same. The exact and accurate estimationofthesameisnever lesspossible.
International Research Journal of Engineering and Technology (IRJET) e-ISSN: 2395-0056 Volume: 09 Issue: 01 | Jan 2022 www.irjet.net p-ISSN: 2395-0072 © 2022, IRJET | Impact Factor value: 7.529 | ISO 9001:2008 Certified Journal | Page25
There are various constrains that in fluctuate the pricing and the rate of stock. Those constrains had to be taken in consideration before jumping to the conclusion andreportderivation.
people for carrying out the resources and make their lifestyle more deliberate than the previous. In the past few years various strategies and the plans had been derivedanddeployedeversinceit’scontinuationandthe topicisstillapointofresearchwherepeoplearecoming upwithideasto Intelligencesolve.fascinates mankind and having one in machine and integrating on the same is the hot key of research. There are various people contributing on the sameAllresearch.thelearning system from the past are limited and are simplest in nature where learning of the simple algorithmforacomputationalmeanisnotenoughwhich can even be done by human brain itself. The main motto of learning was limited and learning model was not efficient.The existing models can’t cope up with the vulnerabilities and remove the rarest information that they can’t process causing it a major data loss which createsaproblemin
StockHistoricalDataTestDataTrainingData Learning Algorithm (MakePrediction)Learning Algorithm (Learn AttributeRules) Selection Data EvaluateValidation)(CrossprocessingPreResults Another Learning Algorithm
Observationforecasting.istheintegral part in the resource and prediction management. If the outcome can’t be observed it’s point of time estimation is compromised causingitlessliableinmarket.Monitoringofthesameis notpossibleintheexistingsystem. The existing system in stock market predictions are apparently biased because it considers only a source pointfordatasource.Beforethepredictionofthedataset asimpledataretrievalshouldbegeneratedandtestedon thetrainingdatasetwhicharemoreflexibleandversatile innature.Loss of sights is a major problem in the existing systemasthestockvarieseachdaysandthelossmargin can be higher with respect to time. An initial instance is takenforNewsprediction.articles are a huge factor affecting the prices of stocks on a scale of short or even long term period,andmajorityofthemodelsinthemarketexisting currently ignore this factor and just consider the historicalpricedataasinput,andprocessonthesame.
Asthereactionofstockpricestofinancialnewsare verysensitiveinuncertaintimesoffinancialturmoil,itis necessary that we integrate that data in out model, So herewearelookingat


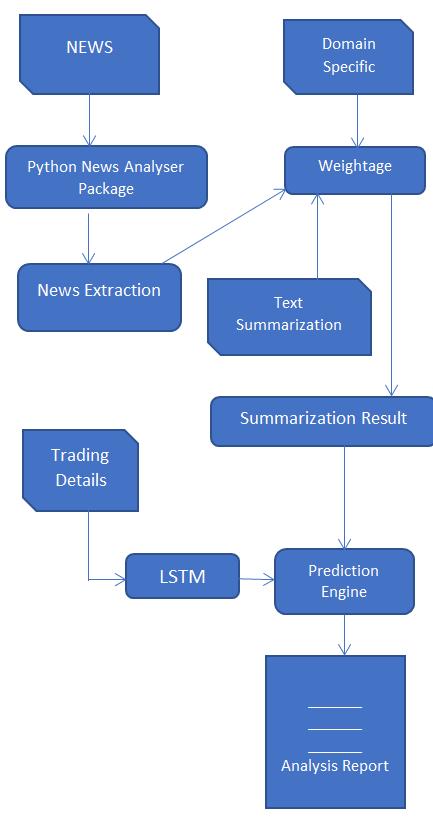
Fig2.6:SystemFlow ways to take news data from financial news sites, and use the ‘Natural Language Toolkit’ to perform analysis of the news and extract sentimental data regardingtheparticularStock.
Fig2.7:ProposedSystemArchitecture
Here as described in the figure above, the proposed systemwillhaveinputfromthedatasets,thesedatasetsare of two types, one containing the numerical data regarding the particular stock and its price, other data is the news convertedinformofparagraphsandthenintonumericdata for textual analysis using natural language processing. The classification technique used here is supervised and the various techniques of machine level algorithms are implementedonthesame.
Training Dataset are created for training the machineandthetestcasesarederivedandimplemented to carry out the visualization and the plotting’s. The result generated are passed and visualized in the
International Research Journal of Engineering and Technology (IRJET) e-ISSN: 2395-0056 Volume: 09 Issue: 01 | Jan 2022 www.irjet.net p-ISSN: 2395-0072 © 2022, IRJET | Impact Factor value: 7.529 | ISO 9001:2008 Certified Journal | Page26
CHAPTER 4 DESIGN
Similar to feeding somethings, machine/model should also learn by feeding and learning on data. The data set extracted from Yahoo Finance will be used to train the model. The training model uses a raw set of
3.1 FUNCTIONAL REQUIREMENTS
2.5.1 JUPYTER NOTEBOOK
4.1.2 Data Pre processing
3.2 NON FUNCTIONAL REQUIREMENTS
Jupyter Notebook or so called IPython Notebook is an interactive web based computational mean for starting withJupiterNotebookdocuments.Thetermnotebookitself is a huge entity to represent the integration with different entitysets.JSONisthemain documentformfromthesame fortheexecutionwhichfollowsthebriefontheschemaand the input and output means. It has high integration with several language set and has various flexibilities with the choices.
The extension used for the same is “.ipynb” which runs in this platform. It’s an open source software package with interactive communication means. It has it’s open standards for the same. It’s an open community best for budding programmers . The flexibility of the same is phenomenon and splendidly done the configuration and integrationofthesameissimplestandeasyonholdsothat no prior distortion is generated and the efficiency of the same is measured throughout any system of choice. It’s the bestsoftwaresetsthatbeenusedacrosscrossfordesigning and developing of the products and support wide help support.Not only to that, it provides scalability in the code and the deployment of the same. Various Language can be changed and the project can be undertaken on the same. The created notebook files can be shared and stored in various means for further utilization. It supports cultivated and interactive output sets. Easily crossed over for graphing,plottingandvisualizingoftheelements.
CHAPTER 3 REQUIREMENT ANALYSIS
The non functional requirements followed are its efficiency andhitgain ratio. The usability of the codefor the further effectiveness and to implement and look for the security console. The System is reliable and the performance is maintained with the support of integrationandportabilityofthesame.
Data Integration of the same is to its best. The integrationofbigdataanditcanprocesschunksofvaluesin an approx. time which gives a better performance and the higher computational means. Various works on data like cleaning, cleansing, transforming modeling and visualizing canbedonebythesame.
4.1.3 Training Model
4.1.1 Data Collection
4.1 DESIGN GOALS
Data collectionisone oftheimportantand basic thinginthisproject.Therightdatasetmustbeprovided to get robust results. Our data mainly consists of two parts, firstly the previous year or weeks stock prices. We will be taking and analyzing data from Yahoo Financeintheformof.csvfileformat.Afterthatseeing the accuracy we will use the data in our model. And secondis the newsarticledata fromfinancenewssites like Marketwatch, Reuters, NYTimes, Economic Times, Moneycontrol.Thiswillbeconvertedintonumericdata using Natural Language tools so machine learning algorithms can perform analysis of reader’s sentiments onthesearticleswiththeuseoftextualanalysis.
Non functionalrequirementdealswiththeexternal factors which are non functional in nature It is used for analysis purpose. Under the same the judgment of the operations are carried out for its performance. Stock is feasible and is ever changing so these extra effects and the requirements helps it to get the latest updates and integrateinaonego
Tomaketheprojectrunssmoothlyitsrequiredthat we make plan and design some aspects like flowcharts andsystemarchitecturewhicharedefinedbelow.
Functional requirements deals with the functionalityofthesoftwareintheengineeringview.The component flow and the structural flow of the same is enhancedanddescribedbyit. The functional statement deals with the raw datasetsthatarecategorizedandlearningfromthesame dataset. Later the datasets are categorized into clusters and the impairment of the same is checked for the efficiencypurpose.Afterthedatasetcleaningthedataare cleansedandthemachinelearnsandfindsthepatternset for the same, it undergoes various iteration and produce output.
Human can understand any type of data but machinecan’tourmodelwillalsolearnfromscratchso it’s better to make the data more machine readable. Raw data is usually inconsistent or incomplete Data preprocessing involves checking missing values, converting the data in a specific format as per the requirement of the model, splitting the dataset and trainingthemachinemodel,etc.
International Research Journal of Engineering and Technology (IRJET) e-ISSN: 2395-0056 Volume: 09 Issue: 01 | Jan 2022 www.irjet.net p-ISSN: 2395-0072 © 2022, IRJET | Impact Factor value: 7.529 | ISO 9001:2008 Certified Journal | Page27 graphicalform. 2.5 SOFTWARE DESCRIPTION
International Research Journal of Engineering and Technology (IRJET) e-ISSN: 2395-0056 Volume: 09 Issue: 01 | Jan 2022 www.irjet.net p-ISSN: 2395-0072 © 2022, IRJET | Impact Factor value: 7.529 | ISO 9001:2008 Certified Journal | Page28
data as the undefined dataset which is collected from the previous fiscal year and from the same dataset a refine view is presented which is seen as the desired output. For the refining of the dataset various algorithms are implemented to show the desired output.
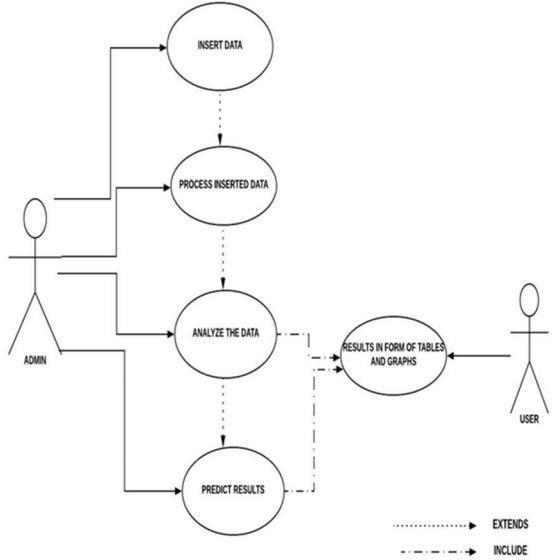
AdynamicandbehavioraldiagraminUMLisuse case diagram. Use cases are basically set of actions, services which are used by system. To visualize the functionality requirement of the system this use case diagram are used. The internal and external events or party that may influence the system are also picturized. Use case diagram specify how the system acts on any action without worrying to know about the details how thatfunctionalityisachieved.
For the project we have created the below mentionedusecasediagram. Fig4.2:UseCaseDiagram
Theabovefigure4.2showstheuse casediagramof theentitledprojectandit’s flow.Fromthediagramit’s seen that the user gives the raw dataset as input and withtheflowoftheinputinthesystem. The system evaluates and process the dataset train itself with the provided dataset and extract the meaningful dataset to process and refine the cluster dataandfromthegivenclusterofthedata,theplotting of the data values are shown and with the given range the system plots the data gives a figurative output as prediction and display the same as the refined output inthedisplayscreen.
4.2 SYSTEM ARCHITECTURE
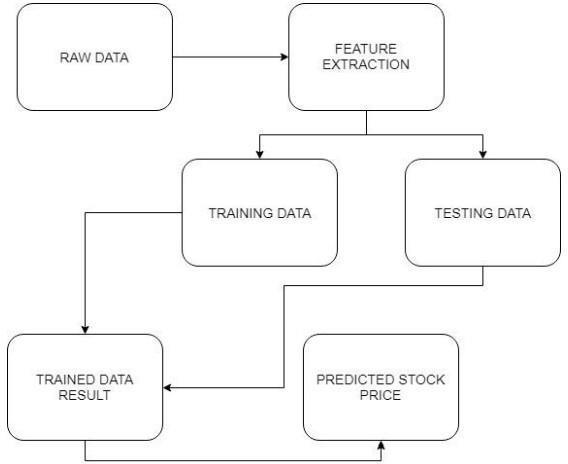
The dataset we use for the proposed project is been taken from Kaggle. But, this data set is in raw format. The data set is a collection of valuation of stock market information about some companies. The initial stepistoconvertrawdata intoprocesseddata.Whichis done by feature extraction, since the raw data collected havemultipleattributesbutonlysomeofthoseattributes are needed for the prediction. Feature extraction is a reductionTheprocess.structure, behaviorand views ofa systemis givenbystructuralmodel.
Theabovefigure4.1givesthedemonstrationon the dataset extraction and redefining the raw dataset by categorizingintotwophasesoftrainingandtesting
4.3 Use case Diagram
Fig4.1:SystemArchitecture
From the given dataset a well modified categorization is extracted and a graph set is plotted to gaintherequiredoutputwhichgivesthestockprediction range.
In conclusion, Stock prices are a very volatile and unpredictable mechanism consisting of a complex system, with variable dependencies and a constantly changingcurveturningthepricesofstocksconstantly. Thus the evaluation and analysis of this requires a robust system which contains a huge input, various functionalities, packages and the use of high level Machine Learning computational algorithms. These algorithms, and functions need to work in an integrated way to give a highly accurate prediction, and should be flexible to analyse and consider changes in input data, regardingthenewsreleases,andchangesinpricedata.
Overall the flow of processes involved is firstly collecting the data, Pre processing it and getting it ready to be given as input to training and testing models, then trainingthedata,testingthedatawiththetrainedmodel andplottingtheoutputtoconveyitsaccuracy.
[5] Mehar Vijh, Deeksha Chandola, Vinay Anand Tikkiwal, Arun Kumar, “Stock Closing Price Prediction using Machine Learning Techniques”, International Conference on Computational Intelligence and Data Science (ICCIDS2019)
[7] Pushpendu Ghosh, Ariel Neufeld, Jajati Keshari Sahoo, “Forecasting directional movements of stock prices for intraday trading using LSTM and Random Forest”, 30 June 2021, aDepartment of Computer Science and Information system, BITS Pilani K.K. Birla Goa Campus, India, bDivison of Mathematical Sciences, Nanyang Technological University, Singapore.
REFERENCES [1] titativeanalysis.asphttps://www.investopedia.com/terms/q/quan
[4] K. Hiba Sadia, Aditya Sharma, Adarrsh Paul, Sarmistha Padhi, Saurav Sanyal, “Stock Market Prediction using Machine Learning Algorithms”, April 2019, International Journal of Engineering and Advanced Technology (IJEAT)ISSN:2249 8958,Volume 8Issue 4
To further increase the accuracy of the model to depict the real time events identically, various ways can be figured out to exploit the news article data and historical data in more efficient manner, so as to predict exactly what the technical and numerical output will be and how the sentiments of the investors after reading news articles will change regarding that particular stock affectingitspricesinthenearfuture.
[2] machine1/microsofthttps://thecleverprogrammer.com/2021/06/2stockpricepredictionwithlearning/
[3] Zhaoxia Wang , “Stock Market Prediction Analysis by Incorporating Social and News OpinionandSentiments”,November2018
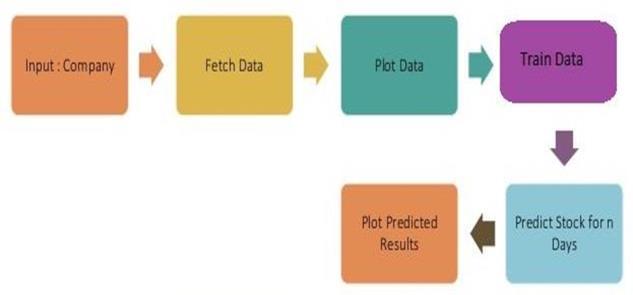
International Research Journal of Engineering and Technology (IRJET) e-ISSN: 2395-0056 Volume: 09 Issue: 01 | Jan 2022 www.irjet.net p-ISSN: 2395-0072 © 2022, IRJET | Impact Factor value: 7.529 | ISO 9001:2008 Certified Journal | Page29 4.4 Data Flow Diagram Fig4.3DataFlowDiagram In the above fig 4.3 we are taking a company fetching the data of the company from the panda’s data reader library then we are plotting the data, then we train the data to predict the stock for certain number of days. In thiswaydataisflowinginoursystem. CONCLUSION & FUTURE WORK
[6] Thierry Warin, Aleksandar Stojkov, “Machine Learning in Finance”, 2 July 2021, Journal of RisksandFinancialManagement.
In all this process it is found out that, although complex and intricate, the prediction of future stock prices is possible that too with a good accuracy, and the tools helpful in this are Machine learning tool.
In this paper various high level machine learning and artificial intelligence algorithms are discussed and implementedto givea highlyaccurateoutput prediction, which is identical to the real events to a large extent. In this process the raw data taken is the historical trading prices of the company’s stocks, and the news articles from a news site of a certain time period. The relation betweenthestock pricesandtheirreactions toregularly updating news is alsoconsidered and taken into account in order to increase the accuracy of the model’s predictionwithrespecttoreallifeevents.
Specificially, the Random Forest classifier algorithm is found out to be a majorly useful tool, as it is easy to implement, Artificial Neural Network is regarded to give good accuracy in the output. Various other algorithms and tools like Autoregressive integrated moving average (ARIMA), Long Short time series(LSTM), times series, mean square error, etc are also proven as a very useful partofthemodel.AndapartfromthattheuseofNatural language processing for the textual analysis of news articles to derive the sentiments around a particular stock proves as an helpful extra factor to give a rough ideaaboutthefuturemovementofthestockprice.
International Research Journal of Engineering and Technology (IRJET) e-ISSN: 2395-0056 Volume: 09 Issue: 01 | Jan 2022 www.irjet.net p-ISSN: 2395-0072 © 2022, IRJET | Impact Factor value: 7.529 | ISO 9001:2008 Certified Journal | Page30 [8] Michele Costola, Michael Nofer, Oliver Hinz, Loriana Pelizzon, “Machine Learning Sentimen analysis, COVID 19 news and Stock Market reactions”, 11 September 2020, Leibniz InstituteforFinancialResearchSAFE. [9] Shangxuan Han, “Stock Prediction with RandomForestandLongShortTermMemory”, Fall2019,IowaStateUniversity,Ames,Iowa.