2. OBJECTIVES
The Vrishabhavathi river water was once used by people around Bangalore. Industrial, agricultural and domestic effluents are flowing into the river daily. The Vrishabhavathi watershed carries effluents from various industrial areas viz. peenya, Rajajinagar, Bidadi and kumbalagodu industrial area along with domestic sewage effluents
1. INTRODUCTION
To develop a groundwater flow model for Vrishabhavathi river stretch of peenya industrial area byusingvisualmodflowFlexsoftwarewith the combination of MODFLOW MODPATH and MT3DMS. To study the groundwater Hydraulic head distribution across the study area using MODFLOW. To identify the direction and movement of the TDS plume in groundwater using MODPATH package. ToassesstheTDSconcentrationinthestudy area UsingMT3DMS. Predict the future TDS concentration in groundwaterofthestudyarea. To suggest remedial measures to improve the futuregroundwaterqualityofthestudyarea
3. LITERATURE REVIEWS
A. Sushant Kumar et al., (2017), studied on groundwaterresourceassessmentinBinariverthrough groundwater modelling. This river water was used for domestic water supply and irrigation supply in Bina river basin Groundwater modelling in Bina river basin wascarriedoutusingvisual modflow tounderstanding the groundwater resources at Bina River basin The model was run by taking two layered aquifer. The modelwascalibratedduring2009pre monsooninBina RiverBasin.Theobtainedmodelresultsarecomparable with the observation data during modelling process.
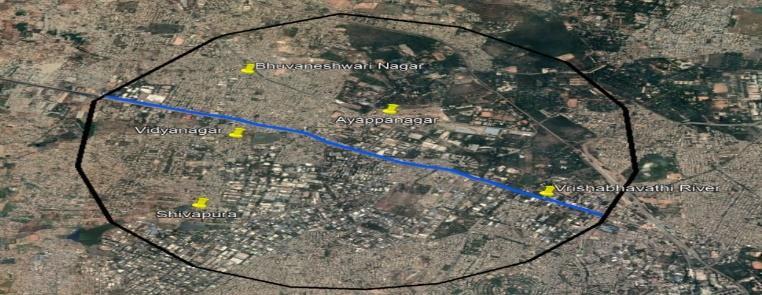
The River Vrishabhavathi, has got two origins One originating from the Peenya industrial suburbs and the other from Gavipuram in Guttahalli. Both of the streams join together in Nayandahalli, flows as a single unit from there and joins the River Arkavathi The length of the riveris52kmandhasbasinsizeofabout382sqkm.Many industrial units presentalongthe basin directlydischarge their effluents into the river. Only 18% of them are found to possess effective effluent treatment plants. Along the Mysore road there are numerous textile industries, factories manufacturing industrial components and carbonated drinks etc. discharge their untreated waste and effluents directly into the river via their drainage systems. The residents along the bank directly dump all the domestic wastes into the stream. There are also a number of plantations and agricultural fields along the basinwherethesametoxic waterisutilizedforirrigation. Now,thisisa potentialhealththreatastheplantstakeup components, which ultimately enters the human body through consumption causing the respective metal poisoning.Inthiscontext, presentstudyisundertaken to predict the future groundwater quality and to suggest remedial measures of the Vrishabhavathi river stretch alongPeenyaindustrialarea.
Vrishabhavathi river that flows along peenya industrial area receives wastewater from near by industries which contains high levels of TDS exceeding the industrial effluent discharge standards, most of the industrial waste ends up flowing into the Vrishabhavathi River thus polluting groundwater. As we cannot see into the subsurface formation, we need a tool that could provide insight into the complex system behaviour this is where groundwater models come into play. Visual MODFLOW flex is one of the groundwater modelling software helps in assessing and forecasting the quality of groundwater. The present study thus aimed at assessing the influence of pollution in the Vrishabhavathi river stretch of peenya industrial area on the quality of groundwater using visual modflow flex. In order to understand the quality of ground water in the study area, TDS was consider as the parameter for the study.
International Research Journal of Engineering and Technology (IRJET) e ISSN: 2395 0056 Volume: 08 Issue: 12 | Dec 2021 www.irjet.net p ISSN: 2395 0072 © 2021, IRJET | Impact Factor value: 7.529 | ISO 9001:2008 Certified Journal | Page1506 GROUNDWATER QUALITY MAPPING AND FORECASTING ALONG VRISHABHAVATHI RIVER STRETCH OF PEENYA INDUSTRIAL AREA BY VISUAL MODFLOW FLEX Pushpa G.R1, Dr B Santhaveerana Goud2 1PG Student, Department of Civil engineering, University Visvesvaraya College of Engineering, Karnataka, India 2Professor of Civil Engineering, Department of Civil Engineering, UVCE, Bangalore University, Bengaluru, Karnataka, India. *** Abstract
.
Key Words: Vrishabhavathi river, peenya industrial area, industrial effluents, groundwater modelling, visual modflow flex.

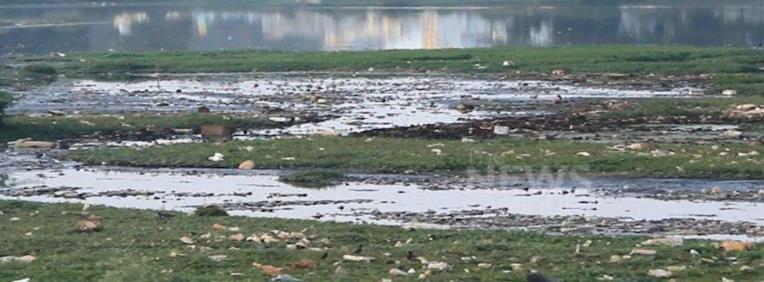
Figure 4.2 : Polluted water flowing along peenya industrial area
4.2 Data collection Data collection plays an he important role in any modelling process. For this research purpose,dataare collected from various departments Viz KSNDMC, literature studies, CGWB reports, Groundwater Year Book, Minor Irrigation Department, Ground water directorate office Bangalore Longitudinal
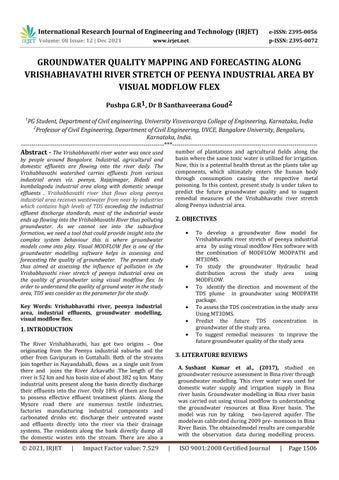
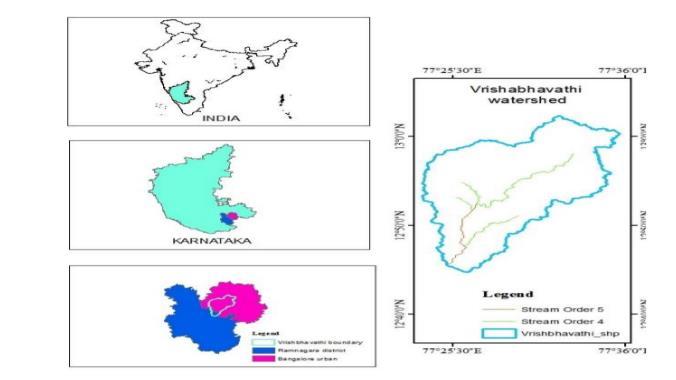
Figure 4.1: Location of the study area
International Research Journal of Engineering and Technology (IRJET) e ISSN: 2395 0056 Volume: 08 Issue: 12 | Dec 2021 www.irjet.net p ISSN: 2395 0072 © 2021, IRJET | Impact Factor value: 7.529 | ISO 9001:2008 Certified Journal | Page1507
The major industries in the study area includes textile, bleaching, chemical and dyeing industries. These industrial units arelocated on either side of Vrishabhavathi river within 3Km from theriver .After treatmentthe effluentis discharged into river Vrishabhavathi, the effluent contains high TDS exceeding the industrial effluent discharge standards this is because all industries doesn’t have effluent treatment plants in their premises the hence for the study TDS is taken as a parameter.
The modelling results showed that to reduce the groundwater stress it is advisable to redistribute the pumpingwells. B. R.Rajamanickam et al., (2010), studiedAmaravatiriver basin which is severely polluted due to discharge of partially treated effluent at the downstream of Karur Townbyvariousdyeingtextileandbleachingunits.Daily about 14600 m3 of coloured effluent is flowing into the riverbyvariousindustrialunits Totaldissolvedsolids of 5000 10000 mg/L is discharged into the river daily using Visual MODFLOW 2.8.1 the study was done , the MODFLOW, and MT3D models were calibrated and validated. The validated model was used for simulation for next 15 years under 5 different scenarios of groundwater quality: (i) if the present system with TDS 10,000 mg/L discharge into river, (ii) if the CETPs discharge the effluent into river with TDS discharge standards of 2100 mg/L and, (iii) if the TDS level is doubled of 2100 mg/L, (iv) if the dyeing units go for reverse osmosis plant to achieve zero discharge and recycle the entire effluent , (v) 1.5 times groundwater recharge and zero discharge by the units. The obtained results showed that even if the effluent met discharge standardsforthenext10years thereisnoimprovement in groundwater quality. there would be an improvement inthequalityofgroundwaterovera periodoffewyears if unitsoptzerodischarge
4. Materials and Methodology 4.1 Study Area 4.1.1 Location details of the study area: Peenya industrial area islocated on the bank of river Vrishabhavathi
The study area taken, is Vrishabhavathi river stretch of Peenya Industrial area of about 6 km length which has area of about 28.40 ,which is covered in part of the Survey of India Topo Sheet Nos. 57 G/12 and 57 H/8 . This industrial area was established in 1970s. In north westernsuburbsofBangalore the peenya industrial area is located with Latitude 13° 1' 42"N and Long 77° 30' 45"E. Dissected topography can be seen in theWesternpartofthearea whereastheeasternpart is a level plain. Geologically the area has Achaean era. The major rock types are Gneiss, dyke and granite. The area has gentle slopes and valleys with evenly flat. Predominantly area overlaying by granite and gneiss and redsoilisfoundinthearea.Thesoilisexcessivelydrained and moderately to severely eroded. The drainage pattern isrunningnorth northeasttosouth southeast
The base map was clipped using Survey of India Toposheet and georeferenced using ArcGIS. Base map was imported into the model screen in.SHPformat.
6.1.3 River Boundary : The river boundary condition was assigned because the Vrishabhavathi river acts as a source of recharge for the aquifer in the study area. The data regarding Vrishabhavathi river including river stage, riverbottom,riverbedthickness,conductivity,riverwidth wasassignedwiththedatacollectedfromMinorIrrigation Department
6.1.2 Assigning Layer Elevations (Above Mean Sea Level) : For modeling purpose two layers were considered throughout the study area. The top layer is shallowweatheredzoneofthickness30mandthebottom layer is deeper fractured rock with thickness of 230 meters. By using Google Earth Pro, the actual elevation (amsl)ofthetwolayerswasenteredbyimportingthetext file,whichcontainedtheelevationdata.
Figure 6.1: Model Screen with study boundary, riverboundary and inactive cells
6.1 Modflow Model input 6.1.1 Preparation of Base Map
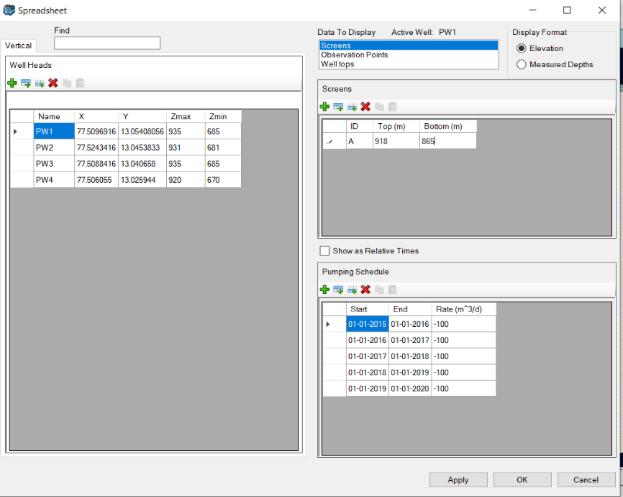
6.1.5 Pumping Wells : four pumping wells are consideredinthestudyarea.wellscreensforthepumping wellswereconsideredfrom17mbglto70mbgl. stage 898m
International Research Journal of Engineering and Technology (IRJET) e ISSN: 2395 0056 Volume: 08 Issue: 12 | Dec 2021 www.irjet.net p ISSN: 2395 0072 © 2021, IRJET | Impact Factor value: 7.529 | ISO 9001:2008 Certified Journal | Page1508 dispersivity of 30 m and transverse dispersivity of 10 m were assumed for the study area. Uniform pumping rate of100m3/daywasassumedforthepumpingwells. 5. Methodology
Table 6.1 : Vrishabhavathi river Details
1 River
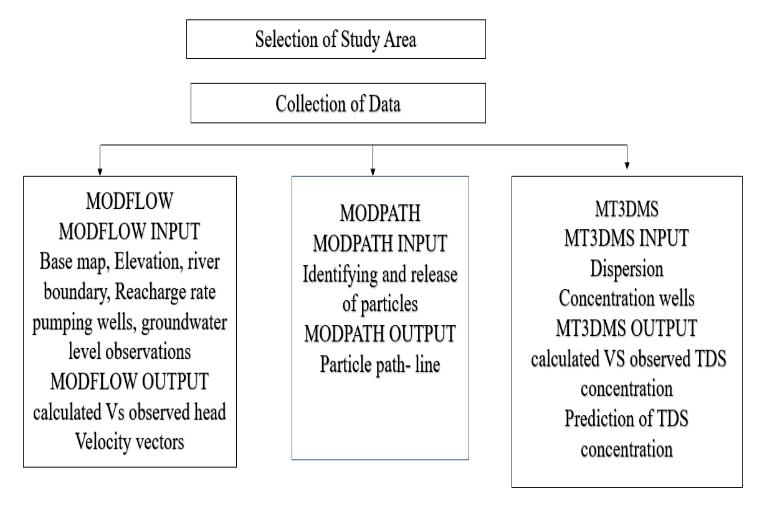
Figure 5.1 : Flow chart of modelling process DATA ANALYSIS AND INTERPRETATION
Visual MODFLOW (VMOD) Flex is a powerful software package that provides the tools for building three dimensional groundwater conceptual and numerical models this Modelling software combines MODFLOW whichisusedtocalculatethegroundwaterdistributionin the study area. MODPATH for particle tracking and identifying their movement.MT3DMS provides information about contaminant transport in groundwater flow systems under general hydrogeological conditions. A combination of MODFLOW, MODPATH, and MT3DMS are used to develop a model for the study area. The present study has been carried out using visual modflow flex which is a 3D dimensional groundwater modelling software , to asses the present and future TDS concentrationinthestudyarea
.
6.1.4 Recharge rate: Therechargepackageisdesigned to simulate aerial distributed recharge to the groundwater system A Reacharge of 65mm/year is assumedforthestudy.
2 River bottom 894m 3 Riverbed thickness 2.5m 4 River width 16 40m 5 conductivityRiverbed 1E - 2
6.
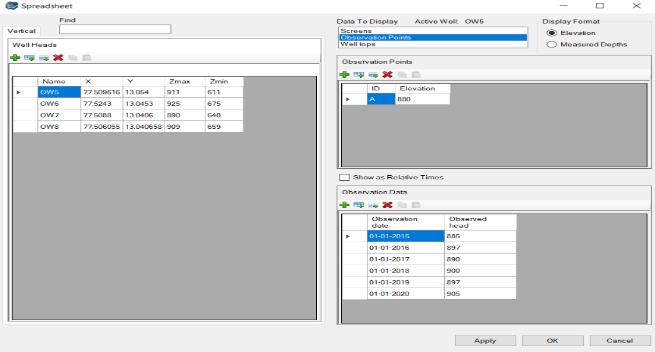
International Research Journal of Engineering and Technology (IRJET) e ISSN: 2395 0056 Volume: 08 Issue: 12 | Dec 2021 www.irjet.net p ISSN: 2395 0072 © 2021, IRJET | Impact Factor value: 7.529 | ISO 9001:2008 Certified Journal | Page1509 Figure 6.2 : Pumping well data assigned into the model. 6.1.6 Assigning Groundwater Level Observations: Visual MODFLOW flex allows to input data such as groundwater level observations which is shown in below figure Figure 6.3 : Observation well data assigned to model 6.2 MODEL RUN Aftercompletingtheinputparameters,Byselecting[Run] intheMainMenu,SelectRunTypedialogueboxappears, the modelwasrunundertransientcondition.
6.3 MODEL OUTPUT MODFLOW output provides graphs of calculated vs observedheads,velocityvectors.
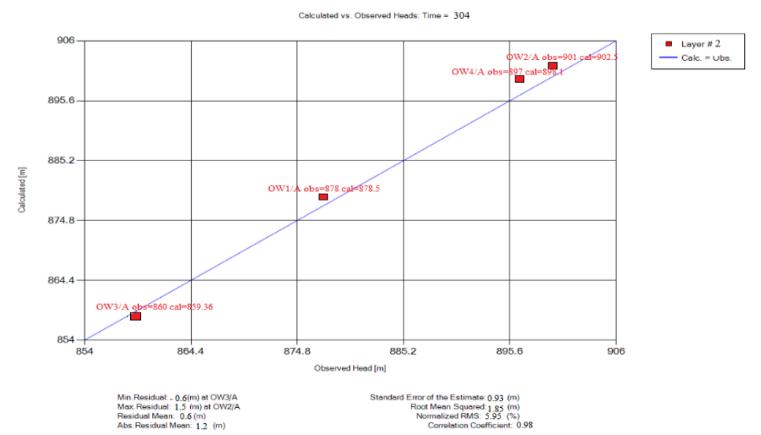
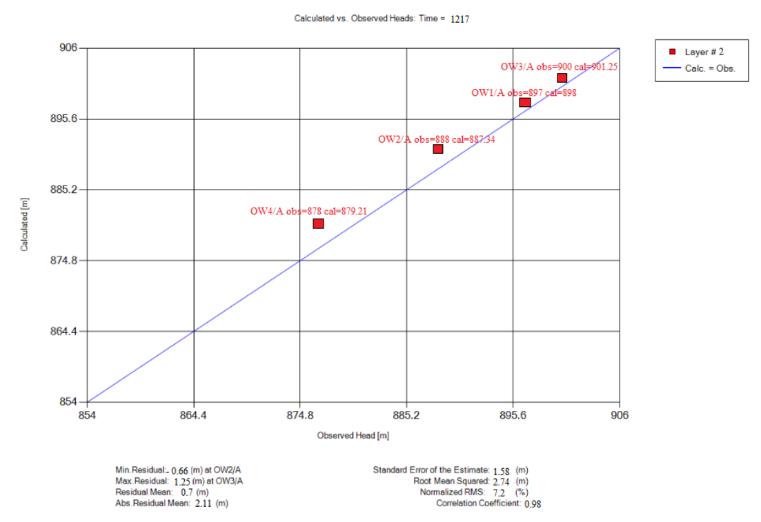
Figure 6.4 : Calculated Vs Observed groundwater level (above MSL) for the year 2015. Figure 6.5 : Calculated Vs Observed groundwater level (above MSL) for the year 2018
6.3.1 Transient State Calibration
The transient (dynamic) calibration is carried out for the time period from year 2015 to year 2019 (1520 days). From the graph of calculated head vs. observed it was seen that the calculated values were very closer to the observedvalue.Thegraphconsistsofthecontinuousblue lineindicates100%correlationbetweentheobservedand calculatedvalues.
6.3.1.1 Chart Showing Calculated vs Observed Heads for the year 2015 and 2018 Thecalibratedchartfortheyear2015showedgoodmatch between the observed head in the field versus the model calculated head values. The standard error of estimation was 0.93 m and the root mean squared value was 1.85 m which implies the error of less than 5%. The calibrated chart for the year 2018 showed good match between the observed head in the field versus the model calculated headvalues.Thestandarderrorofestimationwas1.58m and the root mean squared value was 2.74 m which impliestheerroroflessthan5%.
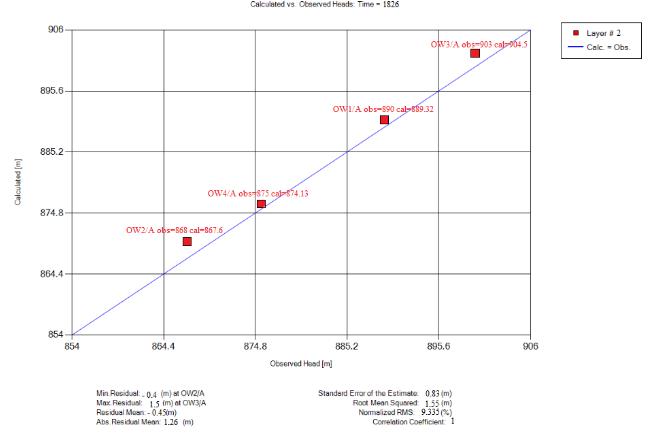
The model is validated with the year 2020 water level data.Thestandarderrorofestimationwas0.88mandthe root mean squared value was 1.55 m which implies the erroroflessthan5%.
6.3.1.2 Modflow Model Validation
The MT3DMS was run for a total 3650 days with 1000 transport steps. Upstream Finite Difference method and implicit Generalized Conjugate Gradient (GCG) Solver which is iterative solver was used to solve the mass transportequation. 8.3 MT3DMS OUTPUT
8.1.2 Dispersion: longitudinaldispersivityof30mand transversedispersivityof10mwereuniformlyassumed fortheentirestudyarea..
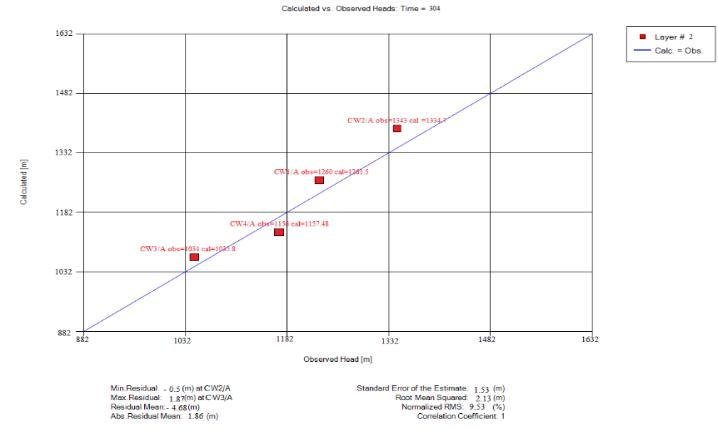
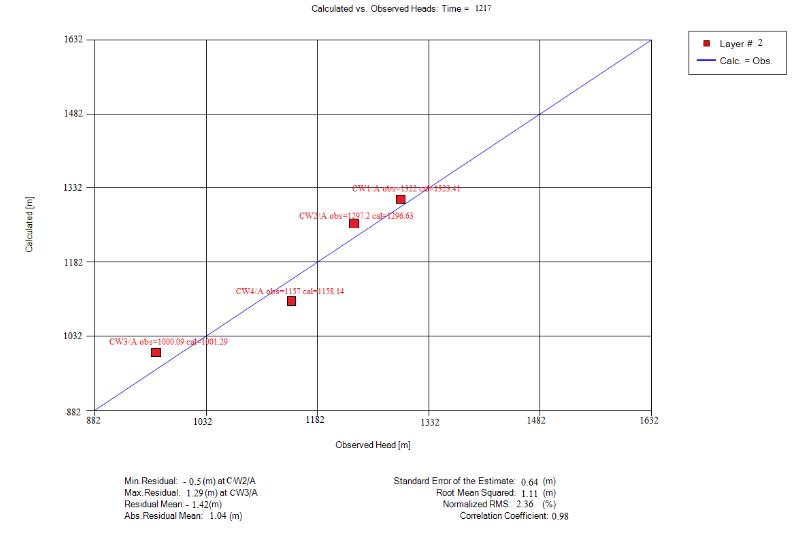
Thecalibratedchartfortheyear2015showedgoodmatch between the TDS concentration that was observed in the field versus the model calculated TDS concentration values. The standard error of estimation was 1.53 mg/L and the root mean squared value was 2.13 mg/L which impliestheerroroflessthan5%.Thecalibratedchartfor the year 2018 showed good match between the TDS concentration that was observed in the field versus the model calculated TDS concentration values. The standard error of estimation was 0.64 mg/L and the root mean
8.1.4 Assigning Groundwater Concentrations
Four concentration wells were in the study area. TDS concentration obtained for the last 6 years (2015 2020). Thewell screenelevation wasgivenat45mbgl forall the four concentration wells. TDS concentration for each specificwellwasassignedonobservationdates
8.3.1 Chart Showing Calculated vs Observed Concentrations for the year 2015 and 2018
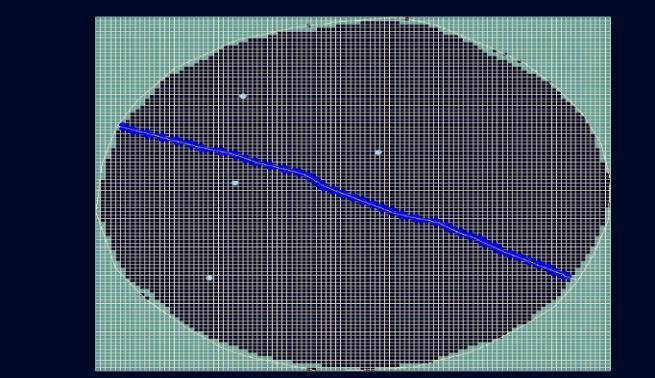
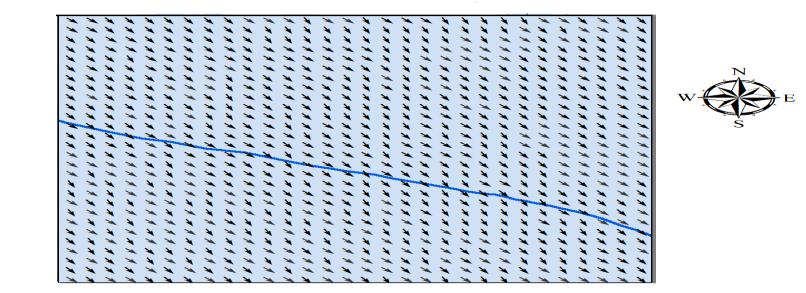
International Research Journal of Engineering and Technology (IRJET) e ISSN: 2395 0056 Volume: 08 Issue: 12 | Dec 2021 www.irjet.net p ISSN: 2395 0072 © 2021, IRJET | Impact Factor value: 7.529 | ISO 9001:2008 Certified Journal | Page1510 Figure 6.6 : Chart showing Calculated vs Observed heads for 1826 days. 6.3.2 Velocity Vectors Velocity vectors shows the ground water flow is from North west to West to south east directions following the gravitational flowi.e.,from a regionofhigher elevation to thelowerelevationside. Figure- 6.7 : Velocity vectors in the study area 7. MODPATH PATHLINE TRACKING MODPATH can be used to compute three dimensional path lines and the position of particles at specified points intime. 7.1Modpath Input Particles are assigned on the boundary of the study area coveringsourceofpollution 7.2 Modpath Output TheoutputfromtheMODPATHincludestheparticlepath line direction of the groundwater which was towards the East direction of the study area. movement towards the southeastdirectionoftheriver. 8. 8.1MTEDMSMT3DMS
Input
MT3DMSoutputprovidescalculatedversusobservedTDS concentrationgraph.TheCalibrationofthemodel isdone by adjusting the dispersion values by trial and error method.
Recharge Concentration : In the recharge concentrationoption,TDSconcentrationthataccompanies the flow boundary is specified in the corresponding flow boundary. Due to rapidurbanization and by considering the rise in the TDS concentration, suitable recharge concentrationswereassignedtothemodel.
8.1.3
8.1.1 Initial Concentration:Theinitialconcentration of TDS level for the study area was assigned based on 2015 groundwater quality data. The initial TDS concentrationisassignedintermsofpolygonranging.By using copy option, the layer 1properties are copied to layer 2whereeverapplicable.
8.2 MT3DMS RUN
The TDS concentration is predicted in the study area under three different Scenario. Prediction is done for 10 yearsi.e.,fromtheyear2020to2030. Fourwellscloseto the study area were considered and their impact on the ground water was studied. Four wells are located at Bhuvaneshwari nagar, Ayyappa nagar, Vidyanagar, shivapura If the present scenario i.e. river pollution without any control measure continues for next 10 years, what will be the impact on the groundwater qualitybytheendofyear2029. ifindustriesmeetTDSdischargeof2100mg/land discharge effluents into the river for next 10 years,whatwillbetheimpactonthegroundwater qualitybytheendof2030. Ifimprovedcontrolmeasuresaretaken,suchthat zero discharge is practiced by the industries for the next 10 years, what will be improvement in thegroundwaterqualitybytheendofyear2029.
International Research Journal of Engineering and Technology (IRJET) e ISSN: 2395 0056 Volume: 08 Issue: 12 | Dec 2021 www.irjet.net p ISSN: 2395 0072 © 2021, IRJET | Impact Factor value: 7.529 | ISO 9001:2008 Certified Journal | Page1511 squared value was 1.11 mg/L which implies the error of lessthan5%.
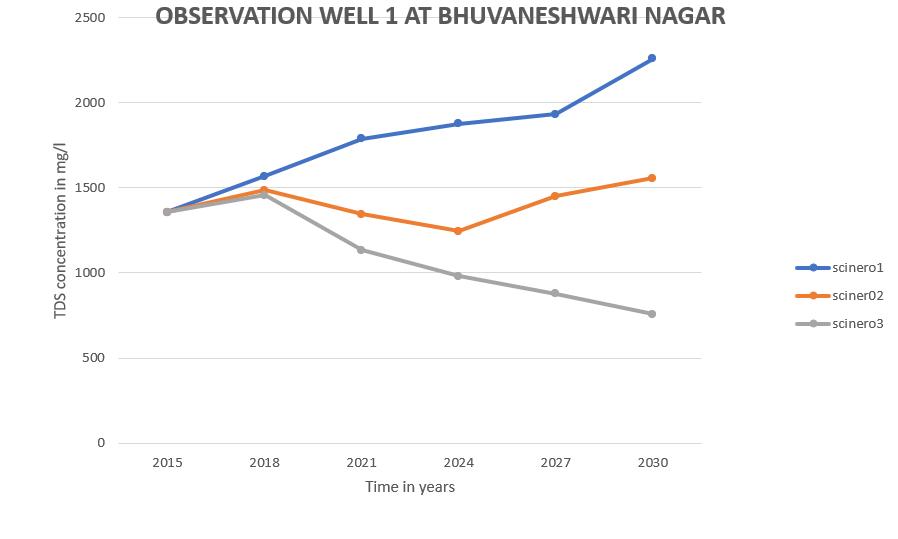
Figure 9.1 : Forecasted values of TDS concentration in groundwater at Bhuvaneshwari nagar observation well from year 2015 to 2030 for three different assumed scenarios.
Figure 8.4 : chart showing the Calculated Vs Observed Groundwater Concentration (mg/L) for the year 2020.
9. PREDICTION OF TDS CONCENTRATION IN THE STUDY AREA
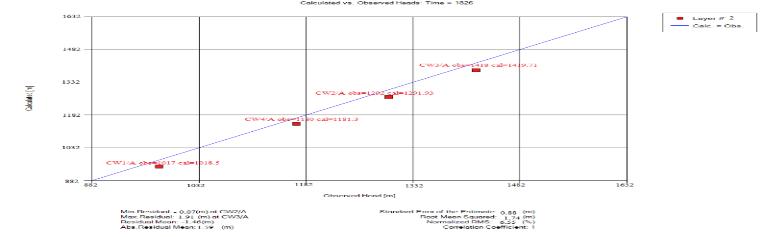
Figure 8.2: Calculated Vs Observed Groundwater Concentration (mg/L) for the year 2015 Figure 8.3 : Calculated Vs Observed Groundwater Concentration (mg/L) for the year 2018 8.3.3 MT3DMS Validation After the calibration, the model was validated to data observed in the year 2020 i.e., for the 1826 day. The calibrated chart for the 1826th day showed good match between the TDS concentration that was observed in the field versus the model calculated TDS concentration values. The standard error of estimation was 0.88 mg/L and the root mean squared value was 1.74 mg/L which impliestheerroroflessthan5%.
The four observation wells located at Bhuvaneshwari nagar,Ayyappanagar,Vidyanagar,shivapurafortheabove three scenarios the forecasting is been present in below figures9.1,9.2,9.3and9.4respectively.
From this study,itcomes to understand thatVisual MODFLOW flex can effectively beused for studyingthepollutantmigration inariver basin.The outputfromMODFLOW,MODPATHandMT3DMSare a.asfollows:Theoutput from the MODFLOW shows that the head(groundwaterlevel)usedforthecalibration andthevalidationstephasagoodmatchbetween observed values and model calculated values for all the four observation wells. From the velocity vectors groundwater direction in the study area can be calculated. The direction of groundwater flowisfromthenorthwesttosoutheastdirection, following the gravitational flow from the higher elevation in the northwest direction towards the lower elevation on southeast direction of study area.
c. The output from the MT3DMS model shows the TDS concentration of groundwater at all the four concentration wells considered to have a good match with the observed and model calculated TDS values for both calibration and validation steps.
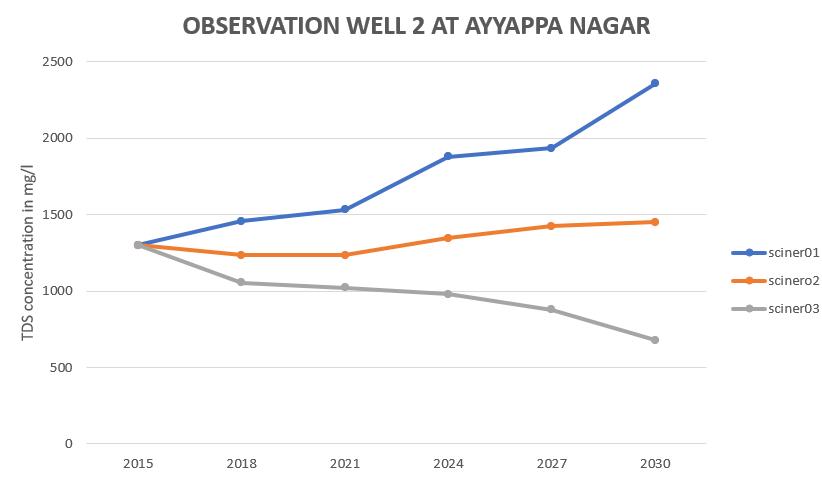
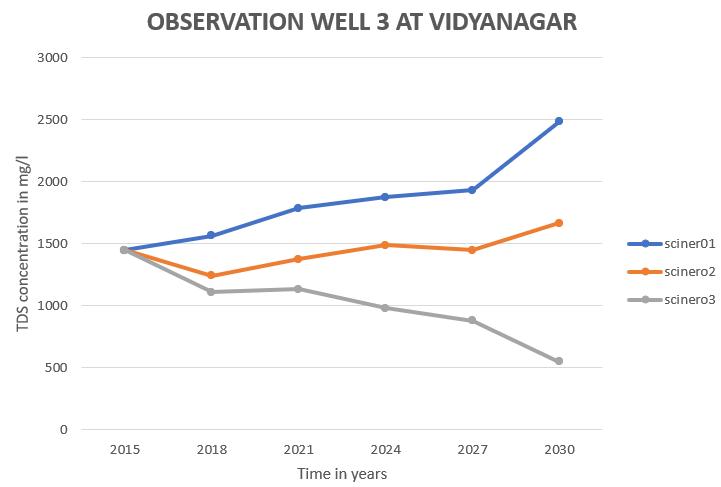
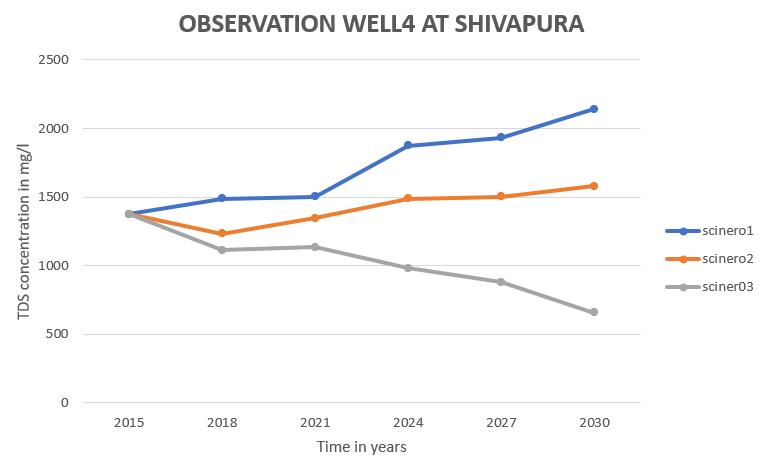
1. The prediction for the three scenarios are as (a)follows:TDS concentration in the groundwater at the end of 2030 under present condition i.e., the scenario1showsthat,thereisincreasingtrendin the groundwater contamination as the TDS concentrations have reached 2258mg/l, 2357 mg/l, 2487 mg/l, 2140 mg/l at Bhuvaneshwari nagar. Ayyappa nagar, vidya nagar, shivapura concentrationwellrespectively. (b) TDS concentration in the groundwater at the end of 2030 for Scenario 2 i.e., If industries meet TDS discharge of 2100 mg/l and discharge effluents into the river, shows that there is an increasing trend but below the tolerance limit where the values have reached 1558mg/l, 1450 mg/l , 1667 mg/l, 1578 mg/l at Bhuvaneshwari nagar , Ayyappa nagar, vidya nagar, and (c)shivapuraconcentrationwellrespectively.TDSconcentrationinthegroundwater at the
10. CONCLUSIONS
International Research Journal of Engineering and Technology (IRJET) e ISSN: 2395 0056 Volume: 08 Issue: 12 | Dec 2021 www.irjet.net p ISSN: 2395 0072 © 2021, IRJET | Impact Factor value: 7.529 | ISO 9001:2008 Certified Journal | Page1512
The following conclusions can be drawn from the study basedontheresultsobtainedaftersimulatingthemodel:
Figure 9.2 : Forecasted values of TDS concentration in groundwater at Ayyappa nagar observation well from year 2015 to 2030 for three different assumed scenarios.
Figure 9.3 : Forecasted values of TDS concentration in groundwater at Vidyanagar observation well from year2015 to 2030 for three different assumed scenarios.
Figure 9.4 : Forecasted values of TDS concentration in groundwater at observation well shivapura from year 2015 to 2030 for three different assumed scenarios
b. The output from the MODPATH derives the particle path lines that showed the contaminant plume in groundwater moving towards the southeast direction of the study area i.e., impactingthesoutheastside toagreaterextent.
[1]Rajamanickam (2011)modeling using visual modflowof Amaravatiriverbasinofkarurdistrict
2. Results of model simulation for present scenario (scenario 1) depicted that the TDS concentration is increasing this is because industries are letting their pollutants in the river without proper treatment and not meeting the tolerance limits
3. Remedial measures to improve the groundwater qualityoftheriverare:Theindustrialareashould have a common effluent treatment plant (CETP) to process the liquid/solid effluent generated from different industries and no liquid waste disposal may be allowed within the industrial area as in situ infiltration rates of top granitic is high.
[9]RajakumaraHN,GaneshRajK,RameshKS,VidyaA, Ajay Kumar V (2019)Rainfall Analysis of VrishabhavathiValleyinBengaluruRegion
[2]Sushant Kumar M. K. Choudhary T. R. Nayak ( 2017 ) ,Groundwater Modelling in Bina River Basin, India using Visual Modflow IJSRD International Journal forScientificResearch&Development [3]Waterloo Hydrogeologic Inc. (2019) a visual modflow flex 6.1 Integrated Conceptual & Numerical Groundwater Modeling Software User’s Manual”, www.waterloohydrogeologic.com © 2019 by Waterloo Hydrogeologic . . Published: July 2019 in Waterloo,Canada
[6]Dr. Prasanna Kumar S.C ( 2019) Real Time Water Quality Monitoring system for Vrishabhavathi RiverofBengaluru
The TDS concentration in groundwater obtained after 10 years still was not meeting the tolerance imits prescribedfortheindustrialeffluentbythe BureauofIndianStandardsfor TDSis2100mg/l Into inland Surface Waters. Results of model simulation for scenario 2, showed that the TDS concentrationinthefourconcentrationwells are below the tolerance limits this is because if industries treat the effluents to tolerance limits prescribed by bureau of Indian standards the pollution of the river can be controlled. By adopting the remedial measures (scenario 3), it was seen that the TDS concentration had been significantlyreduced.
[8]Ramachandra T.V VinayS Rejuvenation Blueprint forVrishabhavathivalley
the values are
end 2030 for Scenario 3, If remedial measures such as zero discharge is practiced by industries reducing the TDS concentration a declining trend where 756mg/l, 680 mg/l, 550 mg/l, 658mg/l concentration
[10] Vijay Chellaram ( 2017) Vrishabhavathi Valley WastewaterTreatmentPlantSystemUpgrade
well respectively.
[4]Karnataka State Pollution Control Board (KSPCB) Bangalore, Karnataka (2018), Assessment of groundwater conditions and water quality around PeenyaIndustrialDevelopmentArea
Bhuvaneshwari nagar. Ayyappa nagar, vidya nagar, shivapura
[7]Priyanka Jamwal and Sharachchandra (2017) Lessons from the Vrishabhavathi river in BengaluruAddressingpollutioninurbanrivers
shows
International Research Journal of Engineering and Technology (IRJET) e ISSN: 2395 0056 Volume: 08 Issue: 12 | Dec 2021 www.irjet.net p ISSN: 2395 0072 © 2021, IRJET | Impact Factor value: 7.529 | ISO 9001:2008 Certified Journal | Page1513
11. REFERENCES
of
[5]B. S. Shankar & N. Balasubramanya & M. T. Maruthesha Redd( 2008) a case study of Peenya industrial area, Bangalore. Impact of industrializationongroundwaterquality