highisdiscoverwhichoneprovidesthebestresults.Thesecondgoaltofigureoutwhichcharacteristicsaremostindicativeofaqualitywine. 2. RELATED
International Research Journal of Engineering and Technology (IRJET) e ISSN: 2395 0056 Volume: 08 Issue: 12 | Dec 2021 www.irjet.net p ISSN: 2395 0072 © 2021, IRJET | Impact Factor value: 7.529 | ISO 9001:2008 Certified Journal | Page1082 Analysis of Machine Learning Algorithm to predict Wine Quality Nitin Khilari1 , Pravin Hadawale 2 , Hasan Shaikh3, Sachine Kolase4 1BE Student, Jaihind College of Engineerin, Kuran, Junnar, Pune, nitinkhilari176@gmail.com 2BE Student, Jaihind College of Engineering, Kuran, Junnar, Pune, pravinhadawale95@gmail.com 3BE Student, Jaihind College of Engineering, Kuran, Junnar, Pune, hasanshaikh83532@gmail.com 4Assistant Professor, Jaihind College of Engineering, Kuran, Junnar, Pune, skolase@gmail.com *** Abstract Product quality certificationisusedbyindustries to sell or advertise their products. The quality of wine is assessed by a human specialist, which is a time consuming process that makes it quite expensive. Several machine learning techniques have already been applied to evaluate wine qualities such as quality and class on wine quality datasets. The quality of wine is determined not only by the amount of alcohol in it, but also by many traits, which change through time and therefore refine the wine's quality. It is critical to establish the wine's quality and categorise it into several categories based on a quality assessment. This study employs a variety of machine learning algorithms to predict wine quality. This research givesacomparisonoffundamental and technical analysis based on many characteristics. This research compares and contrasts several prediction algorithms used to predict wine quality. Technical analysis such as time series analysis and machine learning algorithms like Logistic Regression, Decision Tree, Random Forest, Support Vector Machine, Ada Boost Classifier, and Gradient BoostingClassifier are examples ofthese methodologies.With the use ofvisualisation,severaltechniquesareevaluatedbased on methodologies, datasets, and efficiency
Key Words: Machine Learning, Wine Quality, Logistic Regression, Decision Tree, Random Forest, Support Vector Machine, Precision, Recall, F1 Score, Accuracy 1.INTRODUCTION To improve product quality, testing is a key element that ensuresproductquality.Today,differenttypesofcompanies areembracingandimplementingnewtechnologytoverify andassessproductquality.Testingthequalityofaproduct withhumanexpertiseisanexpensiveandtime consuming operation that takes time to complete. For wine quality assurance,thisstudyinvestigatesvariousmachinelearning algorithms such as Logistic Regression, Decision Tree, Random Forest, Support Vector Machine, Ada Boost Classifier,andGradientBoostingClassifier.Thesestrategies automate the quality assurance process by minimising human interference and utilising accessible product attributes. The research also highlights the key characteristics that can be used to forecast the values of dependent variables One of the major factors that can be utilisedforcertificationiswinequalityassessment,andthis sortofqualitycertificationhelpstoensurewinequalityin themarket.Fixedacidity,volatileacidity,citricacid,residual sugarchlorides,freesulphurdioxide,totalsulphurdioxide, density,pH,sulphates,andalcoholaretheinputvariablesin theredwinedataset.Thequalityismeasuredonascaleof one to ten, with a greater value indicating higher wine Thequality.following is how the paper is structured: The second section describes similar work in this field. The proposed technique, the dataset used, and the machine learning algorithmarealldiscussedindetailinSection3.Section4 explainstheexperimentaldataandanalysis.Insection5,the conclusionisdrawn.Characteristicstopredictthevaluesof dependentvariables.
1.1 Objectives
colleaguespretechnicalresultsMemoryalcoholindicatingresidualForest.GradientresearcherPawarwhethermodelsShinsupportkeystudy.machinesupportprediction,toforalgoritAlthoughthemajorityofstudiesemployedmachinelearninghmstoassesswinequality,thereisstillalotofroomimprovement.Gupta,Yogesh[1]Thestudylooksathowuselinearregressiontofindsignificantfeaturesforaswellashowtouseneuralnetworksandvectormachinestoforecastvalues.TheuseoflearningtechniquesisexploredintwowaysinthisTobegin,considerhowlinearregressiondeterminesfeaturesforprediction.Second,neuralnetworksandvectormachinesareusedtoforecastvalues.Terenceisawriteranddirector.[2]builtmultipleclassificationusingKaggle'sredwinequalitydatasettopredictagivenredwineis"excellentquality"ornot.Devikaandhercolleagues.[3]Topredictwinequality,semployedLogisticRegression,StochasticDescent,SupportVectorClassifier,andRandomTheanalysisdemonstratesthatqualityimprovesassugarismoderateanddoesnotalterdramatically,thatthistraitisnotasimportantasotherssuchasandcitricacid.A.Sainiandcolleagues.[4]LongShortNeuralNetwork(LSTMNN)producedsuperiorthanotherstrategiesafterdoingfundamentalandexaminationofnumerousalgorithmsusedfordictingfuturestockmarketprices.YunhuiZengand.[5]Thisstudyexaminestheimpactofphysicaland
Thefirstgoalistotest to WORK
variousclassificationsystems

2. PROPOSED METHODOLOGY
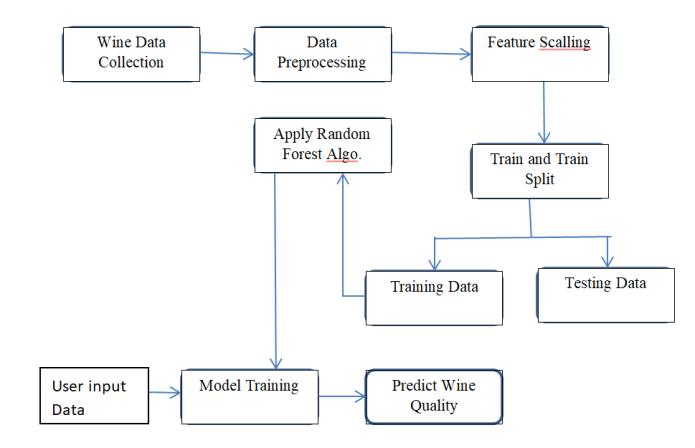
0 +b1x1+b2 x2+…bnxn (1) Becauseyinlogisticregressioncanonlybebetween0and 1, we can divide the above equation by (1 y) we will get equation(2). y/(1 y);0fory=0andinfinityfory=1 (2) However,werequirearangeof [infinity]to+[infinity],in whichcasethelogarithmoftheequationbecomes(3).(3) The above equation is the final equation for Logistic Regression. 3.2.2 Support Vector Machine isasupervisedmachine learning technique that can be used to solve problems in typesPositiveSupporthyperplanediagramalgorithmviapointshVectorshyperplanewedecisionnfortheclassesdecisionutiliseddimensionaltoclassificationandregression.Itis,however,mostlyemployedsolvecategorizationdifficulties.Inahighorinfinitespace,SVMcreatesahyperplanethatcanbeforclassification,regression,orothertasksTheSVMalgorithm'sgoalistofindtheoptimumlineorboundaryforcategorisingndimensionalspaceintosothatadditionaldatapointscanbereadilyplacedincorrectcategoryinthefuture.Ahyperplaneisthenametheoptimalchoiceboundary.Tosegregatetheclassesindimensionalspace,ahyperplanecanbeseverallinesorboundaries,howevertocategorisethedatapoints,mustpicktheoptimumdecisionboundary.TheofSVMreferstothebestboundary.Supportarethedatapointsorvectorsthatareclosesttotheyperplaneandaffectthehyperplane'sposition.TheextremeorvectorsthatassistcreatethehyperplanearechosenSVM.Supportvectorsaretheextremeinstances,andtheiscalledaSupportVectorMachineConsiderthebelow,whichshowshowadecisionboundaryorisusedtoclassifytwodifferentgroups.TheVectorMachineHyperplaneisshowninFigure2.hyperplaneandnegativehyperplanearethetwoofdatapointsthattheSupportVectordivides
International Research Journal of Engineering and Technology (IRJET) e ISSN: 2395 0056 Volume: 08 Issue: 12 | Dec 2021 www.irjet.net p ISSN: 2395 0072 © 2021, IRJET | Impact Factor value: 7.529 | ISO 9001:2008 Certified Journal | Page1083 chemical cancer,UsingkeyTheyemployedcolleaguesC6H12O2,betweenshowstudy'sofinvestigatesconstructsindicatorsofwinegrapesandwineonwinequality,awinequalityanalysisandassessmentmodel,andtheinfluenceofphysicalandchemicalindicatorswinegrapesandwineonwinequality.TheresultsofthismultiplelinearregressionanalysisofwinequalitythatthereisapositivecorrelationlinearassociationthescoresofwinequalityaromaandC2H6O,andothercompounds.Jambhulkarandhis.[6]Usingawirelesssensornetwork,researchersavarietyofstrategiestopredictcardiacdisease.gathereddatafromtheClevelanddatasetandextractedtraitstopredictheartdisease.Zaveriandcolleagues.[7]dataminingtechniques,severaldiseasessuchastuberculosis,diabetes,andotherswerepredicted
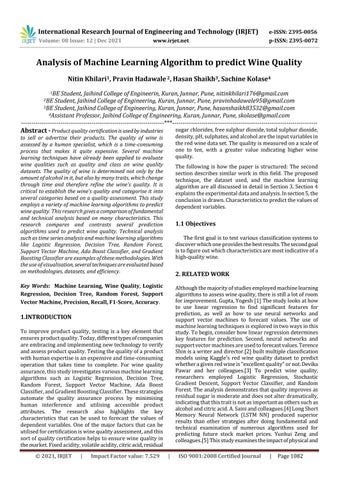
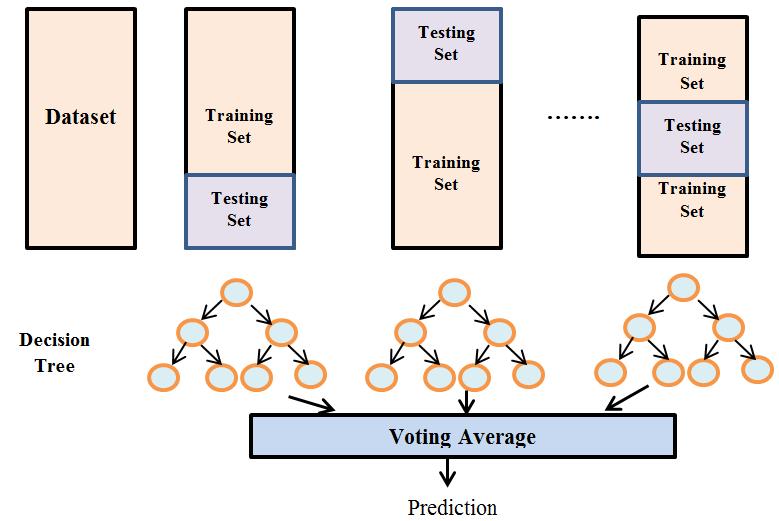
Machine learning techniques are employed to predict wine quality in this study. The processes in the suggested methodologyisdepictedinFigure1.Pre processingisdone on the first wine dataset. The data is further divided into training(80%)andtesting(20%)sets,withthetrainingset beingutilisedtotrainthemodelutilisingLogisticRegression, DecisionTree,RandomForest,andSupportVectorMachine algorithms.Thetestingsetisusedtodeterminetheaccuracy of several models, and then conclusions are generated to choose the optimal model for predicting wine quality. The trained model is used to determine the testing set's correctness.Theaccuracyofvariousalgorithmsisassessed andcomparedinordertodeterminetheoptimumalgorithm forpredictingwinequality Fig -1: Proposed System Architecture 2.1 DataSet Thedatasetforthisstudyisacollectionofredwines.For RedWine,therearea totalof1599samples.Fixedacidity, volatile acidity, citric acid, residual sugar, chlorides, free sulphurdioxide,totalsulphurdioxide,density,pH,sulphates, alcohol,and quality rating are all included in each sample. Thequalityclassesrunfrom0to10,with0beingtheworst and 10 being the best. Wine collections cannot be used without preprocessing due to several flaws in the dataset. The huge amplitude of variable values, such as sulphates (0.3 2) vs. sulphur dioxide (1 72), is one of the primary flaws,andtherearesomemissingnumbers Themeanisused to fill in the missing numbers. The inconsistency in the datasethasanimpactonpredictionsduetotheinfluenceof particular variables; this inconsistency is resolved using a lineartransformation,whichdividesalltheinputvaluesby the maximum variable value. The quality of the wine is translatedtoabinaryoutput.'1'denotesanexcellentquality wine with a score of 7 or above, while '0' denotes a poor qualitywinewithascoreoflessthan7
2.2 Machine Learning Technique 2.2.1 Logistic Regressionisasupervisedlearningtechnique that uses a machine learning algorithm. It's a method for predicting a categorical dependent variable from a set of equationdeliversormustvariableindependentvariables.Theoutputofacategoricaldependentispredictedbylogisticregression,andtheoutcomebeacategoricalvalue.Itcanbe0or1,YesorNo,TrueFalse,andsoon,butinsteadofgivingexactvalues,itprobabilisticvaluesthatfallbetween0and1.Theforthestraightlinecanbewrittenas(1).y=b
In the next stage, with the random forest classifier created,wewillmaketheprediction.
1.Randomlyselect“K”featuresfromtotal “m”features wherek<<m.
3. Consider the high voted predicted targetas the final predictionfromtherandomforestalgorithm.
2.Amongthe“K”features,calculatethenode“d”usingthe bestsplitpoint.
4. EXPERIMENTAL RESULT AND ANALYSIS
Therearetotal 12 variablesinredwinecollectionsas discussedinabovesection.Thevariablequalityrating is considered as dependent variable and other 11 variables are assumed as predictors or independent
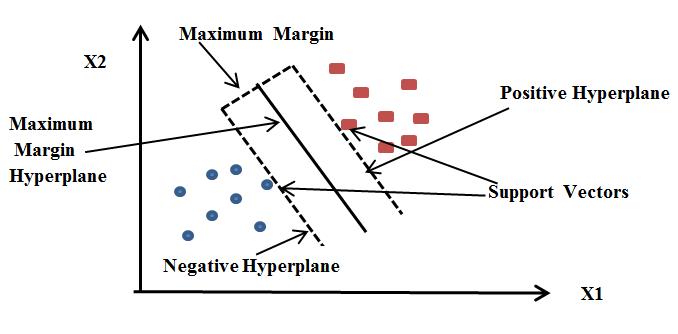
3.2.3 Decision Tree isasupervisedlearningtechnique that can be used to solve problems in classification and regression. It is, however, mostly employed to solve categorization difficulties. It's a tree structured classifier, with leaf nodes representing outcomes, interior nodes representingdatasetattributes,andbranchesrepresenting decision rules. Decision trees need less effort for data preparationduringpre processingthanothermethods.Data normalisation and scaling are not required when using a decision tree. In addition, missing values in the data have littleimpactonthedecisiontree buildingprocess.Aslight change in the data, on the other hand, can result in a significant change in the structure of the optimal decision tree.Calculationscanbecomequitecomplicated,especially when multiple values are uncertain and/or multiple outcomes are related. The biggest problem with implementingadecisiontreeisfiguringouthowtomakeit work(4).InformationGain=Entropy(S) [(WeightedAvg)*Entropy(eachfeature) (4) Entropyisametricfordeterminingthedegreeofimpurity inaparticularproperty.Itdenotestherandomnessofdata. TheGiniIndexequationisasfollows(5). GiniIndex=1 ∑jPj2 (5) TheGiniindexisameasureofimpurityorpurityusedin theClassificationandRegressionTree(CART)techniqueto createadecisiontree.
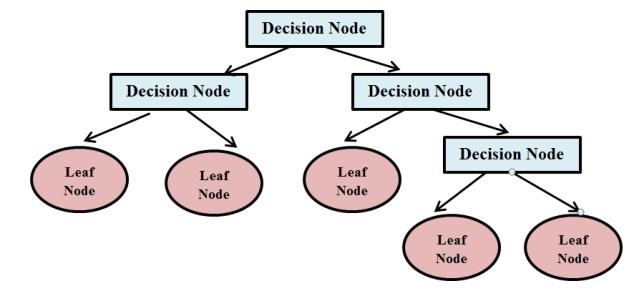
Fig-4: Random Forest Algorithm Classifier
Figure 3 depicts a decision tree, with internal nodes representing datasetattributesand branches representing decisionrules.
3.Splitthenodeintodaughternodesusingthebestsplit.
5.Buildforestbyrepeatingstepsatodfor“n”number timestocreate“n”numberoftrees.
Fig -2: Support Vector Machine Classifier
International Research Journal of Engineering and Technology (IRJET) e ISSN: 2395 0056 Volume: 08 Issue: 12 | Dec 2021 www.irjet.net p ISSN: 2395 0072 © 2021, IRJET | Impact Factor value: 7.529 | ISO 9001:2008 Certified Journal | Page1084
4.Repeattheatocstepsuntil“l”numberofnodeshas beenreached.
2.Calculatethevotesforeachpredictedtarget.
1. Takes the test features and use the rules of each randomlycreateddecisiontreetopredicttheoutcomeand storesthepredictedoutcome.
Fig 3: Decision Tree Classifier 3.2.4 Random forest is a supervised learning methodthatcanbeusedtosolveproblemsinclassification and regression. It creates a "forest" out of an ensemble of decision trees, which are commonly trained using the "bagging" method. The bagging method combines several learning models to improve the final outcome. Random Forestisalearningmethodthatemploystheconstructionof inpredictiontohigherpredictions.predictsrintreesthemakesmanydecisiontreestoachieveitsresults.Therandomforestthefinalselection,whichisbasedonthemajorityoftrees.RandomForestproducesnnumberofdecisionbyrandomlyselectingrecordsfromadataset,asshownFigure4.Insteadthanrelyingonasingledecisiontree,theandomforestcollectstheforecastsfromeachtreeandthefinaloutputbasedonthemajorityvotesofThegreaterthenumberoftreesintheforest,thetheaccuracyandthelesschanceofoverfitting.TheRandomForestalgorithmhastwostages:thefirstisgeneratetherandomforest,andthesecondistoproduceausingtherandomforestclassifierthatwascreatedthefirststep.
Thefollowingtableshowstheperformancematrixand accuracy for Logistic Regression, Decision Tree, Random Forest,andSupportVectorMachine. Wewereabletogeta90%accuracyrateusingLogistic PerformanceRegression.Table1showstheLogisticRegressionAlgorithmMatrix.
Table1: Performance Matrix for Logistic Regression Algorithm precision recall f1 score support 0 0.92 0.96 0.94 355 1 0.55 0.38 0.45 45 accuracy 0.90 400 macro avg 0.74 0.67 0.69 400 weightedavg 0.88 0.90 0.89 400
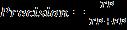
Precision: Itcanbedefinedasthenumberofcorrect outputssuppliedbythemodelorthepercentageofall positive classes that the model correctly predicted being true. The formula for precision is given below (13).
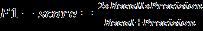
The F score allows us to assess both recall and precision simultaneously. If the recall equals the precision,theF scoreismaximum.TheformulaforF1 scoreisgivenbelow(15).
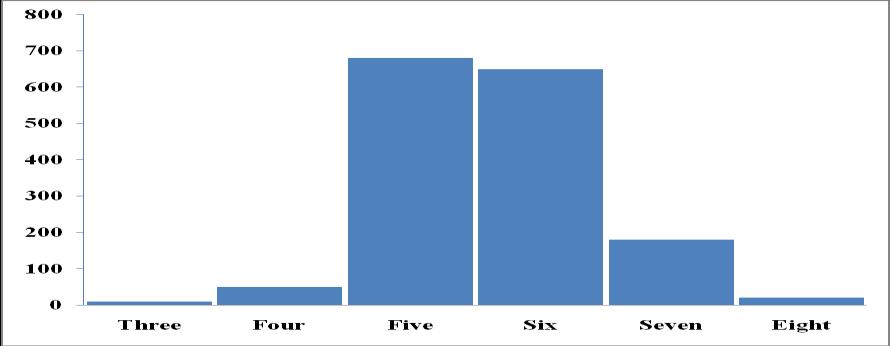
(7) True Negative (TN) means that the model predicted No,andtherealoractualvaluelikewisepredictedNo. TruePositive(TP)indicatesthatthemodelcorrectly predictedyesandthattheactualvaluewascorrectas well.FalseNegative(FN)isaType IIerrorinwhichthe modelpredictednobuttheactualvaluewasYes.False Positive(FP)occurswhenthemodelpredictsYesbut the actual result is No. A Type I mistake is another nameforit.Chart 1depictsthedistributionofquality attributesandtheircounts.
Chart 1: Distribution of the quality variable 4.1 Performance Matrix and Accuracy
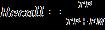
International Research Journal of Engineering and Technology (IRJET) e ISSN: 2395 0056 Volume: 08 Issue: 12 | Dec 2021 www.irjet.net p ISSN: 2395 0072 © 2021, IRJET | Impact Factor value: 7.529 | ISO 9001:2008 Certified Journal | Page1085 variables in this work. The distribution of thequalityvariableisshowninfigure5.Theaccuracy of different machine learning algorithm is shown in below tables. The performance of the classification modelsfor a givenset oftestdata is drawnbyusing confusionmatrix.Itcanonlybedeterminedifthetrue valuesfortestdataareknown.In,informationretrieval andclassificationinmachinelearning,precisionisalso calledpositivepredictivevaluewhichisthefractionof relevant instances among the retrieved instances, while recall isalso knownas sensitivitywhich is the fractionofrelevantinstancesthatwereretrieved.Both precisionandrecallarethereforebasedonrelevance. In statistical hypothesis testing, a type I error is the rejectionofatruenullhypothesisisalsoknownasa "false positive" finding or conclusion for example an innocentpersonis convicted, while a type II erroris the non rejection of a false null hypothesis is also knownasa"falsenegative"findingorconclusionfor exampleaguiltypersonisnotconvicted.Thedifferent termusedaredescribedbelow: Classification Accuracy: It defines how often the model predicts the correct output. It is one of the important classificationpredictionspredictionsbeclassificationparameterstodeterminetheaccuracyoftheproblems.Theclassificationaccuracycancalculatedastheratioofthenumberofcorrectmadebytheclassifiertoallnumberofmadebytheclassifiers.Theformulaforaccuracyisgivenbelow(12).(4)
The Decision Tree Classifier had a 90% accuracy rate. Table2showsthePerformanceMatrixfortheDecisionTree ClassifierAlgorithm. Table2: Performance Matrix for Decision Tree Classifier Algorithm precision recall f1 score support 0 0.96 0.92 0.94 355
(5) Recall: It is defined as the percentage of positive classes that our model accurately predicted. The number of people who must be recalled must be as greataspossible.Theformulaforrecallisgivenbelow (14). (6) F1 score: When two models have low precision but greatrecall,orviceversa,it'sdifficulttocomparethem.
International Research Journal of Engineering and Technology (IRJET) e ISSN: 2395 0056 Volume: 08 Issue: 12 | Dec 2021 www.irjet.net p ISSN: 2395 0072 © 2021, IRJET | Impact Factor value: 7.529 | ISO 9001:2008 Certified Journal | Page1086 1 0.53 0.73 0.62 45 accuracy 0.90 400 macro avg 0.75 0.83 0.78 400 weightedavg 0.92 0.90 0.90 400 TheRandomForestClassifierhada92percentaccuracy rate.Table3showstheRandomForestClassifierAlgorithm PerformanceMatrix. Table3; Performance Matrix for Random Forest Classifier Algorithm precision recall f1 score support 0 0.95 0.97 0.96 355 1 0.68 0.58 0.63 45 accuracy 0.92 400 macro avg 0.82 0.77 0.79 400 weightedavg 0.92 0.92 0.92 400 The accuracy of the Support Vector Machine was 90%. Table 4 shows the Support Vector Machine Algorithm PerformanceMatrix. Table4; Performance Matrix for Support Vector Machine Algorithm precision recall f1 score support 0 0.92 0.97 0.94 355 1 0.58 0.31 0.41 45 accuracy 0.90 400 macro avg 0.75 0.64 0.67 400 weightedavg 0.88 0.90 0.88 400 4.2 Comparison of Accuracy by different Algorithm Physiochemical variables such as fixed acidity, volatile acidity, citric acid, residual sugar, chlorides, free sulphur dioxide, total sulphur dioxide, density, pH, sulphates, and alcoholvariablesareusedtotrainvariousmachinelearning algorithms such as Logistic Regression, Decision Tree, Random Forest, Support Vector Machine, Ada Boost Classifier,andGradientBoostingClassifier.Inthisstudy,the variable quality rating is treated as a dependent variable, whereastheother11variablesaretreatedaspredictorsor AlgorithmClassifierthealgorithmsusingdeterminfirst,independentvariables.Thisstudyusestwotypesofanalysis:thevalueofeachalgorithminpredictingwinequalityised,andsecond,thefeaturesectioniscompletedthebestpredictors.Theaccuracyprovidedbyvariousisdisplayedinthetablebelow.TheaccuracyofLogisticRegressionis90%,thatoftheDecisionTreeis90%,andsoon.TheRandomForestClassifierhasthebestaccuracy(92%)ofallthealgorithms Table7. Comparison of Accuracy obtained by different Algorithm Sr. No. Algorithm Accuracy 1 LogisticRegressionAlgorithm 90% 2 DecisionTree AlgorithClassifierm 90% 3 RandomForest AlgorithmClassifier 92% 4 SupportVector AlgorithmMachine 90% TheRandomForestalgorithmgeneratesalargenumber of decision trees, each of which is trained with a distinct dataset.Dataissenttoeachdecisiontreetoanticipatesome output in order to forecast wine quality. To anticipate the eventual outcome, the majority of votes are calculated. Finally, the Random Forest Classifier Algorithm can be described as a superior machine learning technique for thanexactthepredictingwinequalitybasedonoutcomes.Atthesametime,RandomForestClassifierAlgorithmcanprovidemorepredictionsbyemployingselectedpredictorsratherallpredictors. 3. CONCLUSIONS Inrecentyears,therehasbeenanincreaseininterestinthe wine sector, necessitating its expansion. As a result, companiesareinvestingininnovativetechnologiestoboost wine production and sales. Wine quality certification is crucial for a product's marketability, and it necessitates human wine testing. This research looks into several machine learning techniques for predicting wine quality. Thisstudyshowshowtheresultsalterwhenthetestmodeis changed for each categorization model. The analysis of classifiersonredwinedatasetsispartoftheresearch.The percentageofcorrectlyidentifiedcases,precision,recall,and F measure are all used to explain the results. Different classifiers are tested on datasets, including Logistic Regression,DecisionTree,RandomForest,SupportVector Machine, Ada Boost Classifier, and Gradient Boosting Classifier Theresultsofthestudiesleadustobelievethat theRandomForestsAlgorithmoutperformsotherclassifiers in classification tasks. The Random Forest Algorithm predicts wine quality with a maximum accuracy of 92 percent. We can see that good quality wines have higher alcohollevelsonaverage,highersulphatelevelsonaverage, lowervolatileacidityonaverage,andhigherresidualsugar levels on average. The study reveals that instead of evaluatingallaspects,justessentialfeaturescanbeusedto predict the value of the dependent variable with more accuracy. In the future, a huge dataset may be used for research,andvariousmachinelearningalgorithmsforwine qualitypredictioncanbeinvestigated
International Research Journal of Engineering and Technology (IRJET) e ISSN: 2395 0056 Volume: 08 Issue: 12 | Dec 2021 www.irjet.net p ISSN: 2395 0072 © 2021, IRJET | Impact Factor value: 7.529 | ISO 9001:2008 Certified Journal | Page1087 REFERENCES
[1] Gupta, Y. (2018), Selection of important features and predictingwinequalityusingmachinelearningtechniques, Procedia Computer Science, 125, 305 312, [2]doi:10.1016/j.procs.2017.12.041.Shin,T.(2020,May8),Predicting Wine Quality with Several Classification Techniques Medium, https://towardsdatascience.com/predicting wine quality with several classification techniques 179038ea6434. [3] Devika Pawar, Aakanksha Mahajan, Sachin Bhoithe (2019), Wine Quality Prediction using Machine Learning Algorithms,InternationalJournalofComputerApplications Technology and Research, Volume 8 Issue 09, 385 388, ISSN: 2319 8656. [4] Saini, A., & Sharma, A. (2019), Predicting the Unpredictable: An Application of Machine Learning AlgorithmsinIndianStockMarket,AnnalsofDataScience, doi:10.1007/s40745 019 00230 7.
[5]Zeng,Y.,Liu,Y.,Wu,L.,Dong,H.,Zhang,Y.,Guo,H.,Guo,Z., Wang, S.,Lan, Y. (2018). Evaluation and Analysis Model of Wine Quality Based on Mathematical Model. Studies in Engineering and Technology, 6(1), 6, [6]doi:10.11114/set.v6i1.3626.JambhulkarandBaporikar.(2015),ReviewonPrediction ofHeartDiseaseUsingDataMiningTechniquewithWireless SensorNetwork,InternationalJournalofComputerScience andApplications8(1)55 59.
[8]Er,Y.(2016),TheClassificationofWhiteWineandRed Wine According to Their Physicochemical Qualities, InternationalJournalofIntelligentSystemsandApplications in Engineering, 4(Special Issue 1), 23 26, doi:10.18201/ijisae.265954.
[7] Zaveri, and Joshi. (2017), Comparative Study of Data Analysis Techniques in the domain of medicative care for Disease Predication,International Journal of Advanced ResearchinComputerScience8(3)564 566.