1,2,3Department of Computer Applications, SDJ International College, Surat, Gujarat, India *** Abstract – Heart Diseases are one of the major problems prevalent today due to health and lifestyle choices. Our main objective in the project is to predict the chances of Heart Disease and the major factors contributing to it. The data set we found helps us to evaluate deeper relationships between potential factors and perhaps reshape health care products.
International Research Journal of Engineering and Technology (IRJET) e ISSN: 2395 0056 Volume: 08 Issue: 12 | Dec 2021 www.irjet.net p ISSN: 2395 0072 © 2021, IRJET | Impact Factor value: 7.529 | ISO 9001:2008 Certified Journal | Page1055 Heart Disease – Identification of Predictors and Prevention Darshil Shankar1, Neel Viradiya2 , Prof. Chirag Prajapati3
The motivation of this work comes from the fact that althoughthedeathratesfromHeartDiseasesaredeclining: HeartDiseaseisstillthemajorcauseofdeathintheUSA.An estimated 92.1 million US adults have at least one kind of Heart Disease and by 2030, around 44% of the US adult populationisexpectedtohavesomeformofHeartDisease Heart Disease comes under many categories such as coronaryarterydisease,heartrhythmproblems,chestpain (angina),orstroke.InusingdatafromtheGlobalBurdenof DiseaseStudy,approximately90%ofthestrokeriskcould be attributed to modifiable risk factors. In our study, we triedidentifyingthoseriskfactorsthatcontributethemost to Heart Diseases, "The estimated direct costs of Heart Diseasesandstrokeincreasedfrom$103.5billionin1996to 1997to$213.8billionfrom2014to2015. 
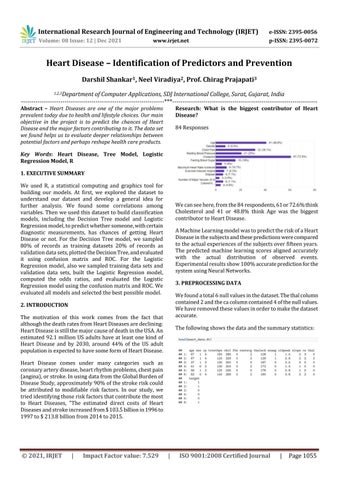
Research: What is the biggest contributor of Heart Disease? 84 WeResponsescanseehere,fromthe84respondents,61or72.6%think Cholesterol and 41 or 48.8% think Age was the biggest contributortoHeartDisease.
2. INTRODUCTION
We used R, a statistical computing and graphics tool for building our models. At first, we explored the dataset to understand our dataset and develop a general idea for further analysis. We found some correlations among variables.Thenweusedthisdatasettobuildclassification models, including the Decision Tree model and Logistic Regressionmodel,topredictwhethersomeone,withcertain diagnostic measurements, has chances of getting Heart Disease or not. For the Decision Tree model, we sampled 80% of records as training datasets 20% of records as validationdatasets,plottedtheDecisionTree,andevaluated it using confusion matrix and ROC. For the Logistic Regression model,alsowesampledtrainingdata setsand validation data sets, built the Logistic Regression model, computed the odds ratios, and evaluated the Logistic RegressionmodelusingtheconfusionmatrixandROC.We evaluatedallmodelsandselectedthebestpossiblemodel.
AMachineLearningmodelwastopredicttheriskofaHeart Diseaseinthesubjectsandthesepredictionswerecompared totheactualexperiencesofthesubjectsoverfifteenyears. The predicted machine learning scores aligned accurately with the actual distribution of observed events. Experimentalresultsshow100%accuratepredictionforthe systemusingNeuralNetworks.
Key Words: Heart Disease, Tree Model, Logistic Regression Model, R 1. EXECUTIVE SUMMARY
3. PREPROCESSING DATA Wefoundatotal6nullvaluesinthedataset.Thethalcolumn contained2andthecacolumncontained4ofthenullvalues. Wehaveremovedthesevaluesinordertomakethedataset Theaccurate.followingshowsthedataandthesummarystatistics:


International Research Journal of Engineering and Technology (IRJET) e ISSN: 2395 0056 Volume: 08 Issue: 12 | Dec 2021 www.irjet.net p ISSN: 2395 0072 © 2021, IRJET | Impact Factor value: 7.529 | ISO 9001:2008 Certified Journal | Page1056 4. EXPLORATORY DATA ANALYSIS (EDA) 4.1 Graphical Analysis 1. Histogram for Age: 2. Histogram for Cholesterol:
4.2 Correlation heatmap between variables: We used a correlation heatmap to plot out the strongest positiveandnegativecorrelations.Asindicated,"slope"and "oldpeak" have the strongest correlation, with a positive 0.58."thalach"and*age”havethelowestcorrelation,witha negative0.4. Whichvariablesarehighlycorrelated?
4.3 Analyzing relationships between cholesterol and age: Aswecanseeinthescatterplot,ageandcholesteroldonot appeartohaveasignificantcorrelationwithHeartDisease. In the top right corner, we can see an elderly female with highcholesterol,butwhodoesnothaveHeartDisease.On theotherhand,onthebottomleft,wecanseeayoungmale withlowcholesterol,whohaswhohasHeartDisease.Hence, wecannotderiveanyrelationshipbetweenthesevariables andHeartDisease.
5.2 Logistic Regression: It extends the idea of Linear Regression to the situation where the outcome variable is categorical. It is the appropriate regression analysis to conduct when the dependent variable is dichotomous (binary). Sex, cp, trestbps,ca,thalach,exang,slopearesignificantvariables
5. DATA MODELLING 5.1 Splitting the data: First,wedividedthedatasetintotwoparts:trainingdataset andvalidationdataset.Weallocated80%ofthedatasetfor thetrainingdatasetandtheremaining20%ofthedatasetfor thevalidationdataset.


International Research Journal of Engineering and Technology (IRJET) e ISSN: 2395 0056 Volume: 08 Issue: 12 | Dec 2021 www.irjet.net p ISSN: 2395 0072 © 2021, IRJET | Impact Factor value: 7.529 | ISO 9001:2008 Certified Journal | Page1057
Considering thalach (maximum heart rate achieved) as example,ifitgoesupbyoneunit,theoddsofhavingHeart Diseasegoesdownby2.8% 5.3 Decision Tree: Decision Tree is the most Powerful and popular tool for classification and prediction. Decision Tree is a flowchart liketreestructure,whereeachinternalnodedenotesatest onanattribute,eachbranchrepresentsanoutcomeofthe test,andeachleafnodeholdsaclasslabel.
From the output, we can conclude that ca is the most significantvariableamongalltheothervariables. The way we interpret these coefficients is as follows.
6. PERFORMANCE EVALUATION
FromtheDecisionTree,wegetthefollowingRulewiththe mostpercentagecoverofcases.Whenthal<1&ca<1THEN CLASS=Oandthisrulecovers42%ofcases.
7. ROC CURVE 7.1 ROC for Logistic Regression
Theperformanceofaregressionmodelcanbeunderstood by knowing the error rate of the predictions made by the model.Youcanalsomeasuretheperformancebyknowing howwell yourregression linefitthedataset andknowing theaccuracyofsuchmodels.
ConfusionMatrix: Confusionmatrixisameasurementthatusedtorepresent theperformanceofaclassificationmodelbyrecordingthe sourcesoferrors:falsepositivesandfalsenegatives Weuse confusionmatrixtodepicttheaccuracyofthetrainingdata.


BIOGRAPHIES
REFERENCES [1]MoonesingheR,YangQ,ZhangZ,KhouryMJ.Prevalence and cardiovascular health impact of family history of prematureHeartDiseaseintheUnitedStates:Analysisofthe National Health and Nutrition Examination Survey, 2007 [20142]Benjamin,E.J.,Muntner,P.,Alonso,A.,Bittencourt,M.S., Callaway,C.W.,Carson,A.P.,Virani,S.(2019).Heartdisease and stroke statistics 2019 update: A report from the AmericanHeartAssociation [3] Fang J, Luncheon C, Ayala C. Odom E, Loustalot F. Awarenessofheartattacksymptomsandresponseamong adults UnitedStates,2008,2014,and2017.MMWR.2019; 68(5):101 6.
[4]Alcanbetterpredictriskofheartattack,cardiacdeath, study published in Journal of Cardiovascular prediction[5]dstics/ahttps://health.economictimes.indiatimes.com/news/diagnoResearch,icanbetterpredictriskofheartattackcardiaceathstudy/72899878SinghP,SinghS,PandiJainGS."Effectiveheartdiseasesystemusingdataminingtech niques”.in International Journal of Nanomedicine, 13(T NANO 2014 Abstracts):121 124,2018 Darshil Shankar Achieved First Class with Distinction in BCA (Bachelors of ComputerApplications)
International Research Journal of Engineering and Technology (IRJET) e ISSN: 2395 0056 Volume: 08 Issue: 12 | Dec 2021 www.irjet.net p ISSN: 2395 0072 © 2021, IRJET | Impact Factor value: 7.529 | ISO 9001:2008 Certified Journal | Page1058 7.2 ROC for Decision Tree 8. FLOW DIAGRAM 9. CONCLUSION WehavebuiltandcomparedtheLogisticRegressionmodel andtheDecisionTreemodelandhavecapturedtheresults andtheperformancemetricsforthesame.WiththeLogistic Regressionmodel,weachievedanaccuracyof83.33%and fortheDecision Tree weachievedanaccuracyof86.67%. Therefore,theDecisionTreeModelisbetterforourproject analysis.Theyalsoareeasytoimplementandinterpret,and theydisplayhigheraccuracythanLogisticRegressionModel here.TheDecisionTreeModel webuilthelpedus identify thal,ca,thalachandcpasthemostimportantpredictorsof HeartDisease.Thisprovesthatageandcholarenotmajor contributorstoHeartDisease.Similarmodelscanbebuiltto study other prone populations and help in serving the society better with analytics and various classification techniques.


International Research Journal of Engineering and Technology (IRJET) e ISSN: 2395 0056 Volume: 08 Issue: 12 | Dec 2021 www.irjet.net p ISSN: 2395 0072 © 2021, IRJET | Impact Factor value: 7.529 | ISO 9001:2008 Certified Journal | Page1059 Neel Viradiya Achieved First Class with Distinction in BCA (Bachelors of ComputerApplications) Prof. Chirag Prajapati ProfessoratBCAdepartment


