2Professor and Head, Civil Engineering Department, Dr. Sau Kamaltai Gawai Institute of Engineering & Technology Darapur, (SGBAU) Amravati
reducing
3Assistant Professor, Civil Engineering Department, Dr. Rajendra Gode Institute of Technology and Research, (SGBAU) Amravati ***
evolving.
International Research Journal of Engineering and Technology (IRJET) e ISSN: 2395 0056 Volume: 08 Issue: 12 | Dec 2021 www.irjet.net p ISSN: 2395 0072 © 2021, IRJET | Impact Factor value: 7.529 | ISO 9001:2008 Certified Journal | Page577 Feasibility
1M.E. Student, Transportation Engineering and Management, Dr. Rajendra Gode Institute of Technology and Research, (SGBAU) Amravati
Abstract - The Intelligent Transportation System is one of the burgeoning inventions that uses new technology to solvea variety of issues. Its compatibility with real world issues in developing nations like India, such as traffic congestion, infrastructure demand, high traffic loads, and non lane traffic systems. It is critical to assess a technology's potentialinorder to determine its viability. The goal of this article is to determine the utility cost ratio of implementation so that it may be evaluated without changingthe existinginfrastructure design. The end result is a utility cost analysis approach that takes social, economic, and environmentalissues intoaccount. As a result, the analysis is quickly examined so that the technology may be applied according to its appropriateness. Words: Investments, Congestion, Intelligent TransportationSystem(ITS),Benefits. (ITS)isaconceptfor or at least limiting traffic congestion that is still Population growth and quick development have resultedinan increase in the numberof carsonthe road.
Key
Study of an Intelligent Transportation System for Urban Area S. A. Gawande1, Dr. B. S. Shete2, A. R. Bijwe3
1. INTRODUCTION TheIntelligentTransportationSystem
parametersadvantagesimplementationoverallenManytransportationvarietychallengesreducingAccordingrateshasexaminedCongestiononareasoutnumberAnd,inmanylocations,thegrowingnumberofcarsbegantotheroad'scapacity.Congestionhappensinsomewhenthedemandlimitissurpassed.Severalstudiestraffichavebeenreleased.andaccidentshavebeenresearchedandbyanumberofacademicsandorganizations.Itbeendeterminedthatresourceconsumptionatpresentisunsustainableandmayresultinextinction.tomostresearch,ITSplayasignificantroleintraveltimeandfrequency.Becausecurrentcannotbeaddressedbyasinglesolution,aofapproacheswillberequiredtoaddressrelatedenergyandenvironmentalissues.constraintsexist,includingdevelopinganddeployingvironmentallyfriendlycarsandfuels,aswellasreducingtravelincrease.So,byevaluatingthelowestcostforsuchparametersrelativetotheconsumersmayreceive,wecanimplementsuchaccordingtocircumstances,resultingin maximum benefits. As a result, the parameters must be ITSuserlucrative,andtheadvantageswemaygetfromthemmustbefriendlyinorderforsocietytoembracetheusageofparametersinroadinfrastructure. 1.1 Criteria of Smart Cities allaccessibility,environment,measuringcities.informationeducation,factors,dataperformanceNijkamp(EU)cityVariousresearchontheassessmentandmonitoringofsmartdevelopmenthavebeenperformed.TheEuropeanUnionUrbanAuditDatasetwasusedbyCaragliu,DelBo,and(2011)toexaminevariablesthatinfluencetheofsmartcities.TheEUUrbanAuditprovidesonover250variablesintheareasofpopulation,socialeconomicfactors,citizenengagement,trainingandenvironment,travelandtransportation,society,cultureandentertainmentforEuropeanThedataset,however,doesnotincludeanindexforintelligenceincities.FocusingontheurbanKaragsetal.(2011)foundthateducation,andtheuseofICTsinpublicadministrationaresignificantlylinkedtourbanintelligence. i. Smart Economy Innovation, entrepreneurship, financial image and brand, labor market flexibility, interaction with foreign markets, and the ability to adapt are all part of the smart economy Friedman.(Economistquality,theIntelligencemaintainingCompetition,levelsof(Gifingeretal.,2008;MonferdzadehandBerardi,2015).Onethemajormotivationsforsmartcitiesistownswithhighofeconomiccompetitiveness(Giffingeretal.,2013).ontheotherhand,isanabsoluteconcept,andcurrentandfuturecompetitiveness(EconomistUnit(EIU))iscriticalforeconomicdevelopment,businessandregulatoryenvironment,organizationalhumancapital,culturalaspects,andgovernanceIntelligenceUnit(EIU)).AsFriedmanputit ii. Smart Environment characteristicsandTheattractivenessofnaturalconditions,pollutionreduction,resourcemanagementsustainabilityareallofasmartenvironment(Monfarazade&

and Innovative Technology passengerandcollection,nowtolloverallrevenuesignificantIintelligentandwellITSapplications,technologyandtransportationofAdministration,isinchargeofconductingresearchonbehalftheagencyandoverseeingallmainavenuesforadvancingtechnology.Transportationsafety,mobility,environmentalsustainabilitymayallbeenhancedwithadvancements.InformationtechnologyoftenknownasITS,arealsoutilized.Becauseapplicationsmainlyinvolveinfrastructureandcars,asasintegratedapplicationsinvolvingbothinfrastructurevehicles,governmentfinancingforthecreationofantransportationsystemisbecomingmorelimited.nvestmentsaremadeinordertotakeadvantageofinitiativesthathavethepotentialtoproduceorpossibilities.Increasedsafety,mobility,andproductivitygeneratesubstantialmoney.ElectroniccollectionisanotherprominentITStechnologythatisinusethroughoutthenation.Servicesincludetollredlightcameras,trafficsignalsynchronization,publictransportation.Othertechnologiesincludeinformationsystems,signalpriority,andothers.
3. Methodology
Withcaranddriverspecifications,itispossibletoforecasta trafficcrash.Thespeed,location,anddirectionoftravelare alltakenintoaccount.aswellascarparameters,whichare influenced by the driver's actions in certain situations. Perturbation is a significant factor in determining the driver'saction,suchasirregularacceleration,deceleration, andyaw Weimingrotation.Huetal. (2004) proposed a technique for predicting traffic accidents that is based on vehicle monitoring. A fixed camera is used to capture pictures of traveling trajectories, which are then used in conjunction with3dimensionalmodeldependentvehiclemonitoring to create the final images in this framework. The activity patternsofthecarsarenextinvestigatedwiththeuseofa fuzzy self organizing neural network system. Traffic accidentsarepredictedusingthismethod,whichmakesuse of a risk model. Several tracking algorithms were used to monitor the vehicle's movements, including region based tracking, active contour based tracking, feature based trackingandmodel basedtracking.Anaccidentprobability modelwasusedtodeterminethechanceofanaccidentina road traffic situation. Despite the fact that this concept is ideallysuitedtoanurbanenvironment,itwouldneedtobe reconstructedtobeusedonahighway.
Thepurposeofstudyistoprovidethesmartsolutionofour conventional traffic flow. Our main focus on effect of intelligent transportation systems. In this Chapter, the imcrashesutilization,impactofintelligenttransportationframeworkdecreasefuelemissionofexhaustpollutantsandroadvehicleunderheterogeneousactivitycondition,andtheirpactontherelateddestinationareexamine. Overview and Benefits of ITS The ITS Joint Program Office (JPO), which is part of the USDOT's Research
2. LITERATURE REVIEW
International Research Journal of Engineering and Technology (IRJET) e ISSN: 2395 0056 Volume: 08 Issue: 12 | Dec 2021 www.irjet.net p ISSN: 2395 0072 © 2021, IRJET | Impact Factor value: 7.529 | ISO 9001:2008 Certified Journal | Page578 definitions.andsustainability,environmentresourcepollutionBerardi,2015).Theattractivenessofnaturalcircumstances,levels,environmentalprotection,andsustainablemanagementareallfactorsthatinfluencethesmart(Gifingeretal.,2013).Importantelementsofsuchasresponsibleresourcemanagementenergyefficiency,areoftenhighlightedinsmartcity 1.2 Basic Objective of Research Work 1. To investigate the benefit to cost ratio of ITS characteristicsintheIndiancontextandeffectofintelligent transportationsystems(ITS)onfueluse. 2.Toinvestigate the effect ofIT’Sonthesocial,economic, andenvironmentaladvantagesthatitprovides. opinion4.on3.ToconductacomparativeexaminationofITSdeploymentroadswithothermodesoftransportation.ToestimatethecostofinfrastructureaswellaspubliconthesuggestedIntelligentTransportationSystem. 1.3 Scope of Project In broad Sense Trafficismadeupofavarietyofvariouskindsofvehicles, includingautomobiles,buses,lorries,two wheelers,three wheelers,andothersimilarvehicles.Thesetwo andthree wheelers are of tiny stature; as a result of their existence, lanedisciplineiscompromised.Theflowoftraffichasbeen disrupted. Induction loops may not be helpful for data collection in certain situations, conditions. Currently, researchers are using either manual data collecting approachesorvideofilming basedtechnologiestoacquire information. We personally gathered vehicle traffic count (PCU)data froma variety ofsources. Amravati isa city in India. These techniques are helpful in gathering certain macro scale information, such as categorized traffic statistics, for analysis flow and is not helpful in gathering microscopicdata,thereforeweneedtodofurtherresearch. DeploymentofITSandrecommendationsforimplementing so that we may solve these difficulties More advantages shouldbeconsidered.
2.1 Prediction of Road Accidents Using Vehicle and Driver Parameters
3.1
This part of the paper reviews the findings from the academicliterature.Literaturereviewfindingsaredivided intodifferentpartsbasedontheirtype.
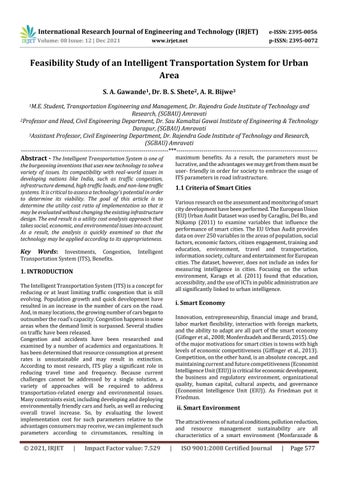
International Research Journal of Engineering and Technology (IRJET) e ISSN: 2395 0056 Volume: 08 Issue: 12 | Dec 2021 www.irjet.net p ISSN: 2395 0072 © 2021, IRJET | Impact Factor value: 7.529 | ISO 9001:2008 Certified Journal | Page579 3.2 Data Collection The data of Signalized intersection is collected in term of PCU and considered for calculating average delay so that totalfuelconsumptionperdayiscalculatedandthentotal fuel consumption monthly, yearly and decade for ITS implementationiscalculated. 3.3 Data Analysis The collected data is analyzed, the fuel saving from difference of without ITS and with ITS implementation is calculated and from that saving cost is calculated by multiplyingfuelsavingwithfuelcostandthencomparative graph for fuel consumption with ITS implementation and withoutITSisdrawn.Andlikewisecomparativegraphfor graphwithoutaverageEmissionrateofgasesCOandNOXisdrawnandforaccidentcostperaccidentwithsignalsynchronizationandsynchronizationiscalculatedandcomparativeisplot. 3.4 Study Area Thestudyareaconsistedofthefiveintersections.Thetraffic taken.Kathorasquare,square6dataiscollectedintermofPCU.ThestudyareaconductedofkmstretchofAmravaticityfromRajapethtoKathoraofalltotal5intersections.Whichincludes;RajkamalIrvinsquare,Panchavatisquare,ShegaonNaka,Naka.AndforfurthercalculationsaveragePCUis 4. DATA COLLECTION 4.1.1 Primary Data (Collected Traffic Data) Primary data is about the study of Amravati roads and identificationoftrafficflow.Thesiteisselected,thestretch fromRajapethtoKathoraNakaandthedataiscollectedi.e. trafficvolumecount(PCU).Ininputdatatheinitialcostand economicreductionratebenefitsoperatingandmaintenancecostiscalculated.AndforOutputthefuelconsumption,emissionrateandaccidentaliscalculated.Thedatafromroadintersection,thedelayandfuelsavingsareaddedtoevaluatesocioandenvironmentparameters. 4.1.2 Secondary Data (Collected Responses from Questioner) Secondary data is about collected responses which have beencollectedmanuallyfromquestioner.Thenthesolution using ITS to the existing condition without changing infrastructure is identified. Hence comparisons between presentconditionandwithsuggesteddeploymentsaredone. 4.2 TRAFFIC FLOW CONVERSION IN PCU The PCU (Passenger Car Unit) is a measure used in transportationengineeringtoevaluatehighwaytrafficflow rates. In comparison to a normal passenger vehicle, a passenger car unit is a measure of the form of transportation'simpactontrafficfactors(suchashighway, speed,anddensity).It'salsoregardedastheequivalentofa passengervehicle.BecauseIndiaisacountrywithunusual traffic circumstances, all kinds of vehicles must be factorshasconsideredwhenstudying.Toaddressthisissue,trafficflowbeenredirectedtoPCU.ThefollowingaretheconversionforthePCU: Table 1: ValuesofPCUfordifferenttypesofvehicles Type Vehicleof wheelerTwo wheelerThree wheelerFour VehicleHeavy FactorPCU 0.5 1.00 1.00 3.00 4.2.1 Traffic Count Tally Sheet ( Rajkamal Square) TRAFFIC COUNT TALLY SHEET hApproacRoad Rajkamal Square IntervalTime Motorized 1 2 3 4 5 6 THeavyruck PickGoodsUp usB raC wRikshaAuto CycleMotor 7.32AM7.30 0 6 4 01 20 40 7.347.32AM 0 6 3 51 15 40 7.367.34AM 0 6 4 02 13 37 7.387.36AM 0 8 6 51 14 30 7.407.38AM 0 0 5 51 20 35 7.42AM7.40 0 13 01 01 10 40 7.44AM7.42 0 10 8 02 14 44 7.46AM7.44 0 6 8 51 18 27 7.48AM7.46 0 6 6 21 25 22 7.50AM7.48 0 7 7 02 20 20 7.52AM7.50 0 6 4 21 20 35
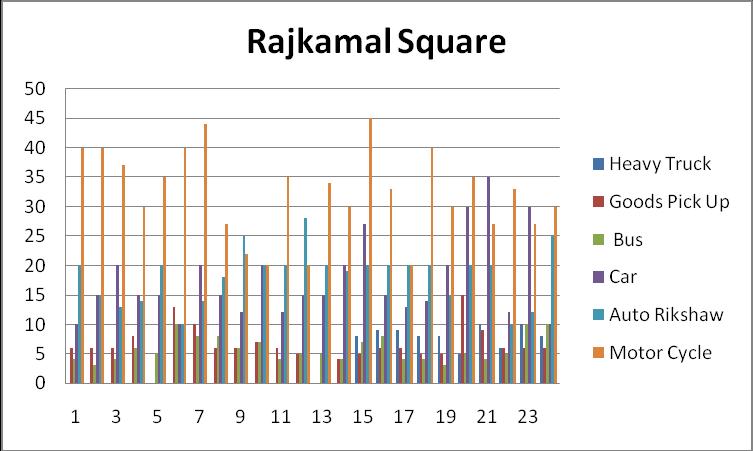
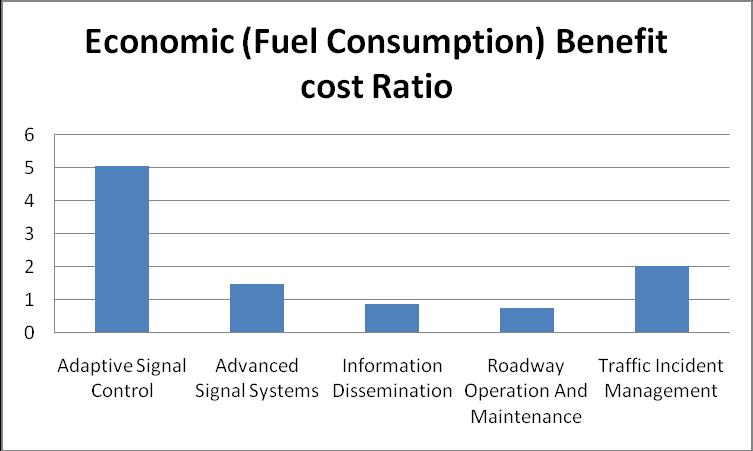
International Research Journal of Engineering and Technology (IRJET) e ISSN: 2395 0056 Volume: 08 Issue: 12 | Dec 2021 www.irjet.net p ISSN: 2395 0072 © 2021, IRJET | Impact Factor value: 7.529 | ISO 9001:2008 Certified Journal | Page580 7.54AM7.52 0 5 5 51 28 20 7.56AM7.54 0 0 5 51 20 34 7.58AM7.56 0 4 4 02 19 30 8.00AM7.58 8 5 7 72 20 45 8.02AM8.00 9 6 8 51 20 33 8.04AM8.02 9 6 4 31 20 20 8.06AM8.04 8 5 4 41 20 40 8.08AM8.06 8 5 3 02 15 30 8.12AM8.08 5 15 5 03 20 35 8.16AM8.12 10 9 4 53 20 27 8.20AM8.16 6 6 5 21 10 33 8.24AM8.20 10 6 01 03 12 27 8.30AM8.24 8 6 01 01 25 30 7.32AM7.30 81 152 541 563 428 674 Hr.PCU/1 243 152 541 563 428 337 Chart 1:RajkamalSquare(TrafficCount) 4.3 TRAFFIC VOLUME DATA Whencalculatingtrafficcharacteristics,thesizeofthecars ontheroadiscritical.Thestatisticssectionofthischapter provides data on traffic flow at each junction. The traffic volume data from all incoming lane at each junction is collected. Picture below shows site location of Rajkamal squarefortrafficdata Fig -1:SitelocationRajkamalSquare 5. RESULTS & DISCUSSION 5.1 DISCUSSION OF THE FINDINGS Inthischapter,theresultsarecalculatedandarediscussed; the impact of fuel consumption per day with ITS (Signal synchronization) and without ITS is calculated from that perEmissionconsumptionmonthlyandyearlycanbecalculated.LikewiserateofNOxandCO2iscalculatedandaveragecostaccident. 5.1.1 Fuel Consumption calculations yielded this result. Chart 2:Graphshowingreductionoffuelconsumption whensignalsynchronizationisused ThegraphshowthereductioninFuelconsumptionifSignal Synchronizationisusedandfromthegraphitcanbeseen
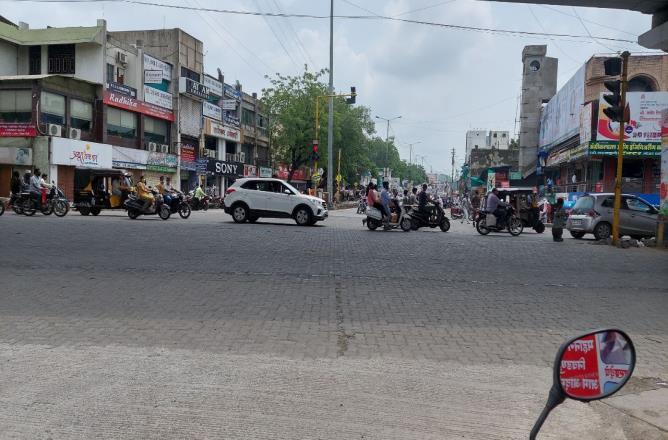
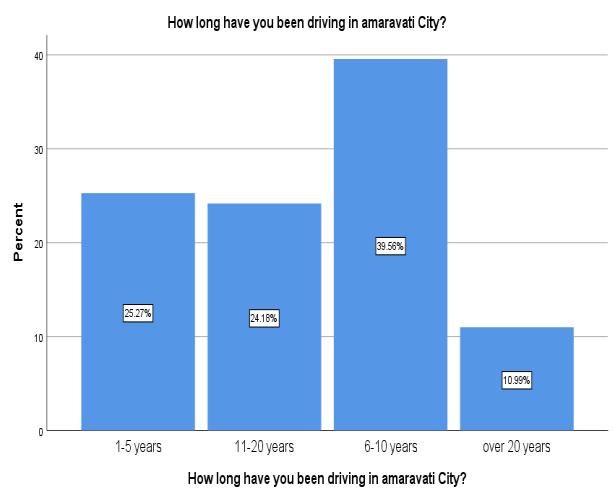
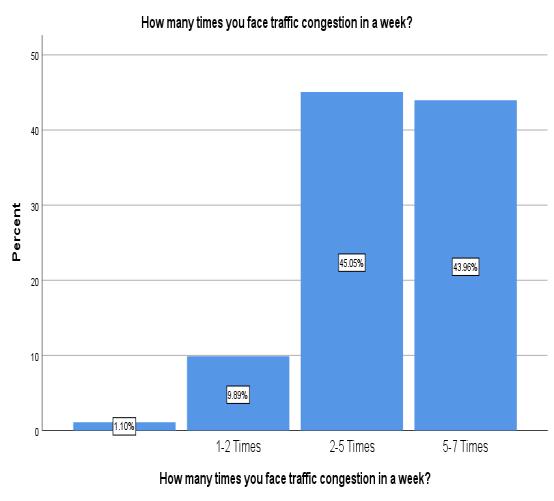
International Research Journal of Engineering and Technology (IRJET) e ISSN: 2395 0056 Volume: 08 Issue: 12 | Dec 2021 www.irjet.net p ISSN: 2395 0072 © 2021, IRJET | Impact Factor value: 7.529 | ISO 9001:2008 Certified Journal | Page581 that about 8% to 10% of fuel can be saved by their implementation Chart 3: Economicfactorbenefitcostratiographof ITSdeployments From above graph the fuel saved by using signal synchronizationforadaptivesignalcontrolandbenefitcost ratio is greater, that means evaluated benefits of these woulddeploymentsaregreaterandthereforetheirimplementationbeprofitable. Table -2:QuestionerResponses(Driving) How long have you been driving in Amaravati City? FrequencyPercent PercentValid CumulativePercent Valid1 5 years 23 25.3 25.3 25.3 11 years20 22 24.2 24.2 49.5 6 years10 36 39.6 39.6 89.0 overyears20 10 11.0 11.0 100.0 Total 91 100.0 100.0 Chart 4: QuestionerSurveyResponses Inthegraphabove,wecanseethatthereareatotalof 20 yearsofdatacollectedfromoursamplesize,whichshows that 39.5 percent of people have more than 6 10 years of driving experience and 25.27 percent have 1 5 years of driving experience. 24.1 percent of those polled claim to have 11 20 years of experience. The remaining 10.99 percentclaimtohavemorethan20yearsofexperience. Table 3:QuestionerResponses(TrafficCongestion) How many times you face traffic congestion in a week? Frequency Percent PercentValid CumulativePercent Valid 1 1.1 1.1 1.1 1 Times2 9 9.9 9.9 11.0 2 Times5 41 45.1 45.1 56.0 5 Times7 40 44.0 44.0 100.0 Total 91 100.0 100.0
International Research Journal of Engineering and Technology (IRJET) e ISSN: 2395 0056 Volume: 08 Issue: 12 | Dec 2021 www.irjet.net p ISSN: 2395 0072 © 2021, IRJET | Impact Factor value: 7.529 | ISO 9001:2008 Certified Journal | Page582 Chart 5: QuestionerSurvey(TrafficCongestion) Wecanseefromthegraphabovethattherewasastudyof traffic congestion for a week with a sample size of 45.5 percentofpersonshavingmorethan2 5timesfacetheissue and43.96percenthaving5 7timesconfrontthesituation. 9.89 percent of those who have experienced traffic congestion 1 2 times. The remaining 1.10 percent will be affectedatsomepointinthefuture. 6. CONCLUSION 1.There is a previous post and a pre impact in the currentdebate. 2.ThegoalofthisresearchistoofferthebareminimalinfrastructureandtogivecurrentresearchintheITSfieldthroughaliteratureevaluation. 3.Expanding ITS may decrease the frequency of prioraccidentsandsavemillionsoflives,accordingtoadebate. 4.For the Amaravati city we suggest some ITS as economicfromshowninfig4.8andfromoverallcalculationsandresultsanddiscussiontheimpactofsocial,andenvironmentalfactors 5.Wehavecomparativegraph,itcanbeseenthatfuel benefitandemissionsavedismoreforvehicularflowandforvehiculardecreaseinexhaustpollutantsinsocietycrashescanbeminimized/decreaseandthuscostratiosareobtained. 6.The All conclusion are conclude from the below points. 7.Intelligent transportation systems decrease fuel pollutants.thewhenusagebyapproximately8%to10%andevenriseusedonafullyoperationalITSnetwork;inlongterm,italsohelpstominimizehazardous
7. FUTURE SCOPE
1. Several operational trialsfortheRail Intersection Program Region, the newest area of ITS, are underongoing,butnodatahasbeenpublished sofar.
7. To get additional advantages, certain ITS deploymentsmaybeexpandedtootherroutes inmetropolitanareas.
9.Thisindicatesthat ITS is beneficial tosociety,the economy,andtheenvironment.
3. Over the following several years, as the program develops,moredatawillbecomeaccessible.
2. Manygovernmentsareincreasinglyexploringthe advantages of ITS in facility and equipment maintenanceandrepair.
11. When the socioeconomic and environmental aspects of a specific expansion are taken into consideration
5. COandNOxwerechosenasthestudy'stwogases.
REFERENCES [1] Drop,N.,&Garlińska,D.(2021).Evaluationofintelligent transport systems used in urban agglomerations and intercity roads by professional truck drivers. Sustainability (Switzerland), 13(5). https://doi.org/10.3390/su13052935 [2] Yang,Z.,Peng,J.,Wu,L.,Ma,C.,Zou,C.,Wei,N.,Zhang,Y., Liu,Y.,Andre,M.,Li,D.,&Mao,H.(2020).Speed guided intelligent transportation system helps achieve low carbon and green traffic: Evidence from real world measurements.JournalofCleaner [3] Production, 268, 122230. https://doi.org/10.1016/j.jclepro.2020.122230 [4] Grushetsky, S., Brylev, I., Evtukov, S., & Pushkarev, A. wheeled(2020).Roadaccidentpreventionmodelinvolvingtwovehicles.TransportationResearchProcedia,
4. Wecanallassessthecost benefitratioofexpanding intelligenttransportation.
12. The maximum positive benefit cost impact on positivesignalcontrolis5.89Asaconsequence, morecomparedtoroadinfrastructureitsinstallationisexpensiveandappealing.
8.TheseITSadvantageswillhaveapositiveeffecton thecountry'ssocioeconomicgrowth,resultingin manyjobpossibilities.
10. It is critical to the growth of any metropolitan metropolis, as it aids in the reduction of traffic congestion, accidents, pollution, and fuel consumption.
6. Othergasesmaybenefitfromfurtherstudy.
ImprovingUrbanTrafficSmoothBasedonAdvanced DID Model. Mathematical Problems in Engineering, 2015.https://doi.org/10.1155/2015/564230 [13] Barth, M. J., Wu, G., & Boriboonsomsin, K. (2015). 015Reports,Reductions.IntelligentTransportationSystemsandGreenhouseGasCurrentSustainable/RenewableEnergy2(3),9097.https://doi.org/10.1007/s405180032y [14] Gokulakrishnan,P.,&Ganeshkumar,P.(2015).BEAM HW: Bandwidth Efficient Acknowledgement based MulticastProtocolforHigh_Way:ANovelProtocolfor https://doi.org/10.17485/ijst/2015/v8i31/77080andEmergencyWarninginVANET.IndianJournalofScienceTechnology,8(31). [15] Raut, S. B., & Malik, L. G. (2015). Survey on vehicle collisionpredictioninVANET.2014IEEEInternational Conference on Computational Intelligence and 751.ComputingResearch,IEEEICCIC2014,December,735https://doi.org/10.1109/ICCIC.2014.7238552
[10] Hassanpour, S., Ghanbarzadeh, K., & Nozarigilan, M. (2016). Economic Analysis of Intelligent systems in UrbanTransportation(SmartCameras).5(3),227 233.
© 2021, IRJET | Impact Factor value: 7.529 | ISO 9001:2008 Certified Journal | Page583 50(2019), 201 210. https://doi.org/10.1016/j.trpro.2020.10.025
International Research Journal of Engineering and Technology (IRJET) e ISSN: 2395 0056 Volume: 08 Issue: 12 | Dec 2021 www.irjet.net p ISSN: 2395 0072
[7] Khan, A. F., & Ghodmare, S. D. (2017). Sustainability Impact Analysis of Intelligent Transportation System. 3(10),112 116.
[11] Razzaq,S.,Riaz,F.,Mehmood,T.,&Ratyal,N.I.(2016). Multi FactorsBasedRoadAccidentPreventionSystem. https://doi.org/10.1109/ICECUBE.2016.749522190and2016InternationalConferenceonComputing,ElectronicElectricalEngineering,ICECube2016Proceedings,195.1
[8] Toulouki,M.A.,Vlahogianni,E.I.,&Gkritza,K.(2017). Perceived socio economic impacts of cooperative Intelligent Transportation Systems: A case study of Greek urban road networks. 5th IEEE International ConferenceonModelsandTechnologiesforIntelligent Transportation Systems, MT ITS 2017 Proceedings, 733 https://doi.org/10.1109/MTITS.2017.8005609737.
[12] Li, M. W., Yun, J., & Liu, N. (2015). Calculating the ContributionRateofIntelligentTransportationSystem in
[9] Alrawi, F. (2017). The importance of intelligent transport systems in the preservation of the environment and reduction of harmful gases. Transportation Research Procedia, 24, 197 203. https://doi.org/10.1016/j.trpro.2017.05.108
[5] Sumalee, A., & Ho, H. W. (2018). Smarter and more connected: Future intelligent transportation system. IATSS Research, 42(2), 67 71. https://doi.org/10.1016/j.iatssr.2018.05.005
[6] Zhang, X., Liu, D., & Wang, J. (2018). Cost Effective Evaluation Study of Intelligent Public Transportation System Based on Social Investigation. Transport and Communications Bulletin for Asia and the Pacific, 88, 43 57.