International Research Journal of Engineering and Technology (IRJET) e ISSN: 2395 0056 Volume: 08 Issue: 11 | Nov 2021 www.irjet.net p ISSN: 2395 0072 © 2021, IRJET | Impact Factor value: 7.529 | ISO 9001:2008 Certified Journal | Page1606 Analysis the Amounts of Heavy Metals and Trace Elements in Water of Different Sources of Ranchi city by using ICP-OES Technique Vikash Kumar1 , Ashok K Acharya2 1M.Sc. Scholar, Dept. of Chemistry, Dr Shyama Prasad Mukherjee University Ranchi, Jharkhand, India 2Assistant Professor, Dept of Chemistry, Dr Shyama Prasad Mukherjee University Ranchi, Jharkhand, India *** Abstract – The study was aimed to analyze the concentration of metals including heavy metals and trace elements in the water of four different small water bodies or riverconcentrationsWHOwithinmetalstheEmissionanalyzedCa,Ranchisourcesincludingtwopond,onelakeandoneriveraroundthecity.ThemetalsortraceelementssuchasAg,Al,B,Bi,Cd,Co,Cr,Cu,Fe,K,Mg,Mn,Na,Ni,PbandZnwerebyusingInductivelyCoupledPlasmaOpticalSpectroscopytechnique.Theresultsindicatedthatconcentrationofapproximatelyallthemetals,heavyandtraceelementsinthesewaterbodieswerefoundthemaximumpermissiblelimitsetbyIS:2296,EPAandforsurfacewaterqualitystandard.HigherofAlinLakeofChamber,BiandMninJumarthanothersites,werereported. Key Words: Heavy Metal Analysis, Trace Elements, ICP OES Technique, Water Analysis, Emission Spectroscopy, Ranchi City. 1. INTRODUCTION Indiaisacountrywithadiverselandscapeandrivers.There are14majorriversandotherfreshwaterbodies,bothlarge andsmall.Water,theuniversalsolvent,hasthepropertyof dissolving most compounds due to its high dielectric constant, but an excess of these chemicals causes water pollution, including heavy metal and trace element contamination. Thedischargeof effluentsfromindustries, home activities, and soil contamination from adjacent dumpingsitesandagriculturaldrainage,damagethewater bodiesbasedonwaterqualityprospective[1]. Jharkhand, one of the states in eastern part of India, is knowntohavemineralsrichstateglobally. Jharkhandisa wonderfullandwithenormouspotentialandaplethoraof othernaturalresources.Thestatecoversageographicalarea of 79,714 km2 , has 29.61 percent forest land, and holds roughly40%ofIndia'stotalmineralresources,asperdata providedbyDepartmentofMinesandGeology,Government ofJharkhand[2] Due to being one of the minerals rich State of Indian typessurfacetRepublic,therearevariousmetalsincludingheavymetalandraceelementcontaminationsinwaterincludinggroundandwater,soilandairaswell.Thepresenceoftheseofheavyandtracemetals/elementsinwaterbodies causes serious impact on human health as they enter in humanbodydirectlythroughdrinkingorindirectlythrough the consumption of aquatic products (viz. fishes, etc.) obtainedfromthesewaterbodiesandagriculturalproducts, irrigatedwithwaterfromthesesources.Asperexplainedby [3] (G. S. David and I. A. Isangedighi, 2019), heavy metals transferredintothemarineenvironmentmaybeabsorbed into the marine food chain and eventually reach human consumersviaaquatictransport,causinganumberofmajor healthrisks. Heavymetalsaredescribedas"anymetallicelementwitha relatively high density (mass/volume) that is poisonous evenatextremelylowconcentrations;oraclassofmetals andmetalloidshavinganatomicdensitygreaterthan4g/cm3 or 5 times that of water”[4] The body cannot detoxify certainmetalsbecausetheyarestable.Intheacidicmedium of the stomach, these metals are turned to their stable oxidationstatessuchasCd2+,Mg2+Zn2+,Pb2+,Ni2+ , Cr3+,Cr6+ , etcandunitewiththesulfhydrylgroupsof biomoleculeof humanbodysuchasproteins,lipids,DNAandenzymesto establish strong and stable chemical bonds[5] Protein denaturation(Hg,PbandCd),Inhibitionofcelldivision(Hg, Pb,CdandNi),Cellmembranedisruption(Hg,Pb,Zn,Ni,Cu andCd),Inhibitionofenzymeactivity(Hg,Pb,Zn,Ni,Cuand Cd) and transcription inhibition, are the main toxicity mechanism affecting the microorganisms. Heavy metals enter the environment through both natural and human caused sources. Earth’s crust natural weathering, sewage effluents, soil erosion, urban runoff, industrial discharge, pest or disease control agents applied to plants, and air pollutionfalloutareexamplesofsuchsources.Heavymetal contamination of the aquatic environment has become a globalissueinrecentyears,owingtotheirindestructibility and the fact that most of them have hazardous effects on Asspecies[6].perbeingoneofthemainobjectivesofthisinstrumental analysis, there are some heavy metals and trace elements whose concentration in water bodies, were analyzed by using Inductively Coupled Plasma Optical Emission Spectrometry (ICP OES) technique. These metal and elements are Silver (Ag), Aluminum (Al), Boron (B), Chromium (Cr), Copper (Cu), Iron (Fe), Potassium(K), Magnesium(Mg),Manganese(Mn),Calcium(Ca),Cadmium

1.1 Study Area
The purpose of sampling procedureswas to collect a smallamount of material (water)that could be easily transported to the analytical researchlaboratorywhile stillrepresentingthesamplebeinghandled.Incleanplastic bottles,anequalamountofwatersampleswascollected.The bottles were cleaned, rinsed with tap water then with distilledwaterbeforethesampleswerebeingcollected.The samples were collected by keeping in mind the standard samplecollectionprotocol,procedureandguidelinesgiven inIndianStandardmethodsIS:3025(Part I)andAmerican Public Health Association (APHA) 22nd edition. Special precautions were taken at the time of collection of samples[6]. The samples were collected in plastic bottles, from four different small waterbodies (ponds) located around Ranchi city (as summarized in Table 1) and each samplebottleswereclearlymarkedwithwaterproofblack inkandotherrelevantdetailswererecorded.Thissampling procedureswerecarriedoutduringtheendofthemonsoon in Jharkhand (viz. after Mid of September 2021). The collectedwater samples were filtered, byusing a vacuum type filtration apparatus as soon as they arrived at the laboratory.Thewatersampleswerefilteredusinga0.45µm membranefilter[8]
ICP OESisananalyticalinstrumentaltechniquethatisused fordeterminationofheavyandtracemetals.Thisisamulti elementinstrumentaltechniquewhichusesaplasmasource to excite the atoms in samples. These excited atoms from groundstatestoexcitedstates,emitlightofacharacteristic wavelength, and a detector measures the intensity of the emittedlightonreturningbacktothegroundstate,whichis
1.2 Monitoring Sites Thecontaminationsofheavymetalsandtraceelementsin (surface)wateroffourdifferentsmallwaterbodies(2ponds, 1lakeand1river)aroundRanchicity,wereanalyzed.These sampling sites and their coordinate values with clickable hyperlink,aresummarizedinTable 1givenbelow. Table 1: SamplingSites,Sites’CodeandtheirCoordinate values CodeSite Samplinglocation CoordinateValues I LakeofChamber,HEC Ranchi 23°18'04.4"N85°15'59.9"E II RMCHPond,RIMS Ranchi 23°23'17.1"N85°20'54.4"E III JumarRiver,Ranchi 23°24'25.4"N85°24'36.7"E IV KaramtoliRanchiPond, 23°23'14.5"N85°19'48.2"E
2.1 Sampling Procedures
Thepresentresearchworkinvolvestheassessment ofthe concentrations of heavy metals and trace elements in the wateroffourdifferentwaterresourcesofRanchicity(The capital cityofJharkhand,India).Therearetotal 17metals including heavy metals and trace elements as well, which wereanalyzedbyusingInductivelyCoupledPlasma Optical Emission Spectrometry (ICP OES) technique. These four waterbodies/sourcesare i)LakeofChamberHECRanchi, ii) RMCH Pond, iii) Jumar River and iv) Karamtoli Pond (Summarizedintable 1).Geographically,Ranchiissituated on the southern end of the Chhota Nagpur Plateau, which comprises the easternmost section of the Deccan plateau system. The 'City of Water Falls' refers to the area surroundingRanchicitythathasbeendonatedwithnatural attractions.TheaverageelevationattheRanchicityis645m above Mean Sea Level (MSL). Ranchi lies at 23o22’N and 85o20’EneartotheTropicofCancer[7]
2.2.1 Inductively Coupled Plasma- OpticalEmission Spectrometry (ICP OES)
2.2 Elemental Analysis by ICP OES
International Research Journal of Engineering and Technology (IRJET) e ISSN: 2395 0056 Volume: 08 Issue: 11 | Nov 2021 www.irjet.net p ISSN: 2395 0072 © 2021, IRJET | Impact Factor value: 7.529 | ISO 9001:2008 Certified Journal | Page1607 (Cd), Cobalt (Co), Sodium (Na), Nickel (Ni), Lead (Pb), Bismuth(Bi)andZinc(Zn).
2. METHODOLOGY: MATERIALS AND METHODS
A variety of inorganic instrumental techniques such as atomic absorption spectroscopy (AAS), inductively couled plasma optical emission spectroscopy (ICP OES) and ICP mass spectrometry (ICP MS), can be used measure and analyze the contaminations of metals, heavy metals and traceelementsinwatereitheritisdrinkingwater,surface waterorwastewater.Basedonthenumberofmetallicor non metallic elements that need to be analyzed or determinedandthenumberofmaterialsamplesthatneedto be run, the most suitable and preferable technique for business requirements can be chosen. ICP OES is a good match with the productivity requirements of many laboratories and requires only a moderate investment[9] The ICP OES technique was used to analyze the concentrationsofmetals,heavymetalsandtraceelementsin these(Table 1)waterbodies/sourcesduringthecourseof thisstudy
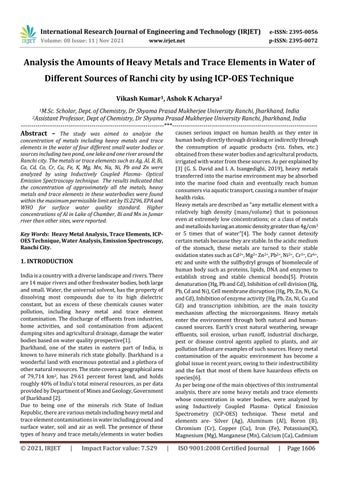
Inductively Coupled Plasma (ICP) is an argon gas plasma maintained by the interaction of an RF field and ionized argongas.Theplasmastartsallowingcompleteatomization ofthe elementsinwatersampleandminimizing potential chemical interferences when the temperature reached as highas10,000K.ICP OESisthemeasurementofemission intensity onselected wavelengthforindividual analyte, of thelightemittedbytheelementsinasampleintroducedinto anICPsource.Themeasuredemissionintensitiesarethen compared to the intensities of standards of known concentrationtoobtaintheelementalconcentrationsinthe unknownsample[11]withthehelpofcalibrationcurve.The light emitted from an ICP can be viewed in two ways viz, radialviewwhichresultsinthehigherupperlinearranges, and axial view which results continuum background from the ICP itself reduces and sample path is maximized. The detection limits obtained by axial viewing are better than thoseobtainedbyradialviewing.TheblockdiagramforICP OESrelevantprocedurestepsisdepictedinFigure 2 Figure 2: BlockDiagramofICP OES The final concentration of contaminants in water bodies carried out by calibration curves (Intensity vs Concentration)ofindividualanalyteseparately.
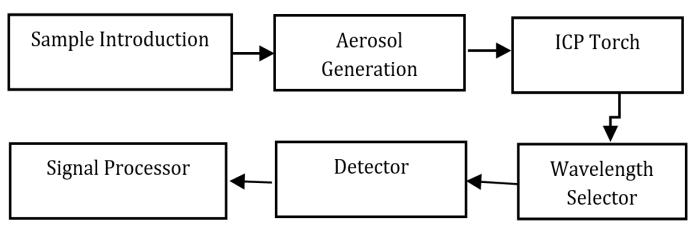
2.2.2 Instrumentation AnICP OESinstrumentofModelOptimaTM2100DVICP OES (Perkin Elmer, USA) with (specifications in Table 2), was usedtodeterminetheconcentrationsoftheseheavymetals andtraceelementsinthewatersamplesofcorresponding waterbodies(Table 1).Theworkingmechanismdiagramor instrumentalsetupofICP OESandoptimuminstrumental conditionsaregiveninFigure 3andTable 3respectively. 2100
Table 2: Optima
DVICP OESInstrument Specifications Parameters Instrument Specifications Detectors UVSensitivedualbacksideilluminatedCCD arraydetector RangeSpectral 160nm 900nm ResolutionSpectral 0.009nmat200nm Speed 20 25elementsinlessthan5minutes Table 3:OptimumInstrumentalConditions Parameters OperatingConditions View AxialView OpticalSystem Echelle Power 1450w PlasmaGasFlow 15L/min AuxiliaryGasFlow 0.2L/min SampleFlowRate 1.5mL/min NebulizerNebulizing Chamber Cyclonic Nebulizer ConcentricGlass(Meinhard) TypeA IntegrationTime 1.0second Figure 3: ICP OESInstrumentalMechanismSetup Nebulizer
International Research Journal of Engineering and Technology (IRJET) e ISSN: 2395 0056 Volume: 08 Issue: 11 | Nov 2021 www.irjet.net p ISSN: 2395 0072
© 2021, IRJET | Impact Factor value: 7.529 | ISO 9001:2008 Certified Journal | Page1608 thenrelatedwiththeconcentrationsoftheanalyte.Samples areheatedthrough10000Ktoatomizeeffectivelywhichis an important advantage for ICP technique. Another advantageismulti elementalanalysis.WithICPtechnique, approximately60metallicornon metallicelementscanbe analyzed in single sample run within a minute simultaneously, or in a few minutes sequentially. High operatingtemperaturelowerstheinterferences.[10].
International Research Journal of Engineering and Technology (IRJET) e ISSN: 2395 0056 Volume: 08 Issue: 11 | Nov 2021 www.irjet.net p ISSN: 2395 0072 © 2021, IRJET | Impact Factor value: 7.529 | ISO 9001:2008 Certified Journal | Page1609 2.3 Sample Analysis Watersampleswereoftenimmediatelyinjectedintoplasma withoutanyfurthermoredilution.Tokeeptheirelemental and metalliccomponents in solution, they were usually acidifiedwithnitricacid(HNO3).Aconcentricnebulizerand a cyclonic spray chamber are typical sample introduction systems for this kind ofsample type. With regards to particlesinsolution,anebulizercantypicallyhandleparticle sizes up to one third of the capillary diameter without becoming blocked[7][13] All the water samples were analyzedforAg,Al,B,Bi,Ca,Cd,Co,Cr,Cu,Fe,K,Mg,Mn,Na, Ni,Pb andZn, byfollowing propersteps,procedures with various components and procedures either it was sample introduction, aerosol generation, ICP torch, wavelength selection, detection, signal processing or determination of metallic concentrations by calibration graph etc, were followed as per guidelines prescribed by [4][11][14][15][16][17]and[18]. 3. RESULTS AND DISCUSSIONS The metallic and elemental concentrations of above mentionedfourwatersourcesofRanchicity(Table 1),were analyzedbasedonappropriateinstrumentalmethodsandby usingrequiredmaterials,asmentioninprevious‘Materials andMethod’section.Theseexperimentalresultswiththeir selectedwavelengthforICP OES,aredepictedinTable 4 Table 4:InstrumentalResultsofmetalconcentrations Metals WavelengthAnalyte Concentration Mean (mg/L) Site I Site II Site III Site IV Ag 328.068 0.050 0.017 0.068 0.050 Al 396.153 1.224 0.113 0.541 0.308 B 249.677 0.329 0.343 0.362 0.362 Bi 223.061 0.432 0.765 1.130 0.549 Ca 422.676 23.86 61.19 57.78 49.70 Cd 228.802 0.026 0.007 0.010 0.009 Co 228.616 0.007 0.040 0.018 0.007 Cr 267.716 0.029 0.238 0.150 0.157 Cu 324.752 0.006 0.085 0.022 0.003 Fe 259.939 0.653 0.120 1250 0.470 K 766.490 2.208 15.38 6.397 6.272 Mg 279.077 6.298 17.91 11.97 9.454 Mn 257.610 0.024 0.017 1.311 0.001 Na 589.592 2.412 48.71 24.87 22.72 Ni 231.604 0.034 0.075 0.028 0.029 Pb 220.353 0.132 0.465 0.125 0.023 Zn 213.857 0.121 0.224 0.327 0.231 (Sites’codeasmentionedintable 1) All the metals and elements are further classified in two groups(Group 1andGroup 2)basedontheirconcentration level viz, High and Low Concentration. The metals having highconcentrationofGroup 1,depictedinChart 1andthe metals/elements having low concentration of Group 2, depictedinChart 2.
The concentration of group 1 metals (Na, K, Mg and Ca) were found to be within the permissible range, as per suggestedbySurfaceWaterQualityStandard(IS;2296)[19], Environmental Protection Agency(EPA), USA and World Health Organization (WHO) for outdoor bathing, for fish cultureand wild lifepropagation, for irrigation, industrial cooling and controlled waste disposal except for drinking purpose(Chart 1).
The concentration of Al in Lake of Chamber, HEC Ranchi (Site I),werefoundtobegreaterthanothersites.Itmight be due to closeness of this lake to Heavy Engineering Corporation(HEC)Ltd,Ranchi(Chart 2).Theconcentration of Bi and Mn, in the water of Jumar river (Site III) was reportedhigherthanothersites.Attheendafteranalyzing thecontaminationsofheavymetals,traceelementsinthese water sources, were found to be in range of maximum permissiblerangeofsurfacewaterqualitystandard 0 4020 10080
60
Chart 1: Conc.ofGroup 1metals
Theconcentrations of heavy metalsandtrace elements of Group 2,suchasAg,Al,B,Bi,Cd,Co,Cr,Cu,Fe,Mn,Ni,Pb andZn,inthesefour water sourceswerealsofoundto be withingthepermissiblerange,aspersuggestedbyIS2296, EPA,and WHO for various activities includingfish culture andwildlifepropagationnotfordrinkingpurpose[20][21]
Na K Mg Ca
(mg/LConcentration )
ConcentrationofGroup 1metals/elementsfoundin samples SiteSite-Site-IIIIII Site- IV IS:2296
International Research Journal of Engineering and Technology (IRJET) e ISSN: 2395 0056 Volume: 08 Issue: 11 | Nov 2021 www.irjet.net p ISSN: 2395 0072 © 2021, IRJET | Impact Factor value: 7.529 | ISO 9001:2008 Certified Journal | Page1610 Chart 2:Conc.ofgroup 2metalsandelements
[11] P.Inc,“AtomicSpectroscopyAGuidetoSelectingthe AppropriateTechniqueandSystemAA,ICP OESAND ICP
MS,” Accessed: Nov. 24, 2021. [Online]. www.perkinelmer.com/atomicspectroscopy.Available: [12] “ICP OES Sample Preparation | Thermo Fisher ScientificIN.” preparation.htmlinformation/icplearninganalysis/spectroscopyrial/spectroscopyhttps://www.thermofisher.com/in/en/home/industelementalisotopeelementalisotopeanalysiscenter/traceelementalanalysisteaoesinformation/icpoessample(accessedNov.24,2021). [13] “ICP OESDataAnalysis|ThermoFisherScientific IN.” learninganalysis/spectroscopyrial/spectroshttps://www.thermofisher.com/in/en/home/industcopyelementalisotopeelementalisotopeanalysiscenter/traceelementalanalysistea 1.51.20.90.60.30 Ag Al B Bi Cd Co Cr Cu Fe Mn Ni Pb Zn (mg/L)Concentration ConcentrationofGroup 2metals/elementsfoundinsamples SiteSite-III Site- III Site- IV
Theauthorsarevery thankful to Dr. SanjayKumar Swain, Research Officer, Central Instrumentation Facility (CIF),BirlaInstituteofTechnology(BIT)Mesra,Ranchifor InstrumentationandLaboratoryassistance
[1] A. Rai, B. Paul, N. K. I. J. of plan, animal and, and undefined2012,“Astudyonthesewagedisposalon water quality of Harmu River in Ranchi city Jharkhand,India,”Citeseer,Accessed:Aug.15,2021. =10.1.1.1048.3859&rep=rep1&type=pdf.https://citeseerx.ist.psu.edu/viewdoc[Online].Available:/download?doi
[8] P.Botes,“Investigationofmobilityoftraceelements in river sediments using Table of Content,” no. December,2003.
ACKNOWLEDGEMENT
Theauthorsarealsothankful to facultymembers Dr.KhurshidAkhtar,Dr.RajeevRanjanandDr.NKRoy,And Colleagues Ujjwal Kumar, Shalini Kumari, Anil Sahu, Gangadhar Nag, Monu Kumar, Aditi Narain, Sochiskesha Mahato and Dhananjay Pd Kushwaha, of University Department of Chemistry, Dr. Shyama Prasad Mukherjee University Ranchi, for their wonderful guides, loves and supportduringthecourseofstudyandresearch
[4] C.A.N.N.Y.A.O.G.IgbumK.Asemave,“HeavyMetal Analysis of Blends of Methyl Esters Obtained from FourVirginTropicalSeedOils,”Int.J.Sci.Res.,vol.2, no. 4, pp. 463 467, 2013, [Online]. pdf.https://www.ijsr.net/archive/v2i4/IJSRON2013571.Available:
[5] J. O. Duruibe, M. O. C. Ogwuegbu, and Egwurugwu, “Heavymetalpollutionandhumanbiotoxiceffects,” Int. J. Phys. Sci., vol. 2, no. 5, pp. 112 118, 2007, Accessed: Nov. 25, 2021. [Online]. Available: http://www.academicjournals.org/IJPS.
[6] O.V.S.Raju,P.M.N.Prasad,V.Varalakshmi,andY.V. R.Reddy,“DeterminationofHeavyMetalsinGround Water By Icp Oes in Selected Coastal Area of Spsr Nellore District , Andhra Pradesh , India,” Int. J. Innov.Res.Sci.Eng.Technol.,vol.3,no.2,pp.9743 9749,2014.
[7] A. K. Rai, B. Paul, and N. Kishor, “a Study on the SewageDisposalonWaterQualityofHarmuRiverin Ranchi City Jharkhand , India,” Int. J. Plant, Anim. Environ.Sci.,vol.2,no.1,pp.102 106,2012.
The present study based on the analysis of metals, heavy metalsandtraceelementsinthewaterfourdifferentwater sources(twopond,onelakeandoneriver)locatedaround the Ranchi city (Jharkhand), were carried out in the mid monthofSeptember2021.Astheresults,theapproximately all the metals and elements were found within the range maximum permissible limit set by Indian Standard (IS: 2296),EPAandWHOforvariouspurposeofuse,exceptfor drinking.
REFERENCES
[10] N.Ivanova,V.Gugleva,M.Dobreva,I.Pehlivanov,S. Stefanov,andV.Andonova,“WeareIntechOpen,the world ’ s leading publisher of Open Access books Builtbyscientists ,forscientists TOP1%,” Intech, vol.i,no.tourism,p.13,2016.
[9] P.Sarojam,“APP_MetalsinWastewater,”PerkinElmer Instruments, p. 11, 2010, [Online]. Available: pdf.solutions/resources/docs/APP_MetalsinWastewater.http://www.perkinelmer.co.uk/lab
[3] G. S. David and I. A. Isangedighi, “Heavy metals contamination in fish: effects on human health,” J. Aquat.Sci.Mar.Biol.,vol.2,no.4,pp.7 12,2019.
3. CONCLUSION
[2] “DepartmentofMinesandGeology,Governmentof Jharkhand.” (accessedhttp://jharkhandminerals.gov.in/content/1/1Sep.28,2021).
AUTHOR’S BIOGRAPHIES
© 2021, IRJET | Impact Factor value: 7.529 | ISO 9001:2008 Certified Journal | Page1611 information/icp oes information/icp oes data analysis.html(accessedNov.24,2021).
[19] J.Area,“WaterQualityStandards,IS :2296,”pp.245 252,1982.
ASHOK K ACHARYA Assistant Professor and Head of University Department of Chemistry, Dr. Shyama Prasad Mukherjee University, Ranchi, Jharkhand(India) Formorethana decade, he has been teaching Undergraduate and Postgraduate students. He has worked in the fields of chemical kinetics and quantum mechanics, with a particularinterestinnanoscience. He has multiple research papers published in prestigious national andinternationaljournals.
[21] “TREATMENTMETHODSResidentialPoint of Entry Point of Use,” 2013, Accessed: Nov. 26, 2021. chemicals/aluminium/en/.http://www.who.int/water_sanitation_health/dwq/[Online].Available:
International Research Journal of Engineering and Technology (IRJET) e ISSN: 2395 0056 Volume: 08 Issue: 11 | Nov 2021 www.irjet.net p ISSN: 2395 0072
VIKASH KUMAR Student, Master of Science (M.Sc.) in Chemistry (Session : 2019 21), UniversityDept.ofChemistry,Dr. Shyama Prasad Mukherjee University Ranchi, Jharkhand (India), Bachelor of Science (B.Sc.) in Chemistry (Session : 2016 19), Dept of Chemistry, Annada College Hazaribagh, (Vinoba Bhave University, Hazaribagh)
[16] PerkinElmer and Inc, “Optima 7300 V ICP OES SpectrometersBrochure,”Accessed:Nov.24,2021. [Online].Available:www.perkinelmer.com/optima.
[14] PerkinElmer, “Concepts, Instrumentation and Techniques in Inductively Coupled Plasma Optical Emission Spectrometry,” Accessed: Nov. 24, 2021. [Online].Available:www.perkinelmer.com.
[17] P. Life and A. Sciences, “Concepts,Instrumentation and Techniques in Inductively Coupled Plasma Optical Emission Spectroscopy,” Emiss. Spectrosc., pp.1 22,2004.
[15] “PreparingYourLaboratoryfortheOptima7300V and8300ICP OESSpectrometers1SuitableWorking Area.”
[18] I.Aydin,U.Yuksel,R.Guzel,B.Ziyadanogullari,andF. Aydin,“DeterminationoftraceelementsinTurkish wines byICP OESandHG ICP OES,”At.Spectrosc., vol.31,no.2,pp.67 71,2010.
[20] “TABLE 1 SUMMARY OF THE EPA NATIONAL RECOMMENDED AQUATIC LIFE CRITERIA FOR ALUMINUMEPAaquaticlifecriteriaforaluminum,” Accessed: Nov. 26, 2021. [Online]. Available: http://www.epa.gov/dockets.