International Research Journal of Engineering and Technology (IRJET)
e-ISSN: 2395-0056
Volume: 08 Issue: 10 | Oct 2021
p-ISSN: 2395-0072
www.irjet.net
Analysis of Rainfall Variation and Groundwater Level in Mysuru Taluk using GIS Madhura1, Kruthika S2, M. Greeshma Unnathishri3, Jeevan Satwik S K4 and Chandrashekar B5 1Student,
Department of Environmental Engineering, JSS STU, Karnataka, India Department of Environmental Engineering, JSS STU, Karnataka, India 3Student, Department of Environmental Engineering, JSS STU, Karnataka, India 4Student, Department of Environmental Engineering, JSS STU, Karnataka, India 5Assistant Professor, Department of Environmental Engineering, JSS STU, Karnataka, India ---------------------------------------------------------------------***---------------------------------------------------------------------2Student,
Abstract - Precipitation is the water released from clouds in various forms. It is the primary connection in the water cycle that provides for the delivery of atmospheric water to the Earth. Rise in temperature results in increase in the evaporation of surface water bodies & transpiration in wetlands. The aim is to analyze the rainfall variation and groundwater table fluctuation in the study area through GIS. Groundwater level data provides direct value of groundwater occurrences below ground level (bgl). We evaluated 5 rain gauge stations data of 10 years (2011-20) in determining the rainfall fluctuation; while 9 observations well points are considered to determine the groundwater table fluctuation in Mysore Taluk, Karnataka, India. We have used QGIS and ArcGIS for the analysis of seasonal variation of rainfall and groundwater for ten years (2011-2020) data. Key Words: Rain gauge stations, Groundwater monitoring stations, GIS, Inverse Distance weighted (IDW) and Thiessen polygon method. 1. INTRODUCTION
Water is an inorganic, transparent, tasteless, odourless, and nearly colourless chemical substance, which is the main constituent of Earth's hydrosphere and the component of all known living organisms in which it acts as a solvent. Groundwater is the readily available fresh water resource used for drinking, agricultural and industrial purposes. Its availability depends on rainfall and recharge. As India is a monsoon reliant country for its major portion of rainfall, it is necessary to analyse the occurrence and distribution of rainfall. In this regard, a detailed study of annual and seasonal variation of rainfall is done using GIS. 10 years (2011 to 2020) rainfall data from 5 representative Rain gauge stations have been collected and analysed for its variation. QGIS software has been used for rainfall trend analysis with the aid of various interpolations and ArcGIS for spatial distribution of groundwater trends and Inverse Distance Weighted (IDW) method.
© 2021, IRJET
|
Impact Factor value: 7.529
|
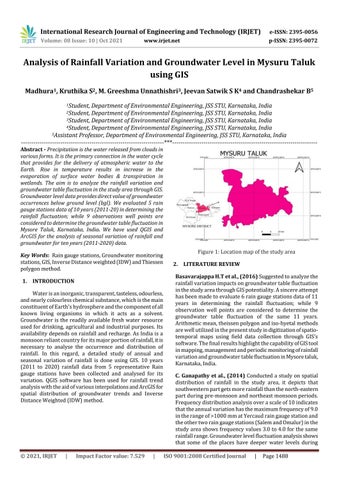
Figure 1: Location map of the study area 2. LITERATURE REVIEW Basavarajappa H.T et al., (2016) Suggested to analyze the rainfall variation impacts on groundwater table fluctuation in the study area through GIS potentiality. A sincere attempt has been made to evaluate 6 rain gauge stations data of 11 years in determining the rainfall fluctuation; while 9 observation well points are considered to determine the groundwater table fluctuation of the same 11 years. Arithmetic mean, theissen polygon and iso-hyetal methods are well utilized in the present study in digitization of spatiotemporal maps using field data collection through GIS’s software. The final results highlight the capability of GIS tool in mapping, management and periodic monitoring of rainfall variation and groundwater table fluctuation in Mysore taluk, Karnataka, India. C. Ganapathy et al., (2014) Conducted a study on spatial distribution of rainfall in the study area, it depicts that southwestern part gets more rainfall than the north-eastern part during pre-monsoon and northeast monsoon periods. Frequency distribution analysis over a scale of 10 indicates that the annual variation has the maximum frequency of 9.0 in the range of >1000 mm at Yercaud rain gauge station and the other two rain gauge stations (Salem and Omalur) in the study area shows frequency values 3.0 to 4.0 for the same rainfall range. Groundwater level fluctuation analysis shows that some of the places have deeper water levels during ISO 9001:2008 Certified Journal
|
Page 1488