International Research Journal of Engineering and Technology (IRJET)
e-ISSN: 2395-0056
Volume: 07 Issue: 03 | Mar 2020
p-ISSN: 2395-0072
www.irjet.net
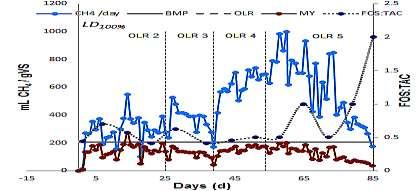
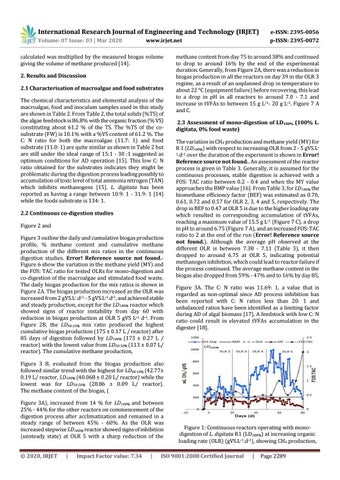
calculated was multiplied by the measured biogas volume giving the volume of methane produced [14]. 2. Results and Discussion 2.1 Characterisation of macroalgae and food substrates The chemical characteristics and elemental analysis of the macroalgae, food and inoculum samples used in this study are shown in Table 2. From Table 2, the total solids (%TS) of the algae feedstock is 86.8% with the organic fraction (% VS) constituting about 61.2 % of the TS. The %TS of the cosubstrate (FW) is 10.1% with a %VS content of 61.2 %. The C: N ratio for both the macroalgae (11.7: 1) and food substrate (11.0: 1) are quite similar as shown in Table 2 but are still under the ideal range of 15:1 - 30 :1 suggested as optimum conditions for AD operation [15]. This low C: N ratio obtained for the substrates indicates they might be problematic during the digestion process leading possibly to accumulation of toxic level of total ammonia nitrogen (TAN) which inhibits methanogens [15]. L. digitata has been reported as having a range between 10.9: 1 - 31.9: 1 [14] while the foods substrate is 134: 1. 2.2 Continuous co-digestion studies Figure 2 and Figure 3 outline the daily and cumulative biogas production profile, % methane content and cumulative methane production of the different mix ratios in the continuous digestion studies. Error! Reference source not found.Figure 6 show the variation in the methane yield (MY) and the FOS: TAC ratio for tested OLRs for mono-digestion and co-digestion of the macroalgae and stimulated food waste. The daily biogas production for the mix ratios is shown in Figure 2A. The biogas production increased as the OLR was increased from 2 gVS.L-.d-1 - 5 gVS.L-1.d-1, and achieved stable and steady production, except for the LD100% reactor which showed signs of reactor instability from day 60 with reduction in biogas production at OLR 5 gVS L-1 d-1. From Figure 2B, the LD90:10% mix ratio produced the highest cumulative biogas production (175 ± 0.17 L / reactor) after 85 days of digestion followed by LD100% (173 ± 0.27 L / reactor) with the lowest value from LD50:50% (113 ± 0.07 L/ reactor). The cumulative methane production,
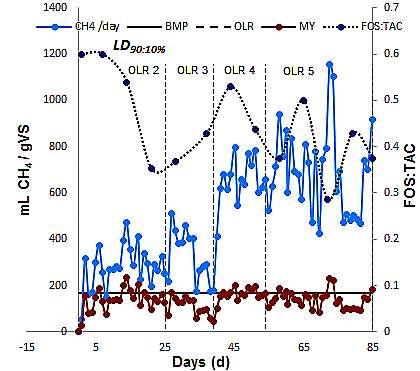
methane content from day 75 to around 38% and continued to drop to around 16% by the end of the experimental duration. Generally, from Figure 2A, there was a reduction in biogas production in all the reactors on day 39 in the OLR 3 regime, as a result of an unplanned drop in temperature to about 22 °C (equipment failure) before recovering, this lead to a drop in pH in all reactors to around 7.0 - 7.1 and increase in tVFAs to between 15 g L-1- 20 g L-1, Figure 7 A and C. 2.3 Assessment of mono-digestion of LD100% (100% L. digitata, 0% food waste) The variation in CH4 production and methane yield (MY) for R 1 (LD100%) with respect to increasing OLR from 2 - 5 gVS.L1.d-1 over the duration of the experiment is shown in Error! Reference source not found.. An assessment of the reactor process is given in Table 3. Generally, it is assumed for the continuous processes, stable digestion is achieved with a FOS: TAC ratio between 0.2 - 0.4 and when the MY value approaches the BMP value [16]. From Table 3, for LD100% the biomethane efficiency factor (BEF) was estimated as 0.70, 0.61, 0.72 and 0.57 for OLR 2, 3, 4 and 5, respectively. The drop in BEF to 0.47 at OLR 5 is due to the higher loading rate which resulted in corresponding accumulation of tVFAs, reaching a maximum value of 15.5 g L-1 (Figure 7 C), a drop in pH to around 6.75 (Figure 7 A), and an increased FOS: TAC ratio to 2 at the end of the run (Error! Reference source not found.). Although the average pH observed at the different OLR is between 7.38 - 7.11 (Table 3), it then dropped to around 6.75 at OLR 5, indicating potential methanogen inhibition, which could lead to reactor failure if the process continued. The average methane content in the biogas also dropped from 59% - 47% and to 16% by day 85, Figure 3A. The C: N ratio was 11.69: 1, a value that is regarded as non-optimal since AD process inhibition has been reported with C: N ratios less than 20: 1 and unbalanced ratios have been identified as a limiting factor during AD of algal biomass [17]. A feedstock with low C: N ratio could result in elevated tVFAs accumulation in the digester [18].
Figure 3 B, evaluated from the biogas production also followed similar trend with the highest for LD90:10% (42.77± 0.19 L/ reactor, LD100% (40.068 ± 0.20 L/ reactor) while the lowest was for LD50:50% (28.86 ± 0.09 L/ reactor). The methane content of the biogas, ( Figure 3A), increased from 14 % for LD100% and between 25% - 44% for the other reactors on commencement of the digestion process after acclimatization and remained in a steady range of between 45% - 60%. As the OLR was increased stepwise LD100% reactor showed signs of inhibition (unsteady state) at OLR 5 with a sharp reduction of the © 2020, IRJET
|
Impact Factor value: 7.34
|
Figure 1: Continuous reactors operating with monodigestion of L. digitata R1 (LD100%) at increasing organic loading rate (OLR) (gVS.L-1.d-1), showing CH4 production,
ISO 9001:2008 Certified Journal
|
Page 2289