14 minute read
Analysis of Process Parameters

International Research Journal of Engineering and Technology (IRJET) e-ISSN: 2395-0056 Volume: 07 Issue: 03 | Mar 2020 www.irjet.net p-ISSN: 2395-0072
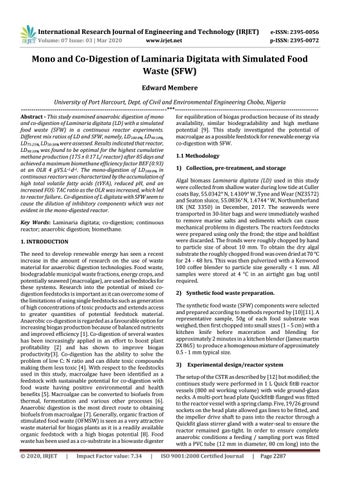
MY, BMP (mL CH4/ gVS), and FOS: TAC ratio.Vertical dashed line indicates change inOLR.
Advertisement
Table 2 Characteristics of inoculum, macroalgae, and food used for continuous processes.
* Not assessed
Characteristics
% TS % VS (% TS) % Moisture TKN (g/kg) Ammonia (g/L) Protein %TS
Alkalinity (g CaCO3/l) TVFAs (g/L) % C (% TS) % H% (% TS) % N% (% TS) % S (%TS) % O (% TS) % Ash content % TOC C: N C:S Inoculum
25.6(0.11) 51.8 (0.08) * * 1.76 (0.05) *
10.5 (0.03) 3.40 (0.16)
7.4 (0.19) Macroalgae 86.8(0.03) 61.2 (0.07) 13.3(0.10) 5.0 (0.18) 1.68(1.10) 2.7 (0.18)
* * 24.4 (0.36) 5.0 (0.02) 2.1 (0.44) 0.6 (0.15) 38.1(0.02) 29.8 (0.01) 29.5(0.05) 11.7:1 (0.21) 40.7:1 (0.11) Food
10.1(0.07) 94.3(0.12) 89.9 (0.08) 2.0(0.22) 0.42 (0.59) 1.23 (0.45)
* * 40.2(0.30) 7.1 (0.13) 3.7 (0.85) 0.3 (0.02) 40.7(0.15) 8.0 (0.18) 5.3(0.17) 11.0:1 (0.07) 134:1 (0.19)
Table 3 Performance characteristics of the continuous reactors R1 - R4
OLR (kg VS / L / d) BMP (L CH4 / kg VS) SMY (L CH4 / kg VS) Bio-methane efficiency factor (BEF)
R 1 LD100% (100% L. Digitata, 0% Food waste)
OLR 2 207 ± 0.07 143.99 0.86
OLR 3 126.55 0.76
OLR 4 OLR 5 148.36 118.96 0.89 0.71
R2 LD90:10% (90% L. Digitata, 10% Food waste)
OLR 2 167 ± 1.54 139.97 0.84
OLR 3 OLR 4 OLR 5 112.56 155.86 138.09 0.67 0.93 0.83
R3 LD75:25% (75% L. Digitata, 25% Food waste)
OLR 2 174.31 ± 1.24 132.05 0.76
OLR 3 OLR 4 108.35 127.48 0.62 0.73
OLR 5 121.49 0.70
R4 LD50:50% (50% L. Digitata, 50% Food waste)
OLR 2 115.31 ± 0.43 102.86 0.89
OLR 3 79.02 0.69
OLR 4 OLR 5 98.90 92.28 0.85 0.80 CH4 (%) HRT (days) FOS: TAC TAN
59.86 57.2 52.97 47.87 25 13 16 31
61.11 58.18 56.17 52.3 25 13 16 31
65.48 57.52 55.18 52.99 25 13 16 31
67.43 62.29 56.51 55.21 25 13 16 31 0.42 0.51 0.47 1
0.41 0.40 0.48 0.39
0.28 0.4 0.43 0.43
0.28 0.33 0.38 0.66 1.43 1.12 1.07 0.7
1.53 1.17 1.24 0.89
1.42 1.09 0.98 0.74
1.23 1.11 0.91 0.79 PH
7.38 7.36 7.34 7.11
7.41 7.38 7.41 7.46
7.39 7.37 7.38 7.42
7.37 7.29 7.31 7.32
International Research Journal of Engineering and Technology (IRJET) e-ISSN: 2395-0056 Volume: 07 Issue: 03 | Mar 2020 www.irjet.net p-ISSN: 2395-0072
Figure 2:Continuous reactors operating with different co-digestion mixtures; A), Daily biogas production; B), Cumulative biogas production.
LD100:0% LD90:10% LD75:25% LD50:50%
International Research Journal of Engineering and Technology (IRJET) e-ISSN: 2395-0056 Volume: 07 Issue: 03 | Mar 2020 www.irjet.net p-ISSN: 2395-0072
Figure 3:Continuous reactors operating with different co-digestion mixtures; A), % Methane; B), Cumulative methane production. reduced from 61% -52% as the OLR was increased.
2.4 Assessment of co-digestion of LD90:10 % (90% L. digitata, 10% food waste)
Reactor R2, operating with feeding regime LD90:10% , fluctuated from 221 mL CH4 gVS-1 on day 74 to 121 mL CH4
contained the lowest feed component of food waste among the mixed ratio reactors (R2 –R4), and produced both the highest cumulative biogas and methane content (Figure 2A and
Figure 3 B). This enhanced efficiency can be attributed to acclimatizationof the reactor sludge microorganisms to the food waste and macroalgalbiomassco-digestion feedstock. Synergy can be brought about by improved and balanced C: N ratio, which can be achieved by blending feedstock components, preventing ammonia inhibition, and by improving the bioavailability of nutrients[19],and this could High buffering results in less accumulation of tVFA at increased OLR. The % methane content in the biogas
The maximum tVFA concentration of 6.6 g L-1 was obtained on day 79 at an OLR of 5 gVS.L-1.d-1(Figure 7C). At this tVFA concentration, reduction in methane yield was evident (Figure 4), but not sufficient to cause failure, and the MY be attributed forthe performance of R2.
gVS-1 on day 75 and, continued in this trend before recovering on day 80, (Figure 4). It is generally accepted that the performance of an AD process has a direct correlation with concentration of the tVFA [18], and above 6 g L-1, both biogas and the ratio of methane to CO2 produced is greatly inhibited [22].
Figure 4shows the variation in CH4 production together with the MY and FOS: TAC ratio. The co-digestion process operated steadily, with increase in methane yield occurring as the OLRwas increased, with OLR 4gVS.L-1.d-1 producing the highest MY yield close to the BMP value (Table 3). Under these conditions the process was efficient in biogas production, and was operationally stable, with only short period of reactor instability during the first 10 days, since the FOS: TAC ratio fluctuated between 0.1 -.0.6 throughout duration of the experiment. Although stable digestion is characterized by FOS: TAC ratio of ≤ 0.4 or given as ≤ 0.3, between 0.3 - 0.8 indicates risk of instability and ≥ 0.8 suggests instability [20]. This demonstrates better performance of LD90:10% compared to LD100%, which failed at OLR 5 g VS L-1 d-1 with a FOS: TAC > 0.8. The bio-methane efficiency factor (BEF) obtained at OLR 2, OLR 3, OLR 4 and OLR 5 were 0.84, 0.67, 0.93, and 0.83 respectively(Table 3). At OLR 4, the average BEF value of 0.93 was close to maximum, signifying an acclimatized inoculum and better performance of the reactor. The average pH was between 7.41 - 7.46 over the OLR tested, which probably resulted from good ammonia buffering capacity in the reactor[21].
Figure 4: Continuous reactors operating with co-digestion of L.digitata R2 (LD90:10%) at increasing organic loading rate (OLR) (gVS.L-1.d-1), showing CH4 production, MY, BMP (mL CH4/ gVS), and FOS: TAC8ratio. Vertical dashed line indicates change in OLR.
International Research Journal of Engineering and Technology (IRJET) e-ISSN: 2395-0056 Volume: 07 Issue: 03 | Mar 2020 www.irjet.net p-ISSN: 2395-0072
2.5 Assessment of co-digestion of LD75:25 % (75% L. digitata, 25% food waste)
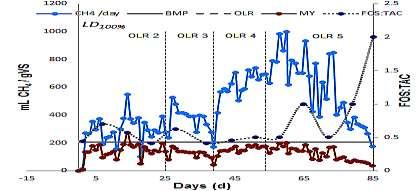
The continuous fermentation data of R 3 LD75:25 % are shown in Figure 5 and Table 3. The methane production rate fluctuated from an average value of 132 mL CH4 gVS-1.d-1 to 122 mL CH4 gVS-1.d-1, which coincided with an increase in OLR from 2 g VS.L-1.d-1 - 5 g VS.L-1.d-1 over 85 days of operation. Figure 2 B shows the cumulative biogas production for LD75:25 % was 156 ± 9.20L biogas, while
Figure3Bshows the cumulative methane production was 38 ±1.72 L CH4. These are less by 11% and 5.6%, respectively, compared to the cumulative biogas and methane produced for LD100% with no co-digestion mix. Comparing LD75:25 % to LD100 %, it is evident that the former performed better because it continued to producebiogas after day 75 with no sign of instability or reactor failure, as experienced in LD100%. From Table 3, Reactor R3 BEF was 0.76, 0.62, 0.73 and 0.70 at OLR 2, OLR 3, OLR 4 and OLR 5, respectively. The average pH ranged between 7.39 – 7.42. The FOS: TAC ratio fluctuated only slightly (0.28 - 0.43) as the OLR was increased, indicating good stability of the process.
The average % methane concentration of the biogas in LD75:25 % reactor was highest (66%) at OLR 2 and lowest (53%) at OLR 5,
Figure 3 B. This decreasing trend was reflected in average MY value of 132 mL CH4gVS-1, 128 mL CH4gVS-1and 122 mL CH4 gVS-1 for OLR 2, OLR 4 and OLR 5, respectively, except OLR 3 with 108 mL CH4 gVS-1 which experienced drop in temperature from 35 °C to around 22 °C on day 39, hence the low average MY obtained for OLR 3.
Figure 5Continuous reactors operating with co-digestion of L.digitata R3 (LD75:25%) at increasing organic loading rate (OLR) (gVS.L-1.d-1), showing CH4 production, MY, BMP (mL CH4/ gVS), and FOS: TAC ratio. Vertical dashed line indicates change in OLR.
2.6 Assessment of co-digestion of LD50:50% (50% L. digitata, 50% food waste)
Reactor R 4 had a feedstock mixture LD50:50% consisting of equal amount of L. digitata and food waste. During continuous operation, the cumulative biogas and methane production were 113 ± 2.43 L biogas and 29 ± 2.01 LCH4, respectively, (Figure 2B and
Figure 3B).

Figure 6Continuous reactors operating with co-digestion of L.digitata R4 (LD50:50%) at increasing organic loading rate (OLR) (gVS.L-1.d-1), showing CH4 production, MY, BMP (mL CH4/ gVS), and FOS: TAC ratio. Vertical dashed line indicates change in OLR.
The MY were 103 mL CH4gVS-1, 79 mL CH4gVS-1, 99 mL CH4 gVS-1, 93 mL CH4 gVS-1 at OLR 2, OLR 3, OLR 4 and OLR 5, respectively (Figure 6). Comparing LD50:50% to the monodigested reactor (LD100%), at OLR 5 it continued to produce gas with no sign of the instability that was experienced in LD100%. Nutrients supplemented from the food waste and better acclimatization of the microbial community to the mixed feedstock at the higher OLR were considered the main reasons for the high stability of reactor R4.
The % methane composition in the biogas continued to decline slightly as the OLR was increased stepwise, from 67% at OLR2, 62% at OLR 3, 56% at OLR 4 and to 55% at OLR 5, (Table 3). The BEF was 0.89 at the initial OLR 2 after 25 days within the first HRT, but dropped to 0.69 at OLR 3, and improved again to 0.85 at OLR 4. Similar stable pH trend (7.37 - 7.32) was observed, as seen in other co-digestion mixture ratios (LD90:10%, and LD75:25%), with the exception of LD100% (7.38 -6.75). The FOS: TAC ratio increased from 0.4 –1.0 indicating reactor imbalance at OLR 5 feeding regime but declined to 0.5 before the end of the 3.5 HRT period. This normalised the instability in the reactor which was reflected by the recovery and continuous production of biogas from day 75, (Figure 6). There was no tVFA accumulation which averaged between 2.6 g. L-1 -2.3 g. L-1(Figure 7).
International Research Journal of Engineering and Technology (IRJET) e-ISSN: 2395-0056 Volume: 07 Issue: 03 | Mar 2020 www.irjet.net p-ISSN: 2395-0072
2.7 Comparison of LD100% with other reactors
LDLD%: FW% mix
Process operational parameters: pH, VFA, and FOS: TAC ratio
The pH of all the co-digested mixture reactors (LD90:10%, LD75:25%, and LD50:50%) fluctuated between 7.60 - 7.20, compared to the mono-digested reactor (LD100%), which started to drop sharply from 7.10 on day 78 to 6.65 by day 85, (Figure 7A). pH is regarded as one of the critical indicators for digester performance because it promotes favorable conditions for growth of microorganisms and determines the overall performance of anaerobic digesters [23],Optimum pHrange has been suggested as between 6.8 – 7.2 for methanogens and the VFA produced in the acidogenesis phase can induce a drop in pH[24].The LD100% reactorproduced the highest tVFA which increased from 2.7 gL-1-15.5 g L-1 as the OLR increased from 2gVS.L-1. d-1 –5 gVS.L-1.d-1, this was followed by LD90:10% (3.3gL-1–6.6 gL-1), LD75:25% (2.6gL-1 –2.3gL-1), with the lowest being LD50:50% (1.7gL-1 –2.21gL-1). Accumulated levels of undissociated VFA cause the greatestdetrimental effects on AD process by allowing VFA to penetrate cell membranes and damage intracellular macromolecules [25]. Consequently, a VFA range of 2.0gL-1–3.0gL-1 is regarded as the optimum level for metabolic activity[26].At OLR 5gVS.L-1.d-1, for LD100% a maximum VFA concentration of 15.5 g L-1 contributed to reactor failure, while at the maximum concentration of 6.63 g L-1 for LD90:10% it caused low gas production at the same loading rate. As can be seen from Figure 7C, on day 39 there was an increase in VFA concentration in all reactors to between (14g L-1 -21g L-1) with a corresponding decrease in pH (to 7.0 -7.1). This was due to an unplanned drop in
Figure 7Performance indicators in reactors fed with different co-digestionmixtures, (A), pH; (B), FOS: TAC ratio; (C), Total volatile fatty acid (tVFA)
Reactortemperature to around 22 °C, caused by equipment failure. Once back at normal temperature, performance recovered again. The temperature of the reactors plays a critical role for the AD microorganisms as the conversion of acetic acid to methane is highly temperature dependent[26].
The FOS: TAC ratio showed the largest increase for LD100%, reaching up to 2 at OLR 5. The other co-digested mixture reactors were all within the stable digestion ratio of 0.2 -0.5, except for LD50:50% which showed transient signs of instability with a FOS: TAC ratio of 1 at OLR 5, before normalising.
3. CONCLUSION
Continuous reactor studies were carried out using monoLD100:0% , andco-digestion of L. digitata macroalgal biomass with food waste at several mixture ratios. The LD90:10% was found to be optimal for the highest cumulative methane production after 85 days of fermentation when the OLR was
International Research Journal of Engineering and Technology (IRJET) e-ISSN: 2395-0056 Volume: 07 Issue: 03 | Mar 2020 www.irjet.net p-ISSN: 2395-0072
“The steady state anaerobic digestion of Laminaria Bioresour. Technol., vol. 143, pp. 221–230, 2013.
increased step-wise. The continuous mono-digestion of LD100% was characterisedby the accumulation of high tVFA and an increased FOS: TAC ratio as the OLR was increased, leading to reactor failure. This study shows that co-digestion has inherent advantages when using L. digitata macroalgal biomass as feedstock, making it the preferred option for long-term continuous digestion. Synergy and beneficial effects were observed with co-digestion mixturefeedstocks, which enhanced continuous gas production at high loading.
ACKNOWLEDGEMENT
The author thank the Tertiary Educational trust fund (TETFUND), Nigeriafor sponsorship.
REFERENCES
[1]
[2]
[3]
[4]
[5] C. Mao, T. Zhang, X. Wang, Y. Feng, G. Ren, and G. Yang, “Process performance and methaneproduction optimizing of anaerobic co-digestion of swine sampling bags with macroalgae feedstock,” Biomass
manure and corn straw,” Sci. Rep., vol. 7, no. 1, pp. 1–9, 2017.
I. Angelidaki, L. Ellegaard, and B. K. Ahring, “A comprehensive model of anaerobic bioconversion of nitrogenous substrates,” Environ. Technol., vol. 34,
complex substrates to biogas,” Biotechnol. Bioeng., vol. 63, no. 3, pp. 363–372, 1999.
T. Xie, S. Xie, M. Sivakumar, and L. D. Nghiem, “Relationship between the synergistic/antagonistic produce gaseous biofuel,” Bioresour. Technol., vol.
effect of anaerobic co-digestion and organic loading,” Int. Biodeterior. Biodegradation, vol. 124, pp. 155–161, 2017.
B. Sialve, N. Bernet, and O. Bernard, “Anaerobic microalgal biodiesel sustainable.,” 2009. M. Cogan and B. Antizar-Ladislao, “The ability of macroalgae to stabilise and optimise the anaerobic digestion of household food waste,” Biomass and Bioenergy, vol. 86, pp. 146–155, 2016. [10]
[11]
[12]
[13]
[14]
[15]
[16]
[17] Y. Li, Y. Jin, A. Borrion, H. Li, and J. Li, “Effects of organic composition on the anaerobic biodegradability of food waste,” Bioresour. Technol., vol. 243, pp. 836–845, 2017.
J.Mata-Alvarez, S. Macé, and P. Llabres, “Anaerobic digestion of organic solid wastes. An overview of research achievements and perspectives,” Bioresour. Technol., vol. 74, no. 1, pp. 3–16, 2000.
J. Hinks, S. Edwards, P. J. Sallis, and G. S. Caldwell, hyperborea–Effect of hydraulic residence on biogas production and bacterial community composition,”
R. Nandi, C. K. Saha, and M. M. Alam, “Effect of Mixing on Biogas Production from Cowdung,” no. Febr., 2017.
M. Edward, S. Edwards, U. Egwu, and P. Sallis, “Biomethane potential test (BMP) using inert gas and Bioenergy, 2015.
E. Allen, J. D. Browne, and J. D. Murphy, “Evaluation of the biomethane yield from anaerobic co-digestion of no. 13–14, pp. 2059–2068, 2013.
E. Allen, D. M. Wall, C. Herrmann, and J. D. Murphy, “Investigation of the optimal percentage of green seaweed that may be co-digested with dairy slurry to digestion of microalgae as a necessary step to make
170, pp. 436–444, 2014.
M. J. Fernández -Rodríguez, B. Rincón, F. G. Fermoso, A. M. Jiménez, and R. Borja, “Assessment of twosource,” Bioresour. Technol., vol. 114, pp. 281–286, phase olive mill solid waste and microalgae codigestion to improve methane production and process kinetics,” Bioresour. Technol., vol. 157, pp. 263–269, 2014.
[6]
[7]
[8]
[9] M. E. Montingelli, S. Tedesco, and A. G. Olabi, “Biogas production from algal biomass: A review,” Renew. Sustain. Energy Rev., vol. 43, pp. 961–972, 2015.
A. D. Hughes, M. S. Kelly, K. D. Black, and M. S. Stanley, “Biogas from Macroalgae: is it time to revisit microalgae through co-digestion with carbon-rich
the idea?,” Biotechnol. Biofuels, vol. 5, no. 1, p. 86, 2012.
H. Hartmann and B. K. Ahring, “Anaerobic digestion of the organic fraction of municipal solid waste: influence of co-digestion with manure,” Water Res., start-up and operation of CSTR biogas processes,” in
vol. 39, no. 8, pp. 1543–1552, 2005.
S. E. Nayono, C. Gallert, and J. Winter, “Foodwaste as a co-substrate in a fed-batch anaerobic biowaste digester for constant biogas supply,” Water Sci. [18]
[19]
[20] W. Zhong, Z. Zhang, Y. Luo, W. Qiao, M. Xiao, and M. Zhang, “Biogas productivity by co-digesting Taihu blue algae with corn straw as an external carbon 2012.
C. Herrmann, N. Kalita, D. Wall, A. Xia, and J. D. Murphy, “Optimised biogas production from co-substrates,” Bioresour. Technol., vol. 214, pp. 328–337, 2016.
A. Schnürer, I. Bohn, and J. Moestedt, “Protocol for Technol., vol. 59, no. 6, pp. 1169–1178, 2009.
Hydrocarbon and Lipid Microbiology Protocols, Springer, 2016, pp. 171–200.