4 minute read
Inoculum and operation


International Research Journal of Engineering and Technology (IRJET) e-ISSN: 2395-0056 Volume: 07 Issue: 03 | Mar 2020 www.irjet.net p-ISSN: 2395-0072
reactor vessel through one 19/26 sockets on the head plate to reach below the liquid level. Vacuum grease (Dow Corning, USA) was used to maintain the integrity of all ground glass seals and sockets pots not used were sealed with glass 19/26 stoppers. Mixingwas achieved with a 40 × 80mm rectangular impeller rotating at 90 rpm.
Advertisement
Inoculum and operation
sludge from a full-scale running anaerobic digester (Cockle Park Farm, Newcastle) operating on grass silage. It had following characteristics; pH 7.50, 21.2% TS, 60% VS (%TS), 0.019 Sulphur and C: N of 0.061. The CSTRs were operated in semi-continuous batch mode, with daily feeding event being initiated by the removal of an appropriate volume (Reactor Volume/hydraulic residence) of mixed liquors from the feeding/sampling point on the head plate of the reactor using a 100 ml plastic syringe. Stirring continued during sampling to prevent settling and fractionation of the reactor solids[12]), and the importance of mixing the reactors for efficient substrate conversion has been reported by many researchers [13]. An experimentally determined quantity (expressed as dry weight (g VS / L) was made up to a specified volume of water (water volume dependent on hydraulic residence), to replace exactly the sample volume that had been removed from the reactor, and added manually through a head plate port. All samples were carried outin duplicate.
Experimental procedure
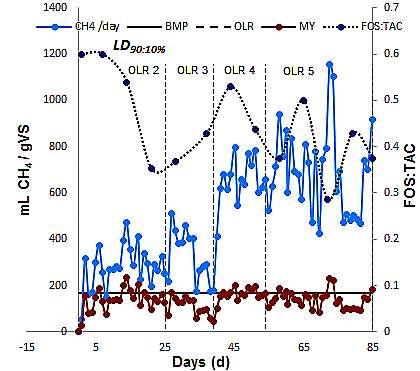
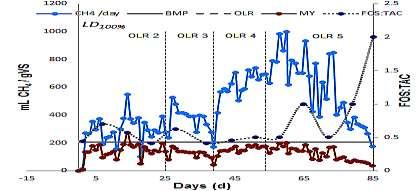
The continuous reactor study comprised a series of 4 identical, 1-litre continuous stirred tank reactors (CSTR) (R 1 -R 4) operating simultaneously for 85 days under different mix ratios (LD100 %, LD90:10%, LD75:25 %, and LD10:90 %,) but with the same daily feeding regime, with a hydraulic residence time of 25 days. The different mix ratios used for the reactors are given inTable 1.
Table 1 Ratios of LD with SFW used in both batch and continuous reactors study.
Ratios
Continuous reactors Algae 100: 0 SFW R 1
(LD100 %) Algae 90: 10 SFW R 2
(LD90:10 %) Algae 75: 25 SFW R 3
(LD75:25 %) Algae 50: 50 SFW R 4
(LD50:50 %)
The initial inoculum concentration was 10 gVS.L-1, and was pre-acclimatised with macroalgae (1 gVS) feedstock daily for 9 days, then degassed for 3 – 5 days before the start of experiment. The organic loading rate OLR (g VS.L-1 d-1) was increased stepwise after acclimatization from 2 g VS.L-1 d-1 on day 1 of the experiment to 3 g VS.L-1 d-1 on day 26, thereafter, to 4 g VS.L-1 d-1on day 39 and, finally to 5 g VS.L-1 d-1 on day 55, till the end of the experiment. Biogas production rate was measured daily.
6) Analysis of Process Parameters
pH and solids
The pH was measured daily from the removed liquors (reactor effluent) at each feeding event using a Jenway 3010 pH meter.
Elemental composition (CNS) analysis
The reactors were inoculated with a mixed methanogenic
Samples (dried, powdered; ca. 50 mg) were weighed accurately into ceramic crucibles and analysed for carbon, nitrogen and sulphur content using an Elementar VarioMAX CNS analyser. The analysis involves combustion at 1145°C in an oxygen-enriched helium atmosphere. Sulfadiazine (%N = 22.37; %C = 47.99; %S = 12.81) was used as the calibration standard and was analysed at the start and end of the sample sequence and after every 5 - 10 samples. Raw data were corrected for analytical drift (based on the calibration standard data) during the analysis using the Elementar software.
Volatile fatty acids (VFAs)
Volatile fatty acids (VFAs) was analysed on a Dionex ICS 1000 with an AS40 autosampler (Dionex, USA). Separation was carried out on an ionpac ICE-AS1 4 × 250 mm analytical column with a flow rate 16 ml min-1; 1.0mM heptafluorobutyric acid eluent; 5 mM tetrabutylammonium hydroxide suppressant regenerant; and a 10ul injection loop. Supernatant of centrifuged samples liquors were filtered through a 0.20 µl syringe filter (VWR, UK), 0.4 ml of filtered samples were then diluted 1:1 with octane sulfonicacid, and sonicated (FS200B Sonic Bath, Decon Laboratories, Sussex, UK) for 40 mins to remove carbonate, which caused interference. The prepared samples were then transferred to 1 ml tubes with filter caps (Dionex, USA) before analysis.
Biogas and methane measurement
The percentage (%) methane from the biogas content was determined using a GC-FID analyser (Carlo-Erba 5160 GC) in split mode withthe injector at 150°C and FID at 300°C.Using a 100 µl sample Lock syringe (Hamilton, USA), duplicate headspace samples (100ul) were injected manually every 2 minutes into the GC with the split open 5 turns (100mls min1). After the initial injection, theGC temperature programme and data acquisition commenced. Separation was performed on an HP-PLOT-Q capillary column (30m x 0.32mm id) packed with 20um Q phase. The GC was held isothermally at 35°C for 90min and heated to 250 °C at 10 °C min-1 and held at final temperature for 10 minutes with Helium as the carrier gas (flow 1ml min-1, pressure of 50kPa, split at 100mls min-1. The acquisition was stored on an Atlas laboratory data system. Methane standard were prepared prior to each analysis from 100% analytical grade CH4(BOC Gases, UK) by injecting duplicate sample to make a five–point standard curve in the range 20 - 100% CH4. The volume of biogas produced was measured using a 100 ml BD Plastipak syringe from the gas bags. The % methane