International Research Journal of Engineering and Technology (IRJET) Volume: 06 Issue: 10 | Oct 2019 www.irjet.net
e-ISSN: 2395-0056 p-ISSN: 2395-0072
Analysis of Boston’s Crime Data using Apache Pig V.C Chandra Kishore1, Aditya Shekhar Camarushy2 1New
Horizon College of Engineering, Bengaluru, Karnataka, India Institute of Technology, Manipal, Karnataka, India -----------------------------------------------------------------------***-----------------------------------------------------------------------2Manipal
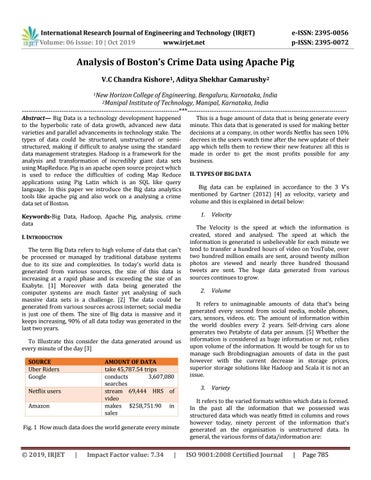
Abstract— Big Data is a technology development happened to the hyperbolic rate of data growth, advanced new data varieties and parallel advancements in technology stake. The types of data could be structured, unstructured or semistructured, making if difficult to analyse using the standard data management strategies. Hadoop is a framework for the analysis and transformation of incredibly giant data sets using MapReduce. Pig is an apache open source project which is used to reduce the difficulties of coding Map Reduce applications using Pig Latin which is an SQL like query language. In this paper we introduce the Big data analytics tools like apache pig and also work on a analysing a crime data set of Boston. Keywords-Big Data, Hadoop, Apache Pig, analysis, crime data I. INTRODUCTION The term Big Data refers to high volume of data that can't be processed or managed by traditional database systems due to its size and complexities. In today’s world data is generated from various sources, the size of this data is increasing at a rapid phase and is exceeding the size of an Exabyte. [1] Moreover with data being generated the computer systems are much faster yet analysing of such massive data sets is a challenge. [2] The data could be generated from various sources across internet; social media is just one of them. The size of Big data is massive and it keeps increasing, 90% of all data today was generated in the last two years. To Illustrate this consider the data generated around us every minute of the day [3] SOURCE Uber Riders Google
AMOUNT OF DATA take 45,787.54 trips conducts 3,607,080 searches stream 69,444 HRS of video makes $258,751.90 in sales
Netflix users Amazon
Fig. 1 How much data does the world generate every minute
© 2019, IRJET
|
Impact Factor value: 7.34
|
This is a huge amount of data that is being generate every minute. This data that is generated is used for making better decisions at a company, in other words Netflix has seen 10% decrees in the users watch time after the new update of their app which tells them to review their new features: all this is made in order to get the most profits possible for any business. II. TYPES OF BIG DATA Big data can be explained in accordance to the 3 V’s mentioned by Gartner (2012) [4] as velocity, variety and volume and this is explained in detail below: 1.
Velocity
The Velocity is the speed at which the information is created, stored and analysed. The speed at which the information is generated is unbelievable for each minute we tend to transfer a hundred hours of video on YouTube, over two hundred million emails are sent, around twenty million photos are viewed and nearly three hundred thousand tweets are sent. The huge data generated from various sources continues to grow. 2.
Volume
It refers to unimaginable amounts of data that's being generated every second from social media, mobile phones, cars, sensors, videos. etc. The amount of information within the world doubles every 2 years. Self-driving cars alone generates two Petabyte of data per annum. [5] Whether the information is considered as huge information or not, relies upon volume of the information. It would be tough for us to manage such Brobdingnagian amounts of data in the past however with the current decrease in storage prices, superior storage solutions like Hadoop and Scala it is not an issue. 3.
Variety
It refers to the varied formats within which data is formed. In the past all the information that we possessed was structured data which was neatly fitted in columns and rows however today, ninety percent of the information that's generated an the organisation is unstructured data. In general, the various forms of data/information are:
ISO 9001:2008 Certified Journal
|
Page 785