International Research Journal of Engineering and Technology (IRJET)
e-ISSN: 2395-0056
Volume: 05 Issue: 12 | Dec 2018
p-ISSN: 2395-0072
www.irjet.net
A Literature Survey on Heart Rate Variability and its Various Processing and Analyzing Techniques Miss Priyanka Mayapur1 1B.E
Student, Dept. Of Electronics and Communications Engineering, Agnel Institute of Technology and Design, Assagao, Goa, India1 ----------------------------------------------------------------------***---------------------------------------------------------------------
Abstract – Human heart being the electro-mechanical
The R-Peak is considered to be the most important fiducial point in the signal due to its larger amplitude and proper detection of the R-Peak is said to have a major contribution in determining a fundamental feature called as the RR interval or the inter-beat interval (IBI), which is one of the strongest driving factor in analyzing an ECG signal. Among all these attributes, the most important entity used to determine the heart rate variability (HRV) is the R-R interval which is obtained by finding out the distance between one R-peak and the next R-peak (successive R’s).
pump supplies blood via a cardiovascular network. Its rhythmic beating gives rise to a pattern which when recorded can be used to find out the functionality of a heart. The diagnostic tool is called as Electrocardiogram (ECG) and its tracing contains a lot of attributes whose proper analysis may detect any cardiac peculiarity. Among them, is an entity called as the beat-to-beat interval (R-R interval). The analysis of beat to beat fluctuations of heart rate is known as heart rate variability (HRV) which is a concise marker to study the health of the heart along with a lot of measures clinically. This paper talks about the importance of the HRV and the various processing yet analysis techniques used to calculate the HRV by researchers.
The trace of an ECG consists of the following attributes as mentioned in the table: Table -1: Features in an ECG Signal
Key Words: ECG, Heart Rate, IBI, HRV, ANS
Waves/Peaks Segments Intervals
1. INTRODUCTION The human heart is a muscular organ that pumps blood through blood vessels via the network of cardiovascular system. The regular rhythmic beating is a result of the contraction and relaxation of the muscle tissue of the heart between 60 to 100 times per minute (BPM). The movement of ions constitutes the electrical signals which results in a combination of several consecutive cardiac cycles due to the depolarization and repolarization of the ions in the blood including a fairy period of waves, segments and intervals corresponding to the consecutive heart action phases. The representation of this electrical activity of the heart in exquisite detail is measured in terms of a diagnostic tool called as the Electrocardiogram (ECG) which was invented by Willem Einthoven in 1903 in Netherlands.
Complex & Points
P, Q, R, S, T, U PQ or PR, ST PQ or PR, R-R, P-P, QT, QU, TP, TQ J Point, QRS Complex
An efficient analysis of this parameter could help in accurate determination in the cardiovascular studies.
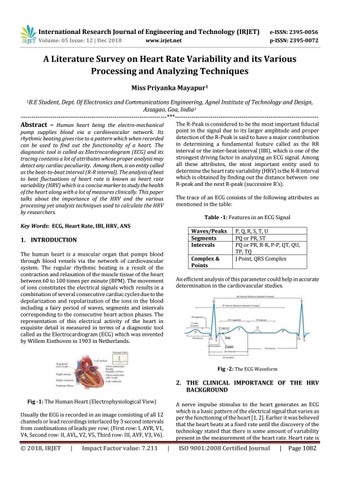
Fig -2: The ECG Waveform
2. THE CLINICAL IMPORTANCE OF THE HRV BACKGROUND Fig -1: The Human Heart (Electrophysiological View)
A nerve impulse stimulus to the heart generates an ECG which is a basic pattern of the electrical signal that varies as per the functioning of the heart [1, 2]. Earlier it was believed that the heart beats at a fixed rate until the discovery of the technology stated that there is some amount of variability present in the measurement of the heart rate. Heart rate is
Usually the ECG is recorded in an image consisting of all 12 channels or lead recordings interlaced by 3 second intervals from combinations of leads per row; (First row: I, AVR, V1, V4, Second row: II, AVL, V2, V5, Third row: III, AVF, V3, V6).
© 2018, IRJET
|
Impact Factor value: 7.211
|
ISO 9001:2008 Certified Journal
|
Page 1082