International Research Journal of Engineering and Technology (IRJET) Volume: 03 Issue: 08 | Aug-2016
www.irjet.net
e-ISSN: 2395-0056 p-ISSN: 2395-0072
GEOSTATISTICAL MODELING OF SOME PHOSPHATE DEPOSITS IN EGYPT H. A. Farag1, A. F. Ismael2, M. A. Gouda3 and S. M. Sleem4 1,2,3,4
Al-Azhar University, Faculty of Eng., Mining and Petrol. Dept., Nasr City, Cairo, Egypt
Email:hussinfarag@yahoo.com --------------------------------------------------------------------***--------------------------------------------------------------------Abstract- Geostatistical analysis plays an important role to GS+ (Geostatistics for the Environmental Sciences) software. study the mineralization behavior within the ore deposits. Variograms, as the first step in any geostatistical study, are constructed for P2O5% of three phosphate deposits near the River Nile of Egypt, namely; Um Salama, Um Hugara and Wadi El Shaghab areas. Also, the available data are analyzed statistically to show the distribution of P2O5% through the three areas. After fitting the variogram of each area to suitable variogram model, kriged model are established for each area.
Key Words: Geostatistics, kriging, GS+, Variogram, Um Salama, Um Hugara, Wadi El Shaghab 1. INTRODUCTION Geostatistics now plays a wider role in mining with matters such as the flow of methane in coal mines and the disposal of waste and its subsequent fate [1]. The variogram can be described as the variation in values among samples some distance apart as a measure of their spatial correlation [2]. Constructing of an experimental variogram is the first step in any geostatistical analysis. It can be computed from a set of randomly spaced data through finding pairs of data that are oriented in the required direction, determining the distance between the samples, then summing the squared differences of the grades and dividing by the number of pairs [3].
GS+ allows for user to readily measure and illustrate spatial relationships in geo-referenced data. Also, it can used to analyze spatial data for autocorrelation and then uses this information to make optimal, statistically rigorous maps of the area sampled [5]. Experimental variogram was constructed for each area to characterize the spatial variability of the measured P2O5% values depending on the available data. These data are x and y coordinates and P2O5% for each sample location area. Spherical and exponential variogram models were selected as more suitable fitted to the experimental variograms. Depending on the parameters of the variogram models for each area, ordinary kriging techniques was used to present distribution model of P2O5% which could be used in mine planning and production.
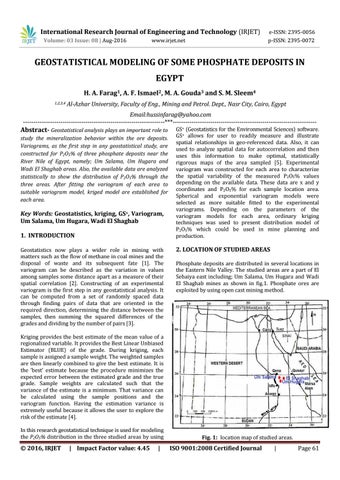
2. LOCATION OF STUDIED AREAS Phosphate deposits are distributed in several locations in the Eastern Nile Valley. The studied areas are a part of El Sebaiya east including; Um Salama, Um Hugara and Wadi El Shaghab mines as shown in fig.1. Phosphate ores are exploited by using open cast mining method.
Kriging provides the best estimate of the mean value of a regionalized variable. It provides the Best Linear Unbiased Estimator (BLUE) of the grade. During kriging, each sample is assigned a sample weight. The weighted samples are then linearly combined to give the best estimate. It is the ‘best’ estimate because the procedure minimizes the expected error between the estimated grade and the true grade. Sample weights are calculated such that the variance of the estimate is a minimum. That variance can be calculated using the sample positions and the variogram function. Having the estimation variance is extremely useful because it allows the user to explore the risk of the estimate [4]. In this research geostatistical technique is used for modeling the P2O5% distribution in the three studied areas by using
© 2016, IRJET
| Impact Factor value: 4.45
|
Fig. 1: location map of studied areas.
ISO 9001:2008 Certified Journal
|
Page 61