
International Research Journal of Engineering and Technology (IRJET) e-ISSN:2395-0056
Volume: 11 Issue: 07 | July 2024 www.irjet.net p-ISSN:2395-0072

International Research Journal of Engineering and Technology (IRJET) e-ISSN:2395-0056
Volume: 11 Issue: 07 | July 2024 www.irjet.net p-ISSN:2395-0072
Yashraj Mishra1, Ankita Jaiswal2, Dr. Goldi Soni3
1Student, Amity University Chhattisgarh
2Student, Amity University Chhattisgarh
3Assistant Professor, Amity University Chhattisgarh
Abstract - Human Activity Recognition (HAR) using smartphone data leverages built-in sensors to detect and classify users’ activities. The proliferation of smartphones with various sensors has opened new avenues for recognizing human activities, with significant noteworthy applicationsinremotehealthcareandactivitytracking for the elderly or disabled, and fitness monitoring. Recent studies focus on applications that identify daily track activities and calculate calories burned in real-time These applications capture labeled triaxial acceleration data from the smartphone’s accelerometer, which is then preprocessed and analyzed. Features are extracted using variousmethods,andmachinelearningalgorithmsclassify the activities. The most effective models are integrated into smartphone applications, enabling real-time activity recognition and health monitoring. This project contributes to developing assistive technologies that improve quality of life and promote a healthier lifestyle through classification techniques Six types of human activities: standing, sitting, lying down, walking, walking upstairs, and walking downstairs were identified using data from the University of California Machine Learning Repository.Datafromthe SamsungGalaxySII’sgyroscope and accelerometer were divided into training and testing sets in a 70:30 ratio. Principal Component Analysis reduced dimensionality, and machine learning methods such as Random Forest, Support Vector Machine, Artificial Neural Network, and K-Nearest Neighbor classified activities. Random simulation and confusion matrices compared the accuracy and performance of various models.
Key words: Exploratory Data Analysis, Machine Learning Algorithms, Data Modelling, Hyperparameterandcrossvalidation.
Human Activity Recognition (HAR) using smartphone dataisanemergingfieldthatleveragesmachinelearning algorithmstoclassifyvariousphysicalactivitiesbasedon informationcollected from a smartphone'ssensors. This study involved 28 individuals aged between 19 and 48, who participated in a series of experiments. Each participant had a smartphone (Samsung Galaxy S II) attached to their waist while carrying out six different
activities:walking,walkingupstairs,walkingdownstairs, sitting,standing,andlyingdown.
The smartphone's integrated accelerometer and gyroscope recorded 3-axial angular velocity and 3-axial linear acceleration at a steady rate of 50Hz. These recordings were essential for capturing the dynamic movements associated with each activity. To ensure accuracyinlabellingthedata,thetrialswerecapturedon camera, enabling manual verification of the activities performed.
The generated dataset was divided randomly into two subsets: training data consisting of 70% of the volunteers and test data from the remaining 30%. This divisionensuredthatthemachinelearningmodelscould betrainedandvalidatedeffectively.
Raw accelerometer and gyroscope signals underwent pre-processing to enhance data quality. Noise filters removedirrelevantdata,andsignalsweresampledusing 2.56-secondslidingwindowswith50%overlap,yielding 128readings per window AButterworthlow-passfilter witha 0.3 Hzcut off wasapplied to distinguish between gravitational and body motion components. Features were extracted from each window, including time and frequency domain measures like mean, standard deviation, energy, and entropy, to support accurate machinelearningclassification.
The UCI Machine Learning Repository, in collaboration with Team Kaggle, provided a dataset consisting of two main files: a training set with 7,352 rows and 564 columns, and a test set with 2,947 rows and 564 columns. Each row represents a sliding window of sensor data, and each column corresponds to a specific feature derived from the raw signals. The goal was to develop models to learn from the training data and accuratelypredictactivitylabelsonthetestdata.Various algorithms, including decision trees, support vector
International Research Journal of Engineering and Technology (IRJET) e-ISSN:2395-0056
Volume: 11 Issue: 07 | July 2024 www.irjet.net p-ISSN:2395-0072
machines, and neural networks, were utilized. Human Activity Recognition (HAR) using smartphone data is an effective method for classifying physical activities through machine learning, with applications in health monitoring, fitness tracking, and context-aware computing. The dataset provides a valuable resource for developingandtestingthesemodels.
Human Activity Recognition (HAR) is a field of study focused on identifying physical activities performed by individuals based on data collected from sensors. With the proliferation of smartphones equipped with various sensorssuchasaccelerometersandgyroscopes,HARhas gained significant attention due to its applications in health monitoring, sports analytics, and personal fitness tracking. One notable dataset that facilitates research in this area is available on Kaggle: the "Human Activity Recognition Using Smartphones Dataset byUCI Machine Learning."
1.2.1
The Kaggle datasetusedfor HumanActivityRecognition includes data collected from 30 participants who performed six different activities while wearing the smartphoneontheirwaist.Thesixactivitiesare:
Walking
Walkingupstairs
Walkingdownstairs
Sitting
Standing
Laying
The smartphone's built-in accelerometer and gyroscope recorded 3-axis linear acceleration and 3-axis angular velocity consistently at a rate of 50Hz.The dataset contains pre-processed, labelled data split into training and test sets, making it suitable for machine learning applications.
1.2.2
Thedatasetconsistsof:
Features: A 561-feature vector with time and frequencydomainvariables.
ActivityLabels:Thetypeofactivityperformed.
Subjects:Identifiersfortheparticipants.
The features include both raw signal data and derived data, such as means and standard deviations of the signalsoverfixedwidthslidingwindows.
Pre-processingstepsinvolve:
DataCleaning:Ensuringtherearenomissingvalues.
Feature Scaling: Normalizing the data to ensure uniformity.
Feature Selection: Selecting the most relevant featurestoreducedimensionalityandcomputational cost.
Various machine learning models can be applied to the dataset to classify the activities, including Logistic Regression, Decision Trees, Kernel SVM and Random forestwithhyperparametertunningandcrossvalidation.
Model performance is typically evaluated using metrics suchas:
Accuracy: The proportion of correctly classified activities.
Precision and Recall: Metrics to evaluate the quality ofpositivepredictions.
F1 Score: The harmonic means of precision and recall,providingabalancebetweenthetwo.
1.2.6 Applications
HAR using smartphone data has numerous applications, including:
Health Monitoring: Tracking daily activities to identify patterns in patients with chronic conditions.
Fitness Tracking: Providing insights into the intensityandtypeofworkouts.
ElderlyCare:Monitoringthemovementsofelderly individualstodetectfallsorinactivity.
Identifying human activities from smartphone sensor data is complex due to its large dimensions. Our system reduces these dimensions and efficiently employs machine learning to classify six activities using accelerometer and gyroscope data. Robust preprocessing and feature extraction ensure generalization across subjects. Validated on a Kaggle dataset from 28 individuals,themodeldemonstratesstrongperformance forreal-worldapplicability.
TheHumanActivityRecognitiondatabasewasformedby recording 30 participants engaging in daily activities
International Research Journal of Engineering and Technology (IRJET) e-ISSN:2395-0056
Volume: 11 Issue: 07 | July 2024 www.irjet.net p-ISSN:2395-0072
while carrying a waist-mounted smartphone equipped withinertialsensors.Thegoalistoclassifysixactivities: standing, lying down, walking, walkingupstairs, walking
S.NO. TITLE OF PAPER
downstairs, and sitting. The project aims to train a machine learning model using this data to classify the participants'activitiesaccurately..
Table-1,LiteratureSurveyofDifferentPapersorResearchinHAR
01. A Public domain dataset for human activity recognition using smartphones [4]
Davide Anguita, AlessandroGhio, Luca Oneto, Xavier Parra and Jorge L ReyesOrtiz
• Utilizes built-in accelerometers and gyroscopes
• Measures acceleration and rotational motion
•Collectsdataduringuser activities
• Aids in developing algorithm-based activity identification.
02. Smartphone Based Data Mining for Human Activity Recognition[5]
Girija Chetty, Matthew White and Farnaz Akther
03. Activity Classification with Smartphone Data[6].
MattBrown,Trey Deitch,andLucas O’Conor
Sensors Overview
• Accelerometers track movement.
• Gyroscopes measure rotation.
• Magnetometers sense direction.
• Techniques include feature extraction and classification algorithms
•Machinelearningmodels often used for pattern classification.
Sensor Data Processing Overview
• Utilizes accelerometers, gyroscopes, and magnetometers to measure acceleration, track rotation, and sense direction.
• Sensor readings are captured at regular intervals during various activities
• Raw sensor data is preprocessed for analysis.
• Relevant data points extracted from preprocessed data.
•Machinelearningmodels trainedonlabelleddatato learn patterns between features and specific activities
•Modelsclassifynewdata intoactivitycategories
• Provides valuable resource without specialized equipment.
• Captures sensor readings from everyday phone use
•Offerscommongroundfor algorithm comparison and benchmarking.
Smartphone Wearables Solution
• Eliminates need for dedicated wearables
• Data collection passively via everyday phone usage
• Multiple sensors provide comprehensive movement patterns.
• Large-scale deployment possible due to smartphone ubiquity.
Smartphone Wearables:
• Eliminates need for dedicated wearables.
• Data collection passively through everyday phone usage
• Multiple sensors provide comprehensive movement patterns.
• Widely applicable in healthcare, personalized marketing, and contextawarecomputing.
Real-world Application
Recognition
• Sensor quality varies between phone models
• User positioning affectsperformance
Impact of Sensor Quality on Data Collection
• Factors include sensorquality,phone placement, and activity complexity.
• Data collection requires user consent to avoid privacy violations.
• Continuous sensor use can drain battery life.
Impact of Sensor Quality and Phone Placement
• Sensor quality, phone placement, and activity complexity affect data collection.
• User consent is crucial to avoid privacy violations.
• Tracking activities and data storage and usage are crucial.
• Continuous sensor use can drain battery life
• Not all relevant information captured for complex activities
-0056
Volume: 11 Issue: 07 | July 2024 www.irjet.net p-ISSN:2395-0072
To design the Human Activity Recognition System using Smartphone Data, uses the Data Analysis and Machine learning methods. So, the system architecture has the following steps to be implemented Fig-1:
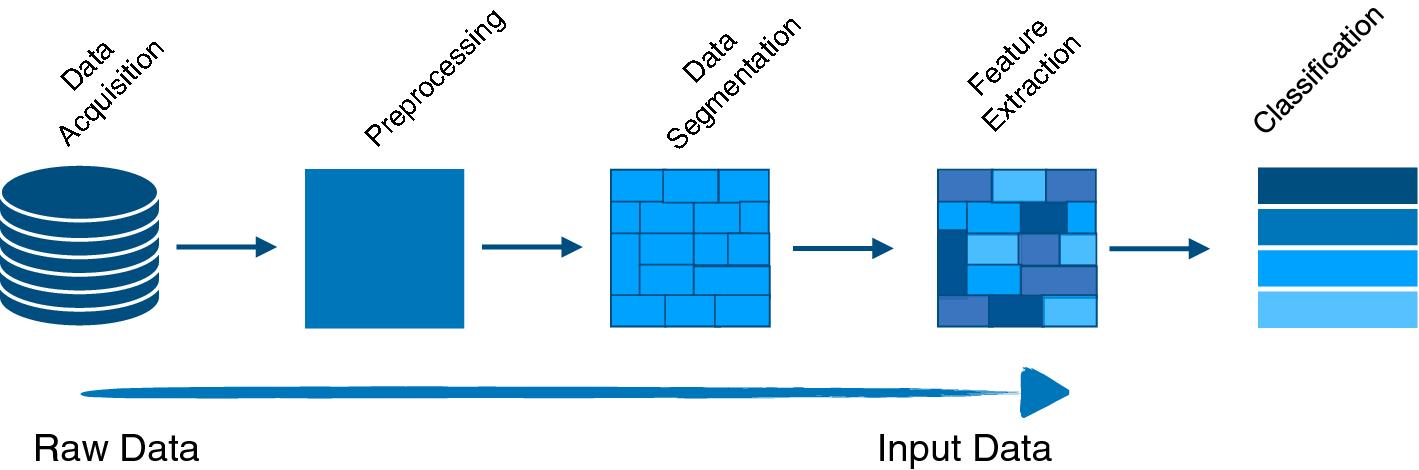
DATA ACQUISITION: In Human Activity Recognition (HAR) using smartphone data, data acquisition is the foundation for building effective models. Here's a breakdownofthekeyaspects:
Sensors: Smartphones come equipped with various sensors that capture information about user movement andphoneorientation.
TheprimarysensorsusedinHARincludeAccelerometer, GyroscopeandMagnetometer.
Data Collection Techniques:
App-basedcollection:Adedicatedappisdeveloped tocapturesensordatawhileusersperformspecific activities. Users might be instructed to follow predefined routines or perform activities freely while theappgathersdatainthebackground.
Continuous collection: Sensor data is collected passivelythroughoutthedayduringregularphone usage. This approach allows capturing a wider range of everyday activities but requires careful selectionofrelevantdatasegmentsforanalysis.
Data Labelling:
For supervised machine learning algorithms, data needs to be labelled with the corresponding activity(e.g.,walking,standing,sleeping).
Inapp-basedcollection,usersmightmanuallylabel datasegmentsafterperformingactivities.
For continuous collection, external sources like video recordings or user annotations can be used to label specific activity periods within the collecteddata.
Privacy Concerns: Balancing data collection with user privacy is crucial. Users need to be aware of what data is being collected, how it's used, and havetheoptiontoopt-out.
User Burden: App-based collection with frequent labelling can be tedious for users. Continuous collection needs to be optimized to minimize batterydrain.
Data Quality: Sensor quality can vary between phones, and factors like phone placement can impactdataaccuracy.
These samples are Provided by UCI (University of California Irvine) and Kaggle Team with use of Gyro sensors.
Data preprocessing is a crucial step in Human Activity Recognition (HAR) using smartphone data. It prepares the raw sensor data for effective analysis and improves the performance of machine learning models used for activityclassification.Here'sabreakdownofthekeydata preprocessingtechniques:
-0056
Volume: 11 Issue: 07 | July 2024 www.irjet.net p-ISSN:2395-0072
Missing Values: Identify and handle missing data points. This might involve removing data entries with missing values, imputation (filling in missing values with statistical methods), or interpolation (estimating missing values based on surrounding data).
Outlier Removal: Extreme sensor readings that deviatesignificantlyfromthenormcanbeoutliers. These outliers can be removed or mitigated throughtechniqueslikecapping.
Normalization:
Sensor data can be measured in different units (e.g., gforce for accelerometers). Normalization techniques like min-maxscalingorz-scorenormalizationensurethatall features are on a similar scale, allowing the machine learning model to focus on the relative patterns within thedata.
Raw sensor data is a continuous stream. Segmentation involves dividing the data into smaller segments (windows) thatrepresent specific instances of activities. Window size and overlap between windows are crucial parameters. A larger window might capture more context but lose granularity, while a smaller window might miss important details. Overlap helps capture transitionsbetweenactivities.
Extracting relevant features from the segmented data is vital.Commonfeaturesinclude:
Statistical features: Mean, standard deviation, variance, skewness, kurtosis - capture basic propertiesofthemovementwithinthewindow.
Frequency domain features: Extracted using techniques like Fast Fourier Transform (FFT) to identifydominantfrequenciesinthedata,whichcan be helpful for differentiating activities like walking andrunning.
Supervised machine learning algorithms are commonly used for activity classification in HAR. During training, the model learnsthepatternsthatdifferentiate between activities based on the features extracted from the preprocesseddata.
CommonClassificationAlgorithms:
LogisticRegression(LR):SimpleClassifier.
K-Nearest Neighbours (KNN): A simple yet effective algorithm that classifies new data points based on theirsimilaritytolabelleddatapointsinthetraining set.
Support Vector Machines (SVM) construct a hyperplane that optimally distinguishes data points representing different activities within a highdimensionalfeaturespace.
Decision Trees: Learns a tree-like structure where each branch represents a decision based on a feature, leading to a final classification label (activity).
Random Forests: An ensemble method that combines predictions from multiple decision trees, improvingoverallaccuracyandrobustness.
5.1
In the below Figure-2, it shows the overall strategy to implement the workflow process of the Human Activity RecognitionModelwhichclassifiesforsevensteps:
International Research Journal of Engineering and Technology (IRJET) e-ISSN:2395-0056
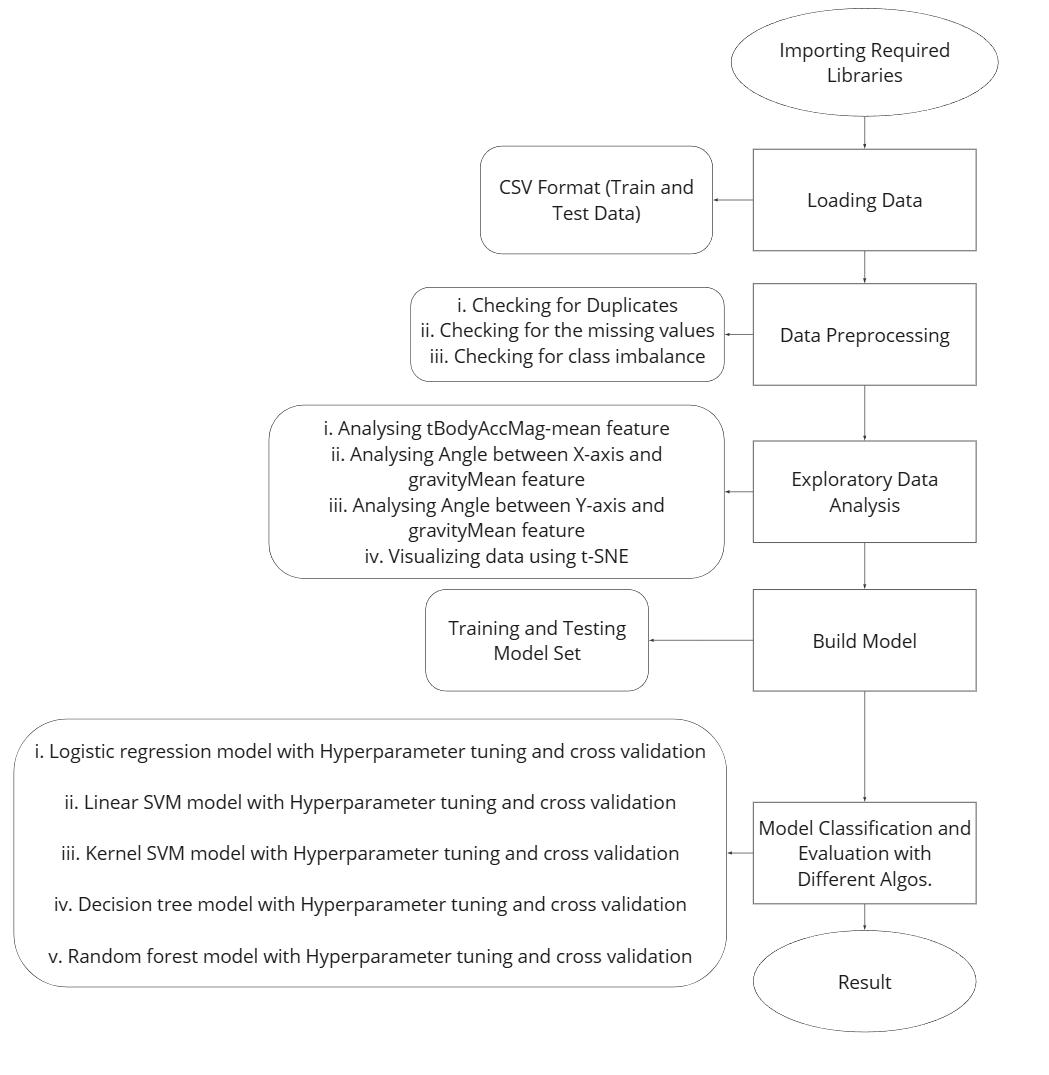
5.1.1. Importing Required Libraries:
Import the required Libraries that are useful for the buildingmodelforexample:
Table-2,showstherequiredlibrariestobeimportandwhy?
Import Required Why to Import?
NumPy DealingwithArrays
Pandas DealingwithDataFrame,mostly,usedinimportingcsvdataset.
Seaborn and Matplotlib Matplotlib isthe foundationforcreatingvariousdatavisualizationsinPython.It offersawiderangeofplottypesandcustomizationoptions.
SeabornbuildsontopofMatplotlib,providingahigher-levelinterfacespecifically designed for creating statistical graphics. It simplifies creating aesthetically pleasing and informative visualizations with features like dataset-oriented
Volume: 11 Issue: 07 | July 2024 www.irjet.net p-ISSN:2395-0072 © 2024, IRJET | Impact Factor value: 8.226 | ISO 9001:2008 Certified Journal | Page818
-0056
Volume: 11 Issue: 07 | July 2024 www.irjet.net p-ISSN:2395-0072
plottingandautomaticstatisticalaggregation.
Data Analysis
Counter
PCA
TNSE
Model
RandomSizedSearchCV
LogisticRegression
SVC
DecsionTreeClassifier
TheCounterclassfromthecollectionslibraryinPythonprovidesanefficientway to count the occurrences of elements in a collection (like a list or string). It creates a dictionary-like object where elements are keys and their counts are values.
The PCA class from sklearn.decomposition allows you to perform Principal Component Analysis (PCA) in Python. PCA reduces the dimensionality of your databyfindinganewsetoffeatures(principalcomponents)thatcapturemostof thevariance,makingitusefulfordatacompressionandvisualization.
You'd use from sklearn.manifold import TSNE in Python to visualize highdimensional data. Unlike PCA (which is linear), TSNE(t-Distributed Stochastic Neighbor Embedding) excels at uncovering non-linear relationships between data points, allowing you to explore complex datasets in lower dimensions for bettervisualization.
Regular grid search can be computationally expensive. RandomizedSearchCV from sklearn.model_selection offers a more efficient alternative for hyperparameter tuning. It randomly samples parameter combinations from defined distributions, reducing computation cost while still providing good estimatesforoptimalhyperparameters.
The LogisticRegression class from sklearn.linear_model lets you build machine learningmodelsforclassificationtasksinPython.Itworkswellforproblemswith binary or multiple class labels, using a logistic function to estimate the probabilityofaninstancebelongingtoaparticularclass.
TheSVCclassfromsklearn.svmimplementsSupportVectorMachines(SVMs)for classification in Python. SVMs excel at finding hyperplanes that best separate data points belonging to different classes, offering good performance in highdimensionalspacesandwithlimitedtrainingdata.
The DecisionTreeClassifier from sklearn.tree lets you create machine learning models based on decision trees in Python. These trees make predictions by recursivelysplittingthedatabasedonfeatures,offeringaclearandinterpretable modelforclassificationtasks.
RandomForestClassifier
Confusion_matrix
Accuracy_score
Classification_report
The RandomForestClassifier from sklearn.ensemble is used for building robust classificationmodelsinPython.Itcombinesmultipledecisiontrees,reducingthe risk of overfitting and improving model performance compared to a single decisiontree.
Ithelpsevaluateyourclassificationmodel'sperformancebyprovidinga table that shows how many instances were correctly and incorrectly classified.
This breakdown (true positives, false negatives, etc.) allows you to identifyareasforimprovementinyourmodel.
It calculates the accuracy of your classification model, which is the proportionofpredictionscorrectlymade.
This simple metric provides aquick overall understanding ofhow well yourmodelperforms.
It generates a report with metrics like precision, recall, F1-score for eachclass,givinginsightsbeyondjustoverallaccuracy.
This helps identify potential issues like class imbalance or uneven modelperformanceacrossdifferentcategories.
Volume: 11 Issue: 07 | July 2024 www.irjet.net
Data provided by Kaggle, and the UCI Machine Learning department involved 30 volunteers aged 19-48 performing six activities (WALKING, WALKING_UPSTAIRS, WALKING_DOWNSTAIRS, SITTING, STANDING, LAYING) while wearing a waist-mounted Samsung Galaxy S II smartphone. The smartphone's accelerometer and gyroscope captured 3-axial linear acceleration and angular velocity at 50Hz. Experiments were video recorded for manual labelling. The dataset wassplitinto70%fortrainingand30%fortesting.Preprocessinginvolvednoisefilteringandsamplingin2.56second sliding windows with 50% overlap. Using a Butterworth low-pass filter, body acceleration and gravitywereseparated,andfeatureswereextractedfrom both time and frequency domains. And finally provided in Kaggle Website: https://www.kaggle.com/datasets/uciml/humanactivity-recognition-with-smartphonesincsvfile.[10].
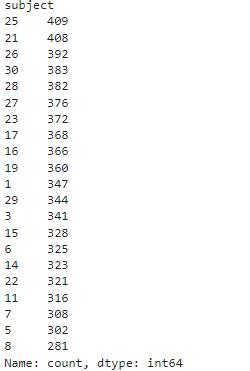
CSV(Comma-SeparatedValues)isatypeofexcelformat where the UCI provided two dataset which is “train.csv” and “test.csv”. The resulting dataset, hosted by UCI Machine Learning in collaboration with Team Kaggle, includes training (7352 samples, 563 features) and testing (2947 samples, 563 features) sets. Let’s explore theageofpeopleparticipatedinthisexperimentisfrom 19-48intotal30so,intrainingdatasettotalcontribution is:
5.1.3. Data Preprocessing
InHARmodel,usedthreesteps:
i. Checking for Null Values
IndatasetprovidedbyUCIandKagglethereisnodataor norows/columnswhichisNaN.

Figure-3, TotalNumberofMissingValuesinDataset
ii. Checking for Duplicates
-0072
In dataset provided by UCI and Kaggle there is no data whichisduplicated.
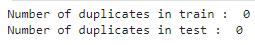
Figure-4, NumberofDuplicatesinDataset
iii. Checking for Imbalance
In dataset provided by UCI and Kaggle, there is almost samenumberofobservationsacrossallthesixactivities, sothisdatadoesnothaveclassimbalanceproblem.
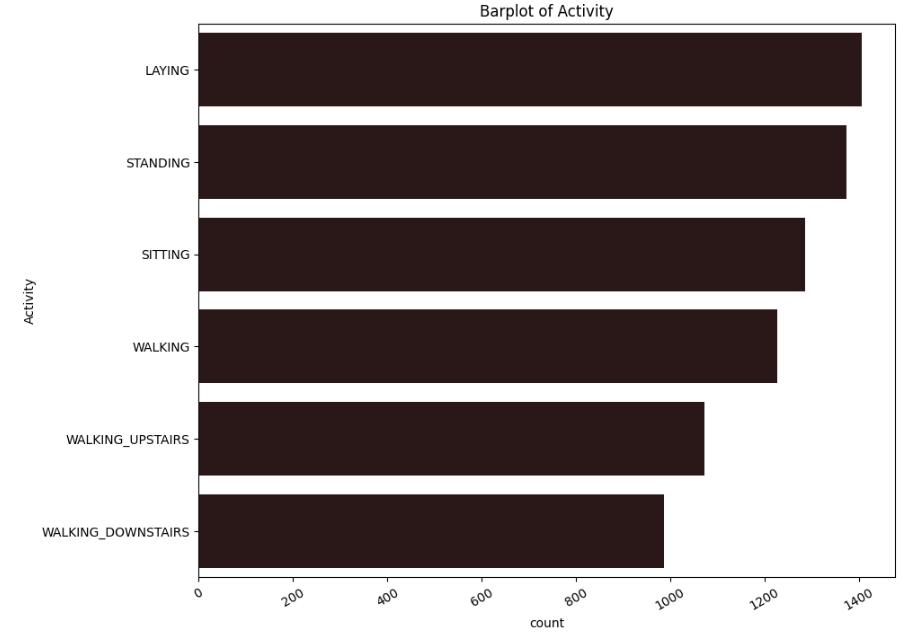
Figure-5, ImbalanceGraph
5.1.4. Exploratory Data Analysis
InHAR,IhavefocusedonfourEDAparts:
i. Mean Feature- Analysis tBodyAccMag-mean
There are primarily 'acceleration' and 'gyroscope' features, with a few 'gravity' features also present. It's remarkable how many features there are given the limitednumberofsensorsused.
Based on the typical nature of activities, we can broadly categorizethemintotwogroups:
Staticanddynamicactivities:
SITTING, STANDING, LAYING are considered static activities with minimal motion WALKING, WALKING_DOWNSTAIRS, WALKING_UPSTAIRS are considered dynamic activities involving significant motion.
International Research Journal of Engineering and Technology (IRJET) e-ISSN:2395-0056
Volume: 11 Issue: 07 | July 2024 www.irjet.net p-ISSN:2395-0072
Let'susethetBodyAccMag-mean()featuretodistinguish betweenthesetwobroadersetsofactivities.Ifweaimto develop a simple classification model using one variable
at a time, the probability density function (PDF) is invaluable for assessing the importance of continuous variables.Let’splotdensityplot:
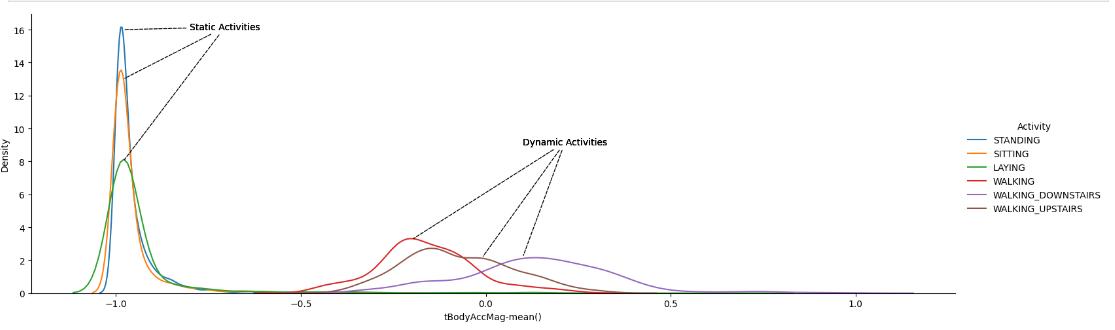
Figure-6, ActivitiesDensityPlot_StaticandDynamicDistributions
Using the above density plot we can easily come with a condition to separate static activities from dynamic activities. Therefore, with plot we get to the condition that, if tBodyAccMag-mean() is lesser than -0.5 then activitiesarestaticinnatureorelsetheyaredynamic.
Let'shaveacloserviewonthePDFsofeachactivity understaticanddynamiccategorization.
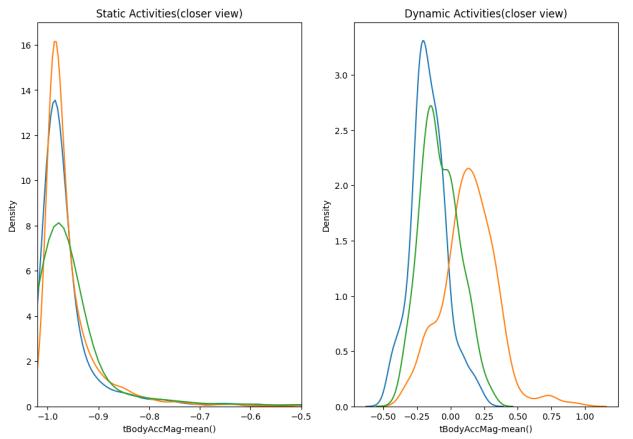
Figure-7,CloserActivitiesPlots
The insights obtained through the density plots can berepresentedusingBoxplots.Let'splottheboxplot of Body Accelartion Magnitude mean(tBodyAccMagmean())acrossallthesixcategories.
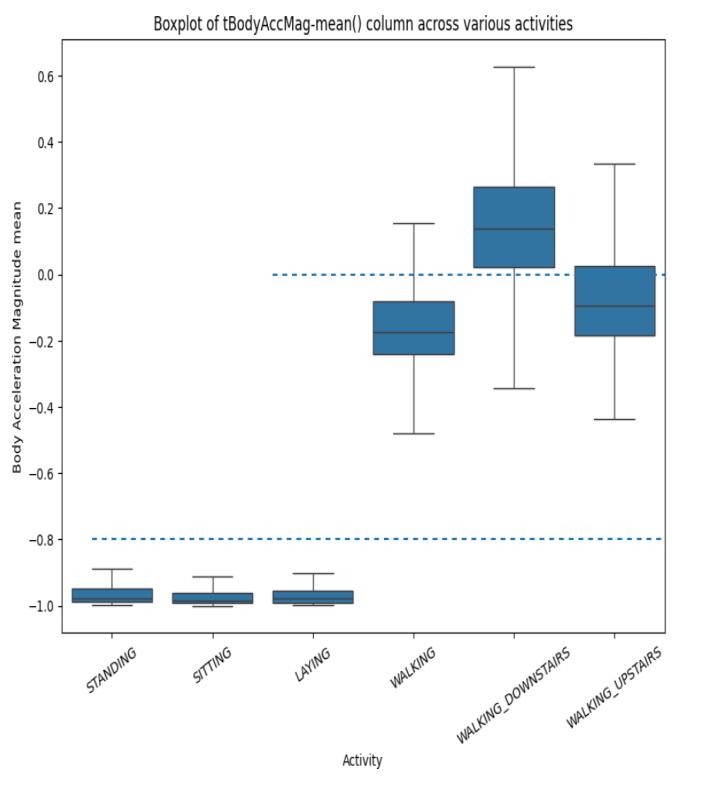
Figure-8, BoxPlotforActivities
Using boxplot again we can come with conditions to separate static activities from dynamic activities. Therefore, form the plot we come to a condition that if tBodyAccMag-mean() is less than -0.8 then box plot represents the activities as static and if tBodyAccMagmean()isgreaterthan-0.6thenitrepresentsasdynamic activities.
Also, we can easily separate WALKING_DOWNSTAIRS activity from others using boxplot like, if the condition tBodyAccMag-mean() is greater than 0.02 then person performing activity is Walking Downstairs if not then plotswouldspecifyotheractivities.
But still 25% of WALKING_DOWNSTAIRS observations are below 0.02 whichare misclassifiedasothers, so this conditionmakesanerrorof25%inclassification.
International Research Journal of Engineering and Technology (IRJET) e-ISSN:2395-0056
Volume: 11 Issue: 07 | July 2024 www.irjet.net p-ISSN:2395-0072
ii. Analysing Angle between X-axis and gravityMean feature
UsingBoxPlotPlottinganglebetweenX-axisandgravitymeanfeatures:
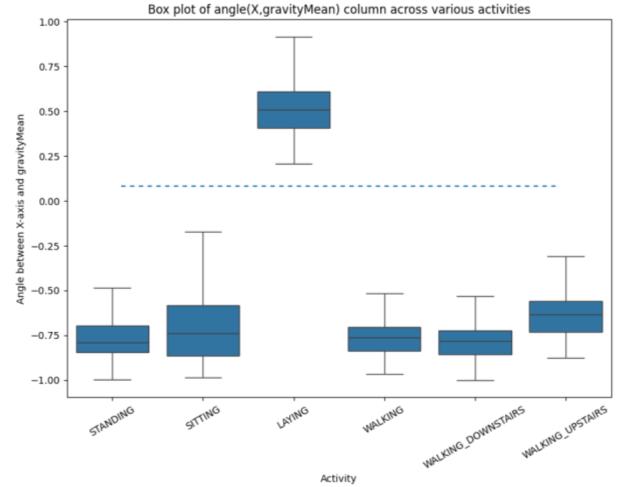
Figure-9,AngleBetweenX-axisandGravityMean
From the boxplot we can observe that angle(X,gravityMean) perfectly seperates LAYING from otheractivities.ConditionisthatifangleofXandgravity Mean is greater than 0.01 then it specifies as Laying activityifnotjustmentionmoreoncaseotheractivities.
iii. Analysing Angle between Y-axis and gravityMean feature
PlottingtheBoxPlot:
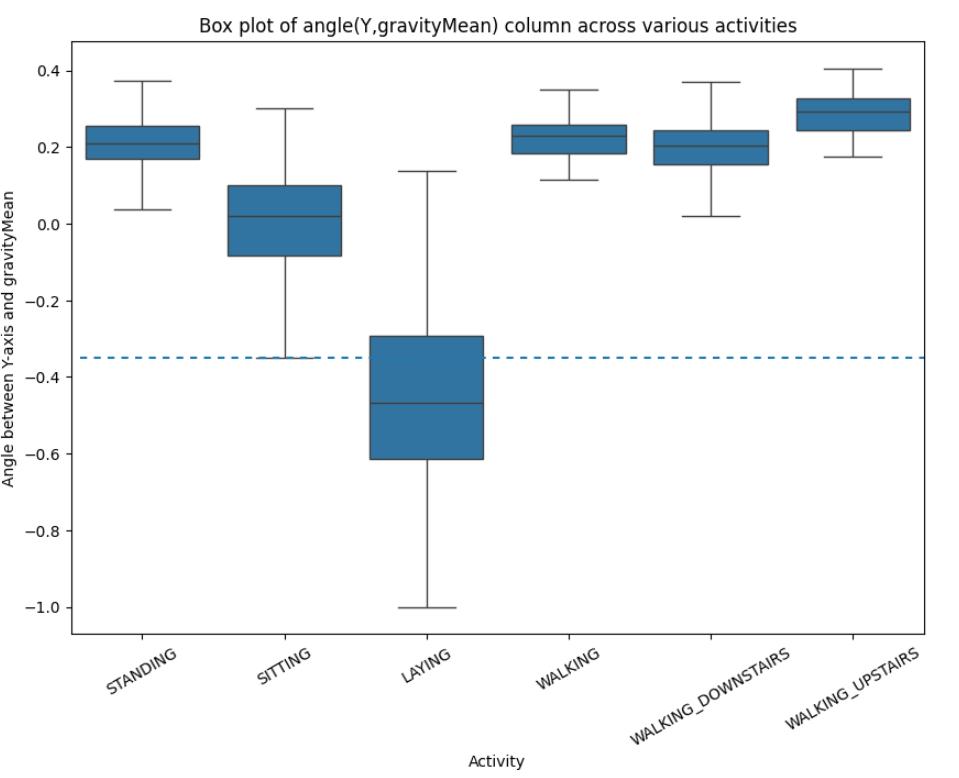
Figure-10,BoxPlotofAngleBetweenY-axisandGravity Mean
iv. Visualizing data using PCA (Principal Component Analysis) and t-SNE (TSNE: tdistributed Stochastic Neighbor Embedding)
PCA:
Using PCA, data can be transformed from a highly dimensional space to a lower dimensional space while retaining significant information. With the training data consisting of 561 unique features, PCA allows us to visualizeitina2Dspaceeffectively.
From the below graph, Using the two new components obtained through PCA we can visualize and separate all thesixactivitiesina2Dspace.
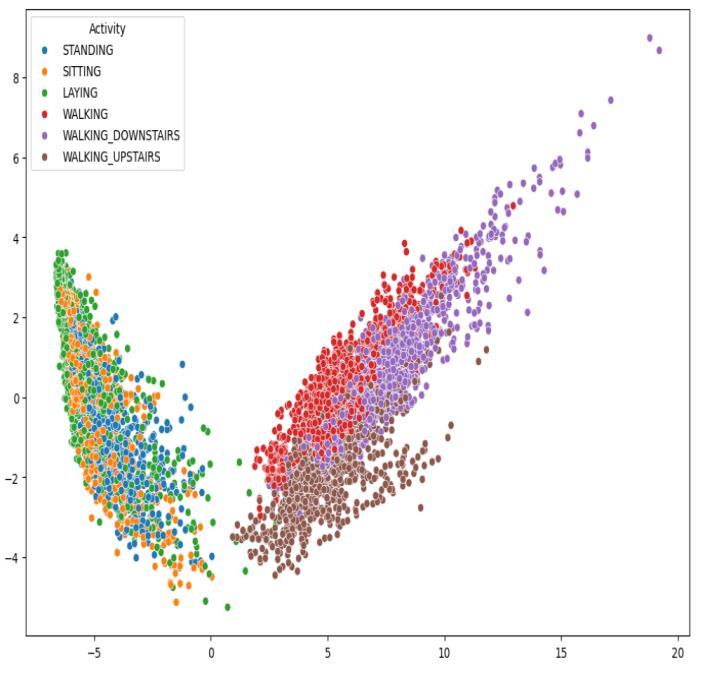
Figure-11, VisualizingUsingPCA
t-SNE
Uncovers non-linear relationships: Unlike linear dimensionality reduction techniques like PCA, TSNE excels at revealing non-linear structures in your data. This allows you to explore complex datasets where data pointsmightnotlieineasilyseparablelinearclusters.
Better visualization in lower dimensions: By projecting high-dimensional data onto a lower-dimensional space (often2or3dimensions),TSNEenablesyoutovisualize complex relationships that might be difficult to grasp in the original high-dimensional space. This facilitates easierdataexplorationandinterpretation.
Using t-SNE, data can be visualized from a highdimensional space to a lower-dimensional space while preserving substantial information. Given that the training data comprises 561 unique features, t-SNE enablesustovisualizeiteffectivelyina2Dspace.
-0056
Volume: 11 Issue: 07 | July 2024 www.irjet.net p-ISSN:2395-0072
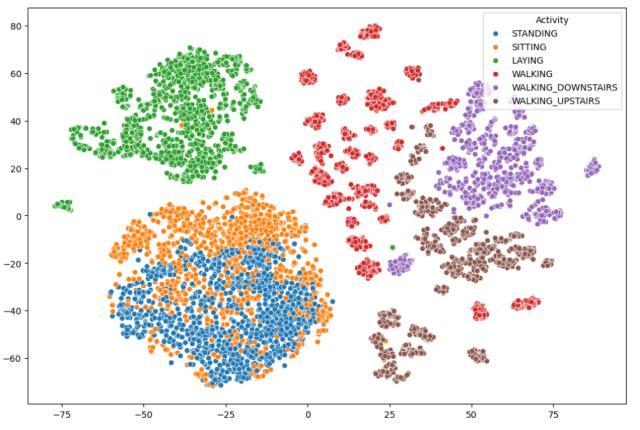
Figure-12,VisualizingusingTNSE
5.1.5 Build Model
Building Model refers to define training and testing model. Splitting training and testing data is crucial in machinelearningfortwokeyreasons:
Prevents Overfitting: Imaginetrainingamodelonall your data. It might perfectly memorize the specific detailsof thatdata,leading togreat performanceon thatspecificset.However,whenpresentedwithnew, unseendata,themodelmightfailbecauseitwastoo focused on the training data's quirks instead of learning generalizable patterns. Splitting the data ensuresadedicatedtestingsetthatthemodelhasn't "seen" during training. Evaluating on this unseen data gives a more realistic picture of how well the modelgeneralizestonewinformation.
Unbiased Evaluation: If you use the same data for both training and testing, you're essentially testing the model on data it already "knows." This leads to aninflatedsenseofaccuracyanddoesn'treflecthow themodel performsontrulynewdata. Splittingthe data ensures an unbiased evaluation where the model is assessed on data it wasn't tailored to fit duringtraining.
Here is the below demonstration of implementation of BuildingTrainingand TestingDataset,alsowithnumber ofsplattedrows.
Figure-13,BuildModel
Key Points: Here, I have used Hyperparameter Tunning andCrossValidation.RequirementofDoing:
Improved Generalizability: Hyperparameter tuning helpsfindthebestsettingsforyourmodel,butitcan lead to overfitting if not done carefully. Crossvalidationprovidesarobustestimateofhowwellthe tuned model performs on unseen data, ensuring it generalizeswelltonewsituations.
ReducedOverfitting: Overfittingoccurswhenamodel memorizes the training data too well, losing its ability to adapt to new data. Cross-validation helps prevent this by evaluating the model on different datasplits,forcingittolearngeneralizablepatterns.
Optimal Hyperparameter Selection: Hyperparameter tuning alone can lead to picking settings that work well on a specific training set but might not generalize. Cross-validation allows you to compare performance across different hyperparameter combinations, guiding you towards the best overall settings.
Unbiased Performance Evaluation: Without crossvalidation, it's easy to overestimate your model's performance on unseen data. Cross-validation provides a more realistic picture by averaging performance across different data splits, giving a moreunbiasedevaluation.
Efficiency and Informed Decisions: By combining hyperparameter tuning with cross-validation, you canefficiently exploredifferentsettingsandidentify the best configuration for your model, saving time andresourcesinthelongrun.
In HAR model, I have used Different machine learning algorithmsformodelling:
i. Logistic Regression with Hyperparameter and Cross_Validation
Therefore,whenusingLRalgo:
AccuracyusingLogisticRegression: 95.4954954954955
Bestestimator: LogisticRegression(max_iter=500)
Bestsetofparameters: {'max_iter':500}
Bestscore: 93.73035141996976
And,theHeatmapwhichshowstheco-relationmatrix:
International Research Journal of Engineering and Technology (IRJET) e-ISSN:2395-0056
Volume: 11 Issue: 07 | July 2024 www.irjet.net p-ISSN:2395-0072
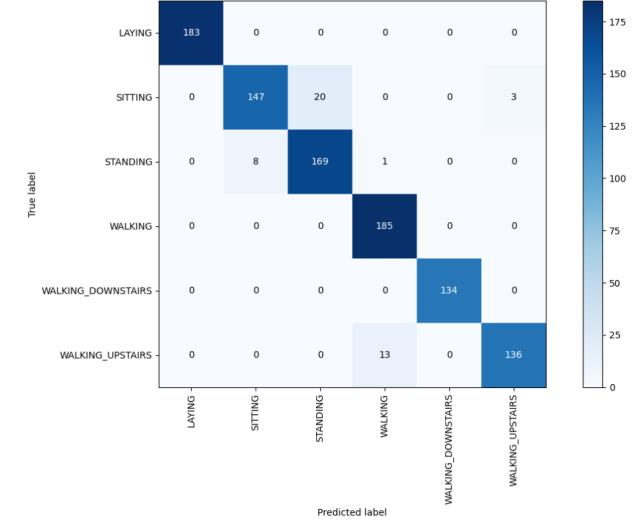
Figure-14,HeatmapofLR
ii. Kernel SVM model with Hyperparameter and Cross_Validation
WhenUsingKernelSVM,
AccuracyusingKernelSVM: 96.5965965965966
Bestestimator: SVC(C=50)
Bestsetofparameters: {'kernel':'rbf','C':50}
Bestscore: 94.64109332023303
And,theHeatmapwhichshowstheco-relationmatrix:
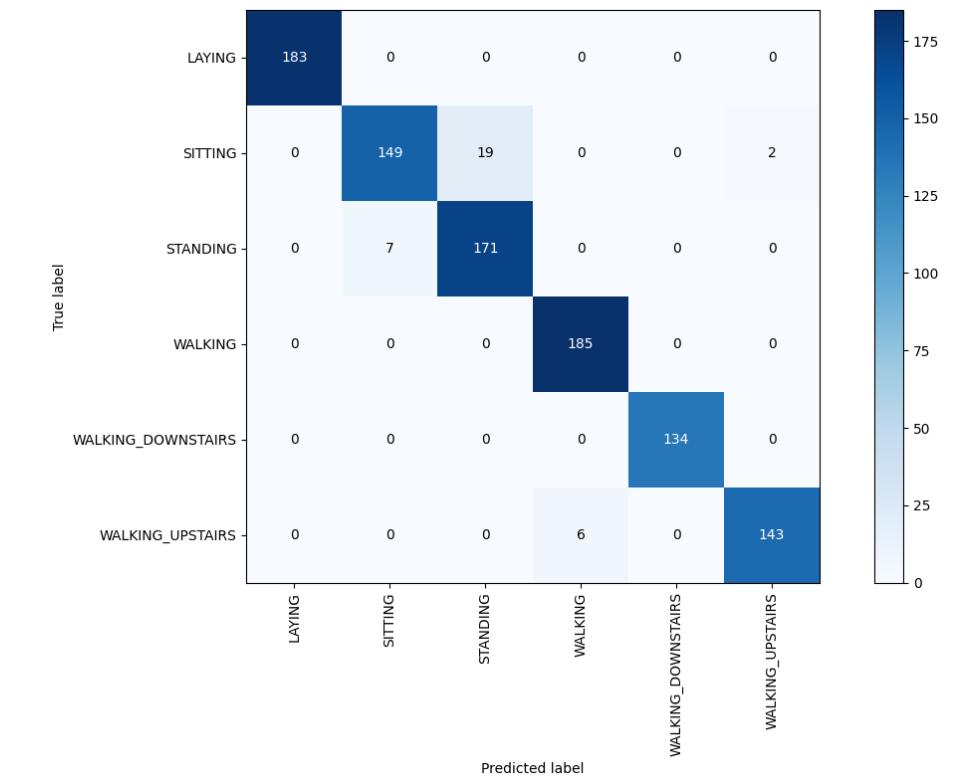
Figure-15,HeatmapofKERNELSVM
iii. Decision Tree Model with Hyperparameter and Cross_Validation
WhenusingDecisionTreeModel,
AccuracyusingDecisiontree: 84.48448448448448
Bestestimator: DecisionTreeClassifier(max_depth=8)
Bestsetofparameters: {'max_depth':8}
Bestscore: 84.97097166534866
And,theHeatmapwhichshowstheco-relationmatrix,
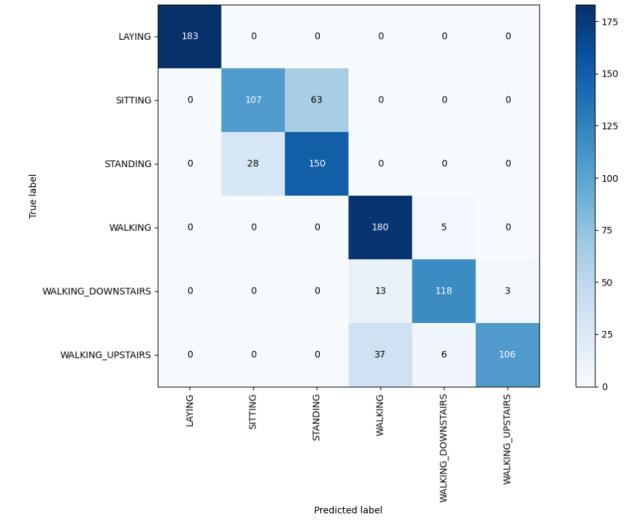
Figure-16,HeatmapofDecisionTreeClassifier
iv. Random Forest Model with Hyperparameter and Cross_Validation
WhenusingtheRandomForestModel,
AccuracyusingRandomforest: 90.990990990991
Bestestimator: RandomForestClassifier(max_depth=12, n_estimators=70)
Bestsetofparameters: {'n_estimators':70,'max_depth': 12}
Bestscore: 92.31547792468449
And,theHeatmapwhichshowstheco-relationmatrix,
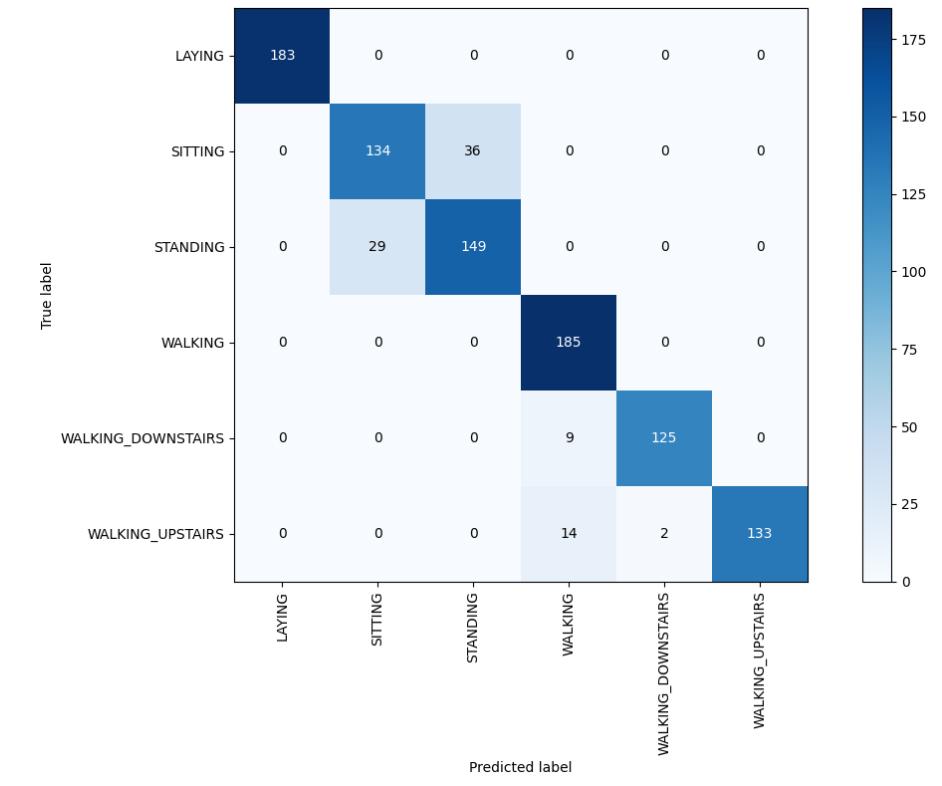
Figure-17,HeatmapofRandomForestClassifier
5.1.7. Outcome
When using the different machine learning algorithm, Kernel SVM found out to have a best estimator’s accuracy.
International
Volume: 11 Issue: 07 | July 2024 www.irjet.net p-ISSN:2395-0072
TherearetwotypesofrequirementanalysisProjectedonHARmodels:
i. Software Requirements:
Table-3:SoftwareRequirements
Requirement Type
Software or Package Purpose
Recommended Version
Operating System Windows,macOS,Linux PlatformtorunJupyterNotebook LatestStable
Programming Language Python CorelanguageforJupyterNotebook 3.8ornewer
Notebook Application JupyterNotebook Interface for creating and managing notebooks LatestRelease
Package Manager piporconda Tool to install and manage Python packages LatestRelease
Virtual Environment conda Isolates Python environments (Anaconda) LatestRelease
Basic Libraries NumPy Fundamental package for scientific computing CompatiblewithPythonversion
Pandas Datastructures&analysis
CompatiblewithPythonversion Matplotlib Plottinglibrary
Advanced Libraries scikit-learn Machinelearninglibrary
TensorFloworPyTorch Deeplearningframeworks
Extensions JupyterLab
Version Control Git
CompatiblewithPythonversion
CompatiblewithPythonversion
CompatiblewithPythonversion
Next-generation web-based UI for ProjectJupyter LatestRelease
Versioncontrolsystem LatestRelease
Collaboration Tools GitHuborGitLab Remote storage and collaboration on notebooks LatestRelease
ii. Hardware Requirements:
Table-4, HardwareRequirements Usage
Suitable for basic tasks and learning
Good for medium-sized datasetsandmoderatetasks
Best for large datasets and intensivecomputations
Necessary for GPU-accelerated computingtasks
Volume: 11 Issue: 07 | July 2024 www.irjet.net
6.1 Analysis
So,Comparingdifferentalgorithmsevaluation:
Table-5, AnalysisofDifferentAlgorithm.
1 KernelSVC
3 RandomForest
0 LogisticRegression 84.484484 93.730351
2 DecisionTrees 84.484484 84.970972
Here,asyoucanseetheKernelSVCorSVMgivesthebest accuratevalue.
6.2 Result
Now, according to above analysis to Build Model Kernel SVC found to showing optimal accuracy and average accuracy(bestscoreaccuracy%)of96.59%and94.64% respectively.
Therefore, building the HAR model with KERNEL SVM willgivestheoptimalrecognition.
Hence, Visualization: Depending on the application, the results might be visualized. For example, you might see heatmaps overlaid on data frames highlighting where specific activitiesaredetected.Thisheatmapachievedis muchoptimizedthenotheralgorithmmodels.
Figure-18, ResultantHeatmapofKERNELSVM
7.1 Conclusion
-0072
- Studies on Kaggle datasets have demonstrated the feasibility of using smartphone sensor data (accelerometer, gyroscope) for recognizing various activities like walking, standing, sitting, upstairs/downstairsmovement.
- Machine learning models like KNN, SVM, Random Forests have achieved promising accuracy in classifying these activities based on extracted features from sensor data.
KernelSVCshowstheBestScoreAccuracy.
AccuracyusingKernelSVM: 96.5965965965966
The field of Human Activity Recognition (HAR) using smartphone data continues to evolve, and there are exciting future research directions. The future of HAR lies in interdisciplinary collaboration, innovative model architectures, and addressing practical challenges to make smartphone-based activity recognition more accurate, efficient, and applicable to diverse scenarios. Herearesomepotentialareasoffocus:
i. Multimodal Sensor Fusion:
Combining data from various smartphone sensors (accelerometer, gyroscope, magnetometer, etc.) with other modalities (such as audio or visual data)canenhanceactivityrecognitionaccuracy.
Exploring fusion techniques and designing robust models that leverage multiple sensor inputs is an interestingavenueforresearch.
ii. Real-Time and Continuous Monitoring:
HAR models can be extended to provide real-time feedbackandalerts.
Developing systems that continuously monitor activities and adapt to changes in behavior or context is crucial for applications like healthcare andsafety.
iii. Transfer Learning and Generalization:
Investigatingtransferlearningapproachescanhelp generalize HAR models across different user populations,demographics,andculturalcontexts.
Pretraining on large datasets and fine-tuning on specifictaskscanimprovemodelperformance.
International Research Journal of Engineering and Technology (IRJET) e-ISSN:2395-0056
Volume: 11 Issue: 07 | July 2024 www.irjet.net p-ISSN:2395-0072
iv. Edge Computing and Energy Efficiency:
Deploying lightweight models directly on smartphones(edgedevices)canreducerelianceon cloudservers.
Optimizing energy consumption during data collection and inference is critical for prolonged smartphoneusage.
v. Long-Term Behavioral Patterns:
Understanding long-term behavioral patterns can provide insights into lifestyle changes, mental health,anddiseaseprogression.
Investigating how HAR models can capture and analyzeextendedtimeseriesdataisvaluable.
vi. Benchmark Datasets and Evaluation Metrics:
Creating standardized benchmark datasets for smartphone-basedHARisessential.
Defining consistent evaluation metrics and protocols will facilitate fair comparisons across studies.
[1](2012).MobilePhoneAccessReachesThreeQuarters of Planet's Population. The World Bank. Available: http://www.worldbank.org/en/news/pressrelease/2012/07/17/mobile-phoneaccess-reachesthree-quarters-planets-population
[2] M. Schirmer, H. Hopfner. Smartphone Hardware Sensors. Available: https://www.uni-weimar.de/kunstundgestaltung/wiki/images/Zeitmaschinensmartphonesens ors.pdf
[3] O. C. Ann and L. B. Theng, "Human activity recognition: A review," 2014 IEEE International Conference on Control System, Computing and Engineering (ICCSCE 2014), Batu Ferringhi, 2014, pp. 389-393.doi:10.1109/ICCSCE.2014.7072750
[4] Davide Anguita, Alessandro Ghio, Luca Oneto, Xavier Parra and Jorge L. Reyes-Ortiz. A Public domain dataset for human activity recognition using smartphones. ESANN 2013 proceedings, European Symposium on ArtificialNeuralNetworks,ComputationalIntelligence
[5] Girija Chetty, Matthew White and Farnaz Akther. SmartPhone Based Data Mining For Human Activity Recognition. Information and Communication Technologies (ICICT 2014). Procedia Computer Science 46(2015)1181–1187
[6]MattBrown, TreyDeitch,andLucasO’Conor.Activity Classification with Smartphone Data. Stanford CS 229, Fall2013
[7] Sensors in Android. Available: http://developer.android.com/guide/topics/sensors/se nsors_overview.html [8] Metabolic equivalent. Wikipedia. Available: https://en.wikipedia.org/wiki/Metabolic_equivalent
[9] Jette, M., Sidney, K. and Blumchen, G. (1990), Metabolic equivalents (METS) in exercise testing, exercise prescription, and evaluation of functional capacity. Clin Cardiol, 13: 555–565. doi: 10.1002/clc.4960130809 [10] MET Values for 800+ Activities. Available: http://golf.procon.org/view.resource.php?resourceID=0 04786
[10] Dataset Source: Human Activity Recognition with Smartphones, https://www.kaggle.com/datasets/uciml/humanactivity-recognition-with-smartphones