
International Research Journal of Engineering and Technology (IRJET) e-ISSN: 2395-0056
Volume: 11 Issue: 07 | July 2024 www.irjet.net
International Research Journal of Engineering and Technology (IRJET) e-ISSN: 2395-0056
Volume: 11 Issue: 07 | July 2024 www.irjet.net
Abhinav Palanivel Student, IB DP Canadian Internation School, Bangalore,
Dr. Nandini N
Associate Professor,
Department of Computer Science and Engineering, Dr. Ambedkar Institute of Technology, Bengaluru, India.
Abstract - This study examines the effectiveness of ensemble learning methods, specifically bagging and boosting, for data augmentation and sentiment analysis of Amazon product evaluations. Businesses have to evaluate the sentiment of online reviews in order to understand their customers’ needs and develop their products. Sentiment analysis is difficult, though, due to the use of casual language and subtleties like slang and sarcasm. We investigate the comparative performance of ensemble learning models over individual models and investigate how resampling strategies can enhance the algorithms’ capacity to handle unseen data points through data augmentation. Our results show that in the sentiment categorization of Amazon shoe reviews, Gradient Boosting performs better than other ensemble learning models such as Random Forest and Ada Boost. By demonstrating the value of ensemble techniques and data augmentation for processing informallanguage,thisstudyadvancessentimentanalysis.
Key Words: Gradient Boosting, Random Forest, Ada Boost, Bagging,BoostingandEnsembleModel
Online reviews are now a priceless resource for both companies and customers. By the means of sharing consumer experiences and the provision of comprehensive product and service information, these evaluations assist prospective customers in making wellinformed selections. Businesses can gain important insights into consumer happiness, product strengths and shortcomings,andoverallbrandimpressionbyconducting sentiment analysis on internet reviews. Businesses can improve the way develop their products, target their marketing campaigns more effectively, and ultimately increasecustomerhappinessbycarefullyexaminingthese reviews.
Sentiment analysis of product evaluations on Amazon, however, poses a special difficulty. Due to the overwhelmingamount of casual language andevaluations thatusersfrequentlyuse,typicalmachinelearningmodels operate in a difficult context. Slang, irony, and conflicting feelingsfrequentlymaskthegenuinesentimentexpressed in a review, which can result in misunderstandings and imprecisesentimentanalysis.EventhoughGaussianNaive
Bayes, Random Forest Classifiers, Support Vector Machines, and Logistic Regression are strong machine learningalgorithms,theymayfinditdifficulttoaccurately capturethesesubtletiesinordertotackletheseissues,this work examines how well ensemble learning methods more especially, stacking work when combined with data augmentation to analyze sentiment in Amazon productevaluations.SinceAmazonproductreviewsareso common and have so much data available, we decided to concentrateonthem. Ourgoal istocreatea strongmodel that can reliably classify consumer sentiments and negotiate the complexity of informal language by analyzing sentiment in this big dataset. Our hypothesis is that ensemble learning can outperform individual models by leveraging the strengths of numerous models, so overcoming their limits. In addition, we investigate data augmentation using resampling methods to possibly strengthen the model’s capacity to handle unknown data pointsandincreasegeneralizability
This paper makes several significant contributions to the field of sentiment analysis. We start by discussing the unique difficulties involved in sentiment analysis of Amazon product reviews. Secondly, we demonstrate the potencyofensemblelearningcombinedwithstackingasa strongsolutiontotheseproblems.Third,weexaminehow data augmentation by resampling affects the model performance, offering important information about its possible advantages for this particular task. The rest of this paper will describe our all-inclusive methodology, show the outcomes of our trials, and evaluate the various models’performances.After that,we discuss ourfindings, examining how they might affect sentiment analysis of Amazonproductevaluationsandsuggestingpossiblelines ofinquiryforfuturestudy.
Sentiment analysis approaches are being studied by an increasing number of studies to better comprehend customerattitudesinonlineproductreviews.XingFanget al. in 2015 presented a general sentiment analysis procedureforthepurposeofcategorizingthesentimentof Amazonproductreviews.Promisingfindingsareobtained in this work that investigates sentiment polarity categorizationatthesentenceandreviewlevel[1].Xeenia
International Research Journal of Engineering and Technology (IRJET) e-ISSN: 2395-0056
Volume: 11 Issue: 07 | July 2024 www.irjet.net p-ISSN: 2395-0072
Singla et al. in 2017 examined sentiment analysis as a method for categorizing favorable or negative online product reviews. They demonstrate the efficacy of machine learning for sentiment categorization by comparing the results of Naive Bayes, Support Vector Machines, and Decision Trees on a dataset of more than 4,000reviews[2].Karthiyayini.Tetal.in2017introduced anewmethodcalled Senti,whichusesthecurrentnatural language processing APIs to parse and project the comparative accuracy levels in order to analyze the sentiments of Amazon product evaluations, particularly theMetadataset[3].
Chauhan et al. in 2017 investigates methods of summarizing product reviews using sentiment analysis. Their research demonstrates how feature-wise analysis maybeusedto produceunbiasedsummariesofcustomer sentiment from vast amounts of web reviews [4]. Rajkumar S. Jagdale et al. in 2018 used machine learning toanalyzesentimentanalysisofproductevaluationsonan Amazon dataset that included a variety of categories. In terms of camera reviews, their research shows that Naive Bayes has the best accuracy (98.17%), demonstrating the potency of machine learning in sentiment classification [5]. Ang Liu et al. in 2018 introduced a design framework forderivingcustomerdemandsfromtheanalysisofonline productreviews.Thisframeworkconvertsqualitativeuser feedbackintoquantitativeinsightsfordata-drivenproduct design decisions by fusing machine learning and design theory[6].RajeshBoseetal.in2018,examinedsentiment in more than 500,000 fine cuisine reviews on Amazon in 2018, in order to further understand customer behavior. Their research focuses on classifying emotions and pinpointing areas where product satisfaction might be raisedbyusingsentimentlexiconsandwordclouds[7].
Wassan et al. in 2021 presented a sentiment analysis method that concentrated on the attributes of the products mentioned in online reviews. Through their efforts, marketers can better understand customer preferences by extracting sentiment at the aspect level from Amazon reviews [8]. Bickey Kumar Shah et al. in 2021 used machine learning methods (Logistic Regression, Naive Bayes, Random Forest), in order to categorizereviewsasgood, neutral,ornegative.Based on theirfindings, RandomForest performsbetterinterms of sentiment classification accuracy than other techniques [9]. Arwa S. M. AlQahtani et al. in 2021 investigated sentimentanalysisofAmazonproductevaluationsusinga variety of text vectorization methods (Bag-of-Words, TFIDF, GloVe) and machine learning algorithms (Logistic Regression, Random Forest, Naive Bayes, Bi-directional LSTM,BERT).Theirresearchdemonstrateshowwelldeep learning techniques, such as BERT, function for online reviewsentimentclassification[10].
Byexploring ensemblelearning, inparticularbaggingand boosting, to improve robustness in capturing the subtletiesofinformallanguageseeninonlinereviews,this workaddsuniquenesstosentimentanalysis.Furthermore, we investigate how class imbalance problems frequently present in review datasets might be addressed by data augmentation using resampling approaches, which may resultinsentimentanalysismodelsthataremorebroadly applicable. This integrated strategy presents a novel way toimprovesentimentanalysisforunstructuredtextdata.
This section details the methods employed to analyze the customerreviews.
Customer reviews for shoes sold on Amazon UK are available in the Data.world database. It contains information that was scraped from the amazon site, such as the product name, reviewer name, review content, rating,andtimestampswith6823samples.
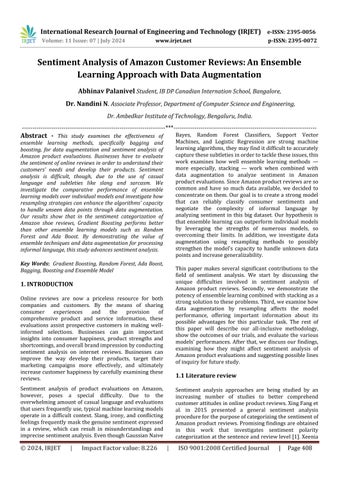
1) Data Preprocessing: Our first investigation of the data involvedfiguringoutitspropertiesanddistribution.Inall, 6823 samples were obtained. Fig 1 illustrates how the distribution of review ratings, which range from one to five stars, revealed the user’s opinion. In order to guarantee a clean dataset, we removed duplicate reviews and resolved missing values by adding up all of the null values in each review across the board. Stop words were removed to cut down on noise, and punctuation marks wereremovedtoconcentrateonthemainidea.
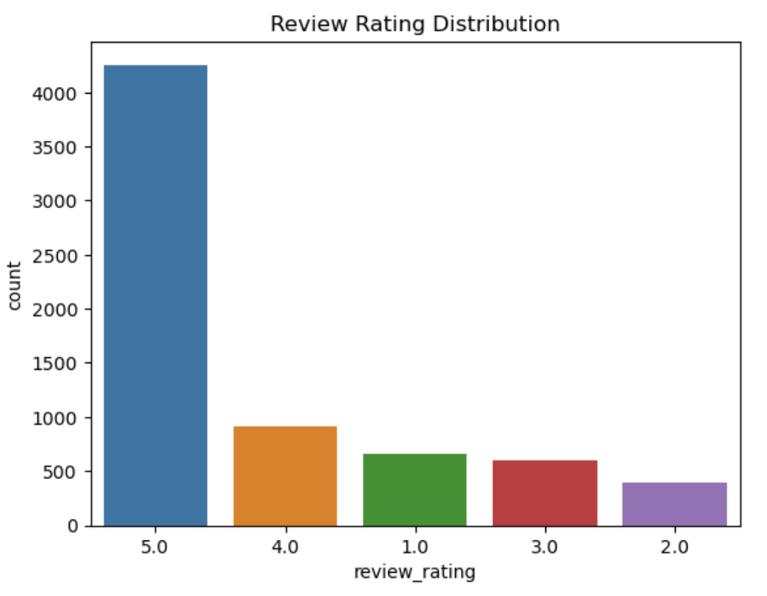
Fig -1: DistributionoftheReviewRating
International Research Journal of Engineering and Technology (IRJET) e-ISSN: 2395-0056
Volume: 11 Issue: 07 | July 2024 www.irjet.net p-ISSN: 2395-0072
Furthermore, since lemmatization takes into account the part of speech and offers a more accurate and nuanced representationofthetermsusedinthereviews,wechose it over stemming. For the reviews, it is used to normalize wordstotheirbaseformwhilemaintainingtheirintended meaning.Lastly,wecreatedawordcloud,asshowninFig 2 togetageneralideaoftheterminologyutilized.
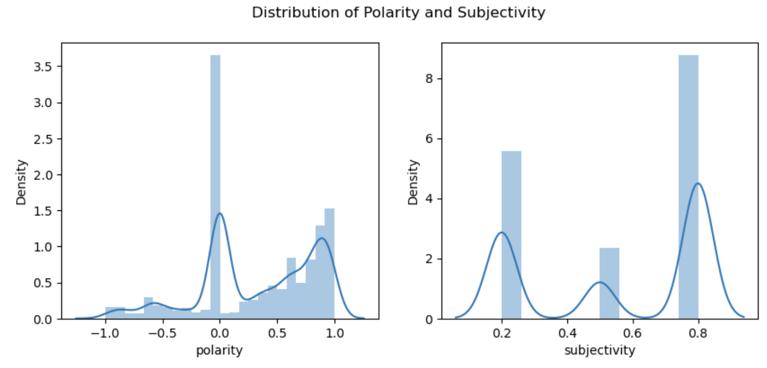
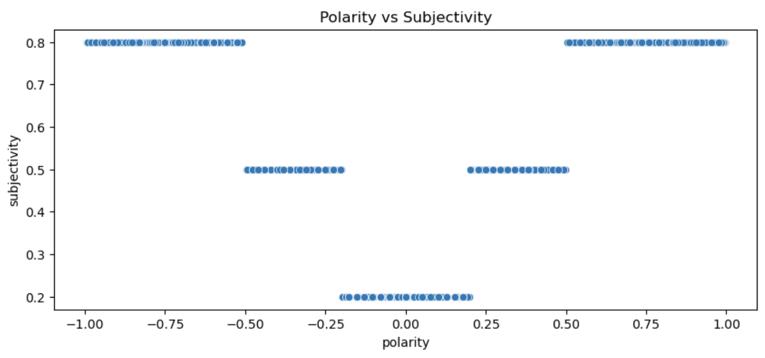
2) Sentiment Analysis: Sentiment analysis explores the textual data’s emotional undertone. There are two main components to it: polarity and subjectivity. If a statement conveyssentiments,views,orideasthatarenotsupported by facts, it is considered subjective. Conversely, polarity expresses the text’s general attitude, which might be neutral,positive,ornegative.
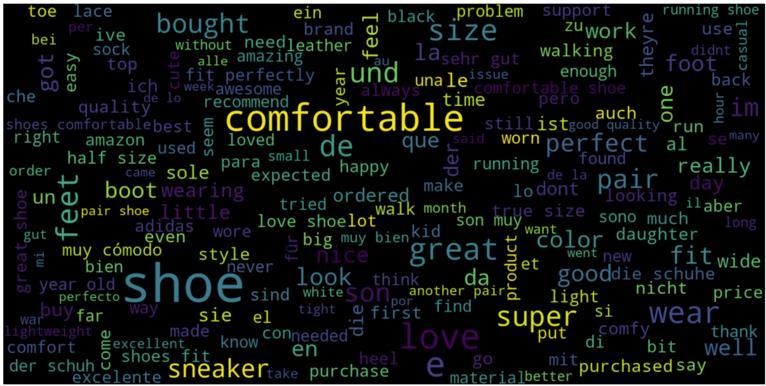
These are two closely related aspects. Subjective statements are generally more prone to positivity or negativity, whereas objective assertions, or facts, are usually impartial. Sentiment analysis offers a more thoroughunderstandingoftheemotionalundercurrentsin atextbyexaminingbothsubjectivityandpolarity.
Wefocusonthecompoundscore,whichisasinglefloatingpoint value ranging from -1 (most negative) to +1 (most positive). This score reflects the overall sentiment of the text. The polarity and subjectivity categories are used in this paper as per table I and II respectfully. We have visualized the density of the polarity and subjectivity for the reviews as in Fig 3 and the variation of polarity over subjectivityforthedatasetasinFig 4
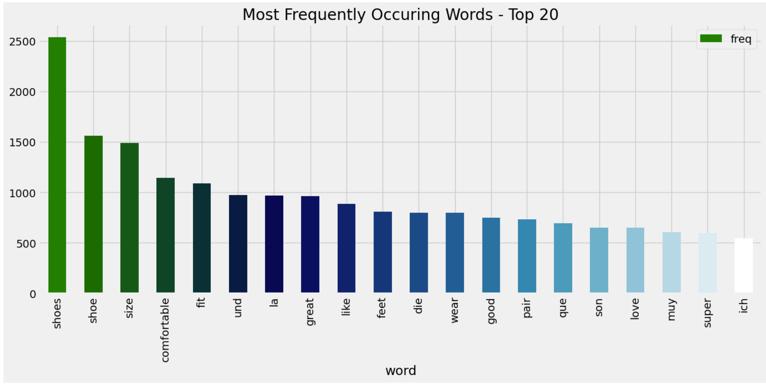
The lexical landscape of the text data is revealed by visualizing word frequencies and n-grams. Finding common keywords and maybe stopping words can be achievedbylookingatthemostusedwords.
Table -1: POLARITYCATEGORIZATION
CompoundScoreRange Polarity
Score=0 Neutral
0<Score≤0.3 Weakly Positive
0.3 <Score≤0.6 Positive
Score>0.6 StronglyPositive
0>Score≥-0.3 WeaklyNegative
-0.3>Score≥-0.6 Negative
Score<-0.6 StronglyNegative
Table -2: SUBJECTIVITYESTIMATION
AbsoluteCompoundScore Range SubjectivityScore
0≤abs(Score)≤0.2
0.2<abs(Score)≤0.5
Low(0.2)
Moderate(0.5) abs(Score)>0.5
High(0.8)
Wordswiththelowestfrequencymaycontainmistakesor jargons exclusive to a certain domain. Unigram analysis establishes the framework, while bigram and trigram analyses provide word combinations that reveal phrases, collocations, or even colloquial idioms. In this paper the most frequent words, least frequent words, unigrams, bigramsandtrigramsarevisualizedasinFig 5,6,7,8and 9respectively.
International Research Journal of Engineering and Technology (IRJET) e-ISSN: 2395-0056
Volume: 11 Issue: 07 | July 2024 www.irjet.net p-ISSN: 2395-0072
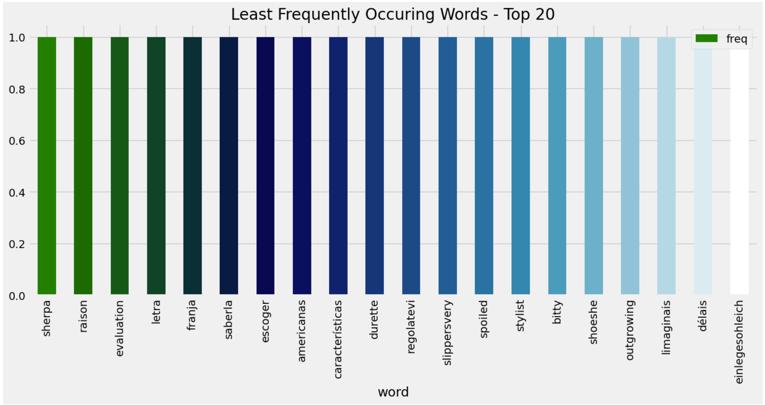
-6: LeastFrequentlyOccurringWords
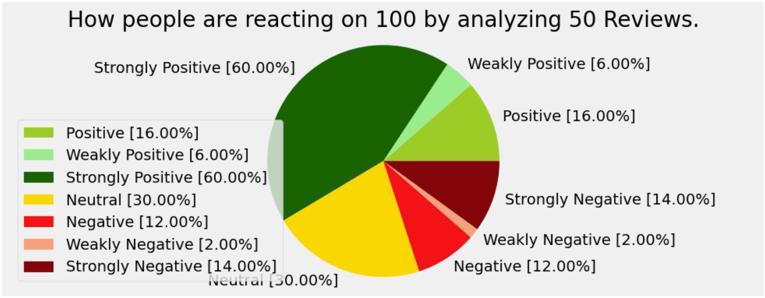
Also, based on a user-supplied search phrase, sentiment analysisisperformedonasetofreviews,andthefindings are shown in both a general sentiment category and a comprehensivepercentagebreakdownforeachsentiment type;itisvisualizedinFig 10.
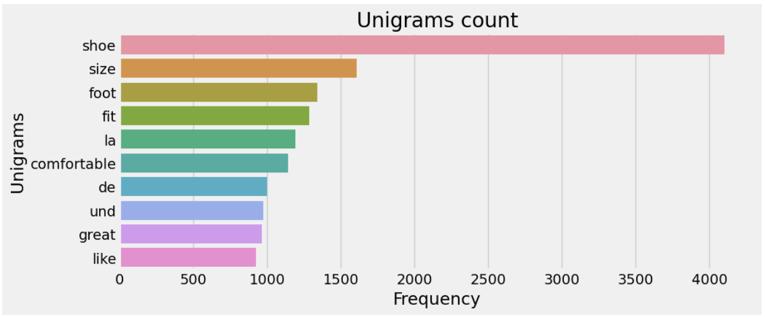
-7: Top20Unigrams
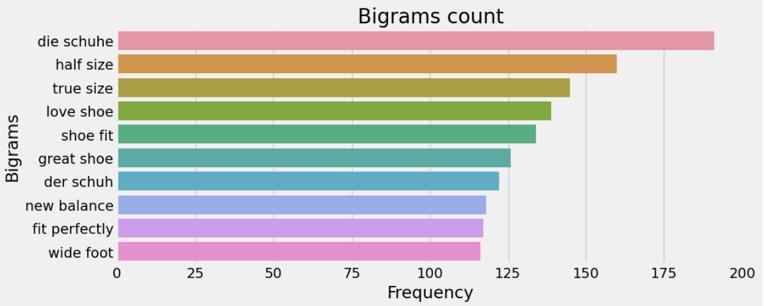
-8: Top20Bigrams
3) Vector Embeddings: Each review text is vectorized, or converted into a vector of integers, with each location potentially denoting a word or textual feature that has beentakenout.MethodssuchasTF-IDF(TermFrequencyInverse Document Frequency) take into account a word’s overallvalueacrossallreviewsinadditiontoitsfrequency inside a review. Machine learning algorithms can determine the similarities or distances between reviews once they are stored as vectors and estimates reviews withsimilarsentiments.
4)DataAugmentation:Thistechniqueincaseofimbalance in the classes. Here, we experimented with two methods namely, SMOTE (Synthetic Minority Oversampling Technique) and NearMiss (Under-sampling Technique) to address this problem and chose the best performing method to proceed further. The former effectively increasesitsrepresentationinthetrainingsetandreduces bias, thus improves the model’s learning of the minority class while the latter brings the size of the majority class closertothatoftheminorityclassbyremovingdatapoints fromit.Bydoingthis,themodelisnotoverloadedwiththe majority class and is free to concentrate on absorbing information from the less frequent class as well. The observationsarementionedinthetableIII.
5) Models: With its state-of-the-art performance across a range of tasks, ensemble methods have emerged as a key component of machine learning. Three well-known ensemble methods are given in this section: Ada Boost, GradientBoosting,andRandomForests.
Table -3
LABEL CLASS DISTRIBUTION Class OriginalDataset Over-Sampled UnderSampled
4255 4255 2568
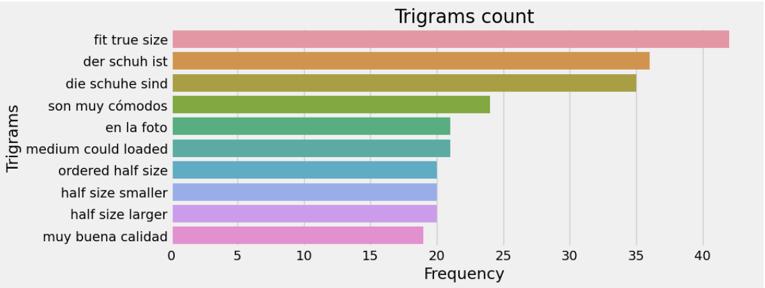
Fig -9: Top20Trigrams
Volume: 11 Issue: 07 | July 2024 www.irjet.net
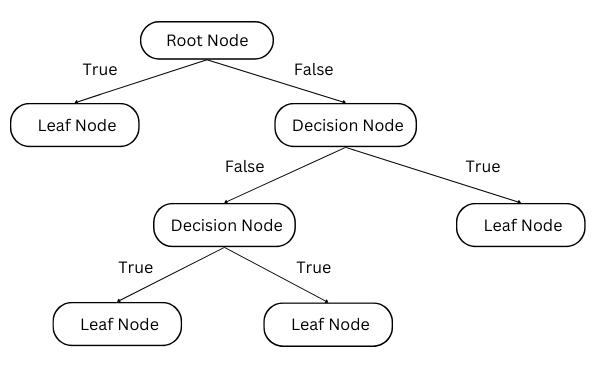
Decision Trees are supervised learning models that are nonparametric and generate predictions by repeatedly dividing the data according to attributes. The model chooses the feature and threshold that best divides the data into the target classes at each split. With each node representing a decision rule and the leaves representing thefinal classifications,this procedurecreatesa structure like a tree. Decision Trees are effective, but they can overfit, especially when working with high-dimensional data. Random Forests use bagging, or bootstrap aggregating,tosolvetheoverfittingproblemwithDecision Trees. Several Decision Trees are trained using this ensembletechniqueonarbitrarysubsetsofthedata(with replacement). Every tree learns a classification model on itsown,andthefinal predictionis produced byaveraging the individual forecasts (majority vote for classification, regressionbyaveraging,etc.).ComparedtosingleDecision Trees, Random Forests achieve better generalization and lower variance by utilizing the diversity of these independentlytrainedtrees.
Another effective ensemble techniquethat makesuse of a boosting strategy is Gradient Boosting. In contrast to bagging, which trains trees separately, boosting trains models in a sequential manner. The goal of each new model in the ensemble is to fix the mistakes produced by theonesbeforeit.Todothis,datapointsthattheprevious modelmisclassifiedaregivenlargerweights,whichforces the new model to focus more on those occurrences. They have the ability to handle complex datasets and provide better results. During the ensemble building process, a particular kind of boosting technique called Ada Boost dynamically modifies the weights of the data points. It aims to improve the categorization of previously misclassifiedinstances,muchtoGradientBoosting.
On the other hand, Ada Boost does this by direct manipulation of data point weights. Higher weights are applied to data points in the ensemble that have been repeatedly misclassified by earlier models, ensuring that learningfromthesedifficultcasesisgivenpriorityinlater models. Ada Boost is especially good at managing complicatedandnoisydatasets.
p-ISSN: 2395-0072
In the initial stage, the dataset with 6823 samples is preprocessed by removing stop-words and punctuation, dropping out the duplicate values, and handling the missing values. Vader Sentiment Lexicon uses sentiment intensityanalyzer toanalyzethesentimentofthereviews with polarity and subjectivity. Feature Engineering is performedbycreatingnewfeaturestoimprovethemodel performance like character count, word count, sentence length, polarity, subjectivity and word density for each of the 6823 customer reviews as shown in Fig 11. Also to avoid overfitting Synthetic Minority Oversampling Technique (SMOTE) is utilized to resample the data and equalizethesentimentdistribution.Inthispaper,Decision Tree Classifier, Random Forest Classifier, Ada Boost Classifier and Gradient Boost Classifier machine learning models are used to train the resampled data and get the desiredoutcomes.
All four models selected hyperparameters place equal emphasis on avoiding overfitting and striking a balance between model complexity. To ensure reproducibility throughouttraining,theyareall basedona randomstate, which is set to either 0 or 42. The default configurations areusedbyDecisionTree.Topreventoverfittingandlimit individual tree complexity, Random Forest uses 200 trees (growing in complexity) at a maximum depth of 10. Both Ada Boost and Gradient Boosting use 200 trees and a 0.1 learningrate.Theirabilitytounderstandintricatedecision limits is facilitated by this setup, and the smaller learning ratehelpsavoid huge updatesduring training,which may lessenoverfitting.
We used stratified train-test splitting to divide the preprocessed data (X resampled, Y resampled) into training and testing sets in order to assess the performance of our models. By preserving the class distribution in both sets, this method guarantees a more
International Research Journal of Engineering and Technology (IRJET) e-ISSN: 2395-0056
Volume: 11 Issue: 07 | July 2024 www.irjet.net p-ISSN: 2395-0072
reliable evaluation. To ensure reproducibility, we employed a random state of 42 and a test size of 20% (1702 samples). As a result, the following shapes were includedinthetrainingandtestingsets:
•Trainingset:Xtrain(6808samples,2500features),Y train(6808labels)
•Testingset:Xtest(1702samples,2500features),Ytest (1702labels)
This clarifies the data splitting process and provides detailsabouttheresultingsetsizesandcharacteristics.
Table -4
CLASSIFICATIONREPORTFORDECISIONTREECLASSIFIER
Precision is the percentage of anticipated positive cases that were actually positive, which is represented by this metric. Recall shows how well the model recognizes real positive cases. The F1-score provides a fair assessment of recallandprecision.Theprecision,recallandF1-scoreare shown in Table IV, V, VI and VII. This shows that the GradientBoostClassifier hasagoodnatureof recognizing thepositivecasesthantheothertwomodels.
International Research Journal of Engineering and Technology (IRJET) e-ISSN: 2395-0056
Volume: 11 Issue: 07 | July 2024 www.irjet.net p-ISSN: 2395-0072
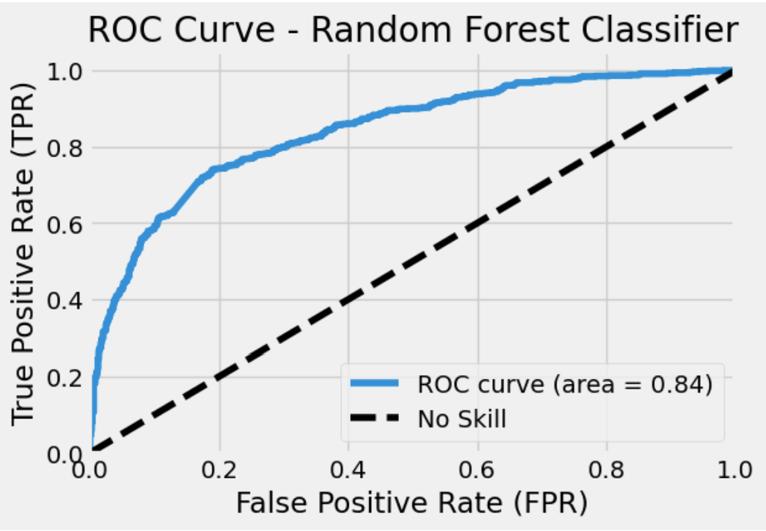
Table -5
CLASSIFICATIONREPORTFORRANDOMFOREST CLASSIFIERMODEL
Table -6
CLASSIFICATIONREPORTFORGRADIENTBOOST CLASSIFIERMODEL
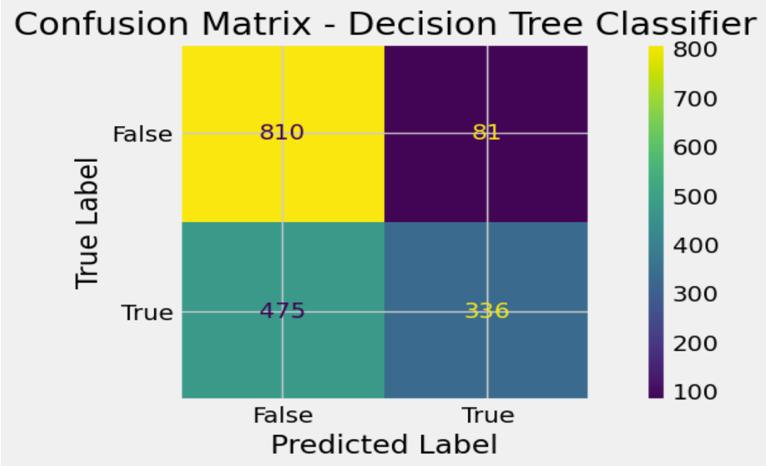
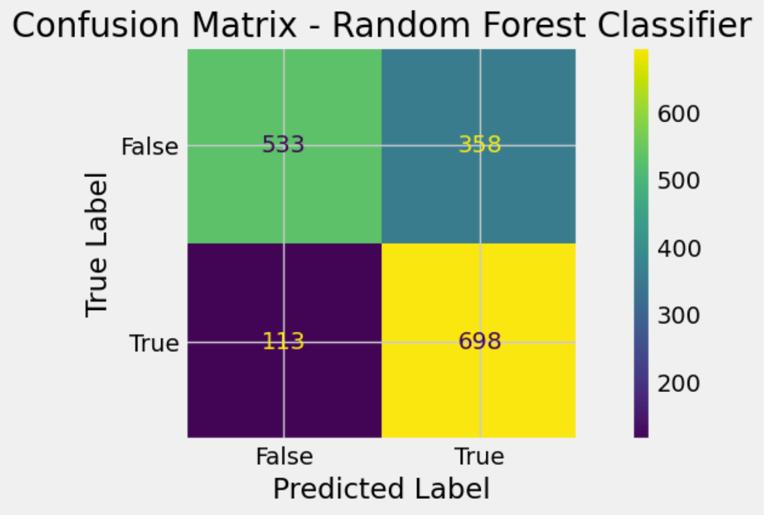
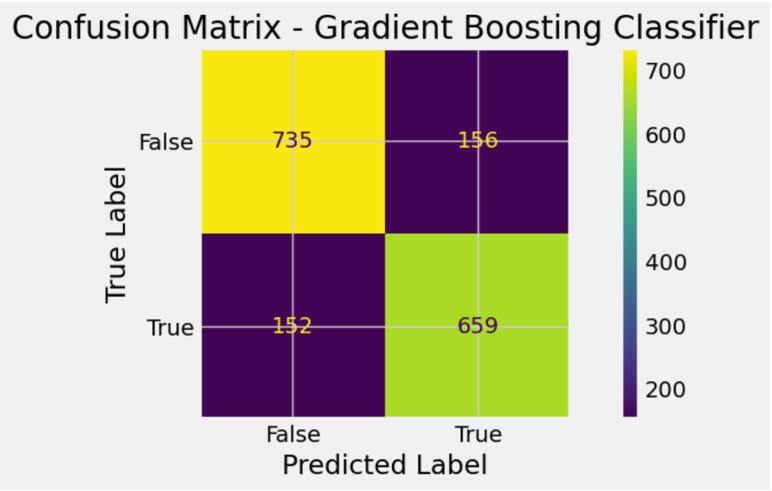
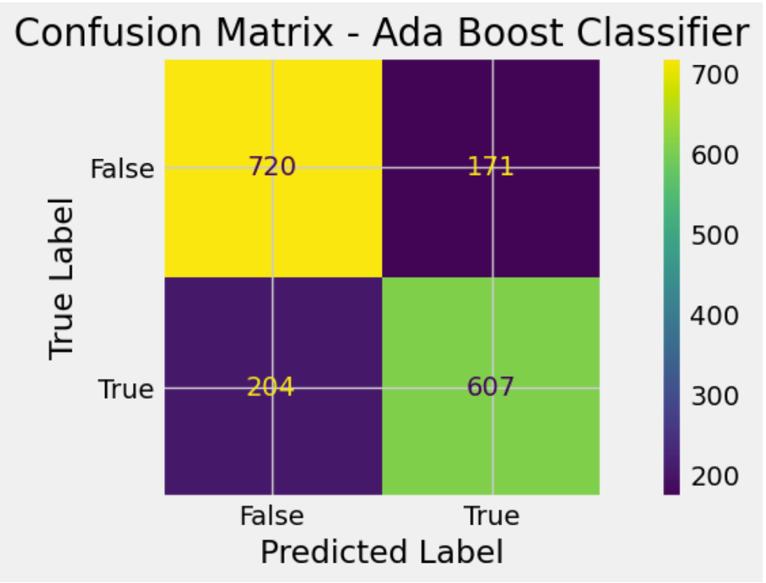
The testing accuracy is 67%, 72%, 82% and 78% for Decision Tree Classifier, Random Forest Classifier, Gradient Boost Classifier and Ada Boost Classifier respectivelyasshowninTableIV,VIandV.Theconfusion matrix is described in Fig 12, 14, 16 and 18 for the Decision Tree Classifier, Random Forest Classifier, Gradient Boost Classifier and Ada Boost Classifier
respectively. This tell us that the Decision Tree Classifier has (810 + 336 = 1146) correctly predicted values, the RandomForestClassifierhas(533+698=1231)correctly predicted values, the Gradient Boost Classifier has (735 + 659=1394)correctlypredictedvaluesand theAdaBoost Classifier has (720 + 607 = 1327) correctly predicted values. This shows Gradient Boost outperforms the other models
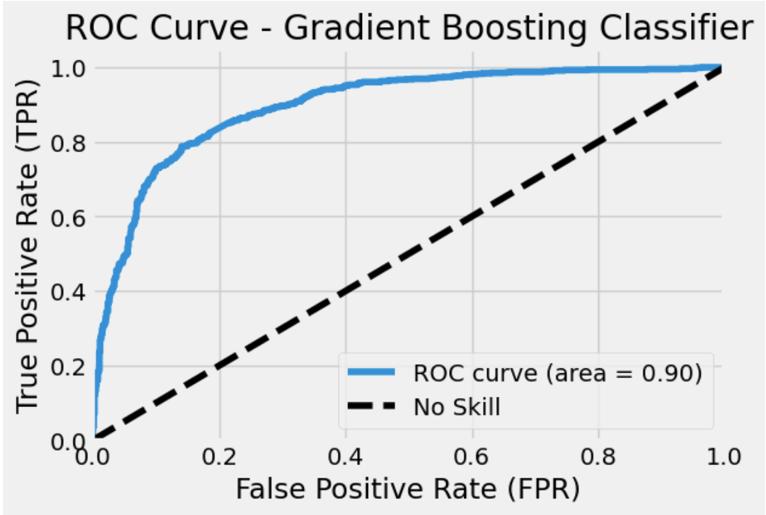
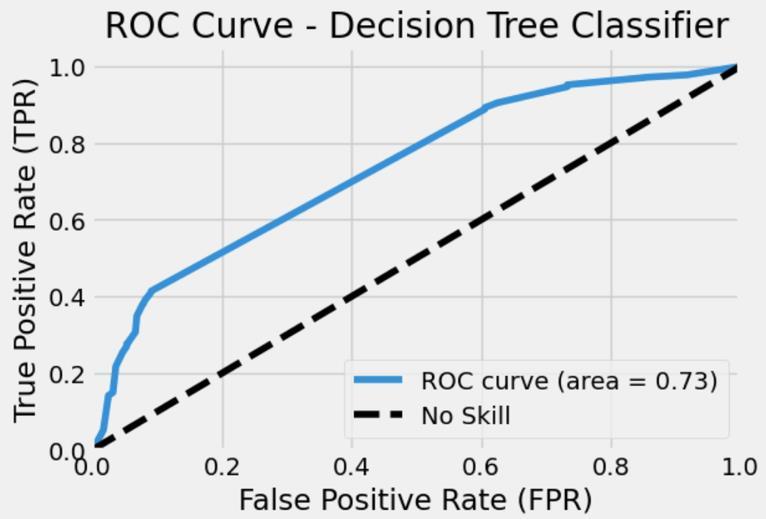
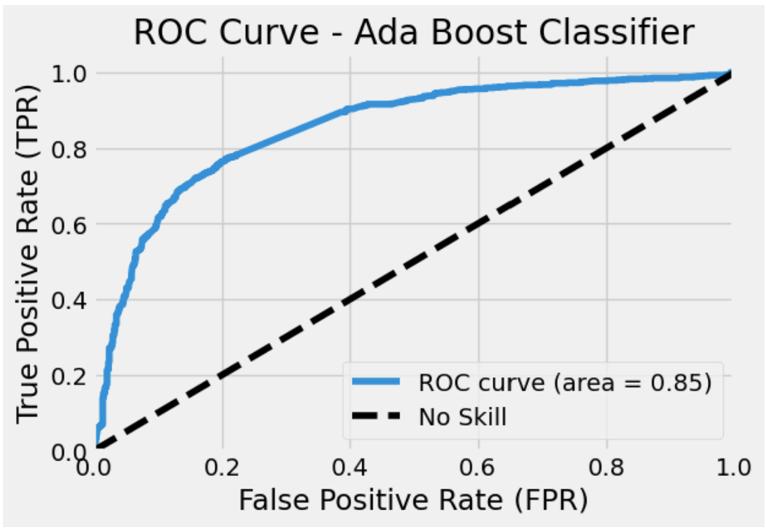
When assessing binary classification models, one popular performance indicator is the Receiver Operating Characteristic (ROC) AUC curve. The y-axis displays the True Positive Rate (TPR), while the x-axis displays the False Positive Rate (FPR). The classification model’s overallperformanceisshownbytheAUC(AreaUnderthe Curve).An AUC valueof0.90for GradientBoostClassifier shows that this model outperforms the Decision Tree Classifier, Random Forest Classifier and Ada Boost Classifier models with 0.73, 0.84 and 0.85 AUC values respectivelyasshowninFig13,15,17and19.
Thus overall, the ensembling of the Decision Tree Classifier where the residual error of the model is fed to
International Research Journal of Engineering and Technology (IRJET) e-ISSN: 2395-0056
Volume: 11 Issue: 07 | July 2024 www.irjet.net p-ISSN: 2395-0072
the second model in the sequence with a depth of 10 and with200.
Table -7
CLASSIFICATIONREPORTFOR
Estimatorsandalearningrateof0.1,alsocanbedescribed as Gradient Boost Classifier outperforms the other ensembling techniques of the Decision Tree Classifier, namely the Random Forest Classifier where a majority vote from each of the individual Decision Tree model is taken or the Ada Boost model where the weighted majority vote from each of the individual Decision Tree modelisconsidered.
Weperformedexploratorydataanalysisandidentifiedthe sentiment of the reviews with polarity and subjectivity. Forourbinaryclassificationjob,GradientBoostingproved to be the best ensemble classification model. It produced the highest F1-score and testing accuracy due to its balanced performance, which included good recall and precision for affirmative cases. This was validated by the confusion matrix and the ROC AUC curve, which showed howwellthemodeldistinguishedbetweentheclassesand could accurately detect both positive and negative cases. Even though Gradient Boosting showed encouraging results, more research might focus on hyper-parameter tuning to enhance the system even more and investigate different ensemble techniques or deep learning approaches to find areas where performance could be improved.
[1]X.Fangand J.Zhan, “Sentimentanalysisusingproduct reviewdata,”JournalofBigdata,vol.2,pp.1–14,2015.
[2]Z.Singla,S.Randhawa,andS.Jain,“Sentimentanalysis of customer product reviews using machine learning,” in 2017 International Conference on Intelligent Computing andControl(I2C2),2017,pp.1–5.
[3] T. Karthikayini and N. Srinath, “Comparative polarity analysis on amazon product reviews using existing machine learning algorithms,” in 2017 2nd International Conference on Computational Systems and Information Technology for Sustainable Solution (CSITSS). IEEE, 2017, pp.1–6.
[4] C. Chauhan and S. Sehgal, “Sentiment analysis on product reviews,” in 2017 International Conference on Computing, Communication and Automation (ICCCA). IEEE,2017,pp.26–31.
International Research Journal of Engineering and Technology (IRJET) e-ISSN: 2395-0056
Volume: 11 Issue: 07 | July 2024 www.irjet.net p-ISSN: 2395-0072
[5] R. S. Jagdale, V. S. Shirsat, and S. N. Deshmukh, “Sentiment analysis on product reviews using machine learning techniques,” in Cognitive Informatics and Soft Computing: Proceeding of CISC 2017. Springer, 2019, pp. 639–647.
[6]R.IrelandandA.Liu,“Applicationofdata analyticsfor product design: Sentiment analysis of online product reviews,” CIRP Journal of Manufacturing Science and Technology,vol.23,pp.128–144,2018.
[7] R. Bose, R. K. Dey, S. Roy, and D. Sarddar, “Sentiment analysis on online product reviews,” in Information and Communication Technology for Sustainable Development: ProceedingsofICT4SD2018.Springer,2020,pp.559–569.
[8] S. Wassan, X. Chen, T. Shen, M. Waqar, and N. Jhanjhi, “Amazon product sentiment analysis using machine learning techniques,” Revista Argentina de Cl´ınica Psicologica´,vol.30,no.1,p.695,2021.
[9] B. K. Shah, A. K. Jaiswal, A. Shroff, A. K. Dixit, O. N. Kushwaha, and N. K. Shah, “Sentiments detection for amazonproductreview,”in2021Internationalconference on computer communication and informatics (ICCCI). IEEE,2021,pp.1–6.
[10] A. S. AlQahtani, “Product sentiment analysis for amazon reviews,” International Journal of Computer Science & Information Technology (IJCSIT) Vol, vol. 13, 2021.