
International Research Journal of Engineering and Technology (IRJET) e-ISSN:2395-0056
Volume: 11 Issue: 06 | Jun 2024 www.irjet.net p-ISSN:2395-0072
International Research Journal of Engineering and Technology (IRJET) e-ISSN:2395-0056
Volume: 11 Issue: 06 | Jun 2024 www.irjet.net p-ISSN:2395-0072
Akash Vijayrao Chaudhari, Pallavi Ashokrao Charate
1. Abstract
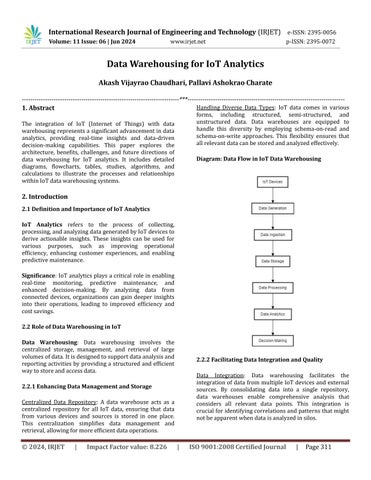
The integration of IoT (Internet of Things) with data warehousingrepresentsasignificantadvancementindata analytics, providing real-time insights and data-driven decision-making capabilities. This paper explores the architecture, benefits, challenges, and future directions of data warehousing for IoT analytics. It includes detailed diagrams, flowcharts, tables, studies, algorithms, and calculations to illustrate the processes and relationships withinIoTdatawarehousingsystems.
2.1 Definition and Importance of IoT Analytics
IoT Analytics refers to the process of collecting, processing,andanalyzingdatageneratedbyIoTdevicesto derive actionable insights. These insights can be used for various purposes, such as improving operational efficiency, enhancing customer experiences, and enabling predictivemaintenance.
Significance:IoTanalyticsplays acritical roleinenabling real-time monitoring, predictive maintenance, and enhanced decision-making. By analyzing data from connected devices, organizations can gain deeper insights into their operations, leading to improved efficiency and costsavings.
Data Warehousing: Data warehousing involves the centralized storage, management, and retrieval of large volumesofdata.Itisdesignedtosupportdataanalysisand reportingactivitiesbyprovidinga structuredandefficient waytostoreandaccessdata.
2.2.1
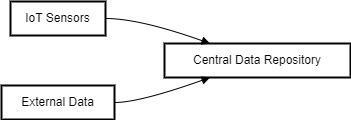
Centralized Data Repository: A data warehouse acts as a centralized repository for all IoT data, ensuring that data from various devices and sources is stored in one place. This centralization simplifies data management and retrieval,allowingformoreefficientdataoperations.
Handling Diverse Data Types: IoT data comes in various forms, including structured, semi-structured, and unstructured data. Data warehouses are equipped to handle this diversity by employing schema-on-read and schema-on-write approaches. This flexibility ensures that allrelevantdatacanbestoredandanalyzedeffectively.
2.2.2
Data Integration: Data warehousing facilitates the integrationof data frommultipleIoT devicesand external sources. By consolidating data into a single repository, data warehouses enable comprehensive analysis that considers all relevant data points. This integration is crucialforidentifyingcorrelationsandpatternsthatmight notbeapparentwhendataisanalyzedinsilos.
International Research Journal of Engineering and Technology (IRJET) e-ISSN:2395-0056
Volume: 11 Issue: 06 | Jun 2024 www.irjet.net p-ISSN:2395-0072
EnsuringDataQuality:TheETL(Extract,Transform,Load) processes used in data warehousing ensure that data is clean, consistent, and high-quality. These processes involve data cleaning to remove inaccuracies, data transformation to ensure consistency, and data loading to store it efficiently. High-quality data is essential for accurateanalysisanddecision-making.
Table: ETL Process in Data Warehousing Process Description Importance
Extract Collecting data from various IoT devices and sources
Ensures all relevant dataiscaptured
TransformCleaning and formatting dataforconsistency
Enhances data quality andusability
Load Storing transformed data inthedatawarehouse
Provides structured data ready for analysis
Table: Types of Analytics and Their Applications Type of Analytics Description Example Application
Descriptive Analytics Analyzing historical data tounderstandtrends Sales performance reports
Predictive Analytics Using historical data to predictfutureoutcomes Demand forecasting
Prescriptive Analytics Recommending actions basedondatainsights Inventory optimization
2.2.3
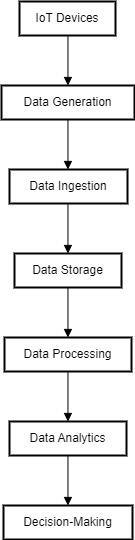
SupportforAdvancedAnalytics:Datawarehousesprovide the foundation for advanced analytics, including descriptive, predictive, and prescriptive analytics. By storinglargevolumesofhistoricalandreal-timedata,data warehouses enable the application of sophisticated analytics techniques to uncover patterns, predict future trends,andrecommendoptimalactions.
Real-TimeandBatchProcessing:Datawarehousessupport both real-time and batch data processing, allowing organizations to analyze data as it is generated or in scheduledintervals.Thisdualcapabilityensuresthatboth immediate and historical data can be used for comprehensiveanalysis.
Diagram: Analytics Capabilities in Data Warehousing
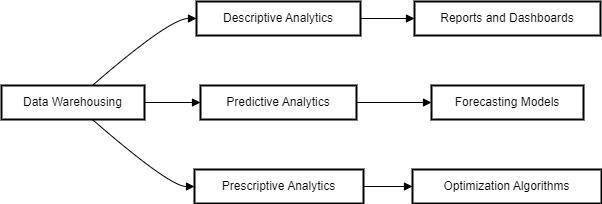
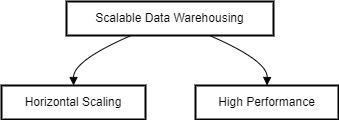
Scalability: Data warehouses are designed to scale horizontally, allowing them to handle increasing volumes of IoT data efficiently. This scalability is essential for managing the ever-growing amount of data generated by IoT devices and ensuring that the infrastructure can accommodatefuturegrowth.
High Performance: Data warehouses are optimized for highperformance,enablingfastqueryresponsetimeseven with large datasets. This performance is crucial for realtime analytics and decision-making, where timely insights arecritical.
Diagram: Scalability and Performance in Data Warhousing
DataSecurity:EnsuringthesecurityofIoTdataisacritical role of data warehousing. Data warehouses employ various security measures, including encryption, access control, and auditing, to protect sensitive data from unauthorizedaccessandbreaches.
International Research Journal of Engineering and Technology (IRJET) e-ISSN:2395-0056
Volume: 11 Issue: 06 | Jun 2024 www.irjet.net p-ISSN:2395-0072
Regulatory Compliance: Data warehouses help organizations comply with regulatory standards by providing mechanisms for data auditing, tracking, and reporting. Compliance with regulations such as GDPR, HIPAA, and CCPA is crucial for organizations handling sensitive IoT data, and data warehousing provides the necessarytoolstoensureadherencetotheseregulations.
Table: Security Measures in Data Warehousing
Security Measure Description Importance
Encryption
Access Control
Encryptingdataatrest andintransit Protects data from unauthorizedaccess
Implementing strict access controls and policies Ensures only authorized users can accessdata
Auditing Tracking data access andmodifications Provides accountability and compliance
2.2.6 Support for Real-Time Decision-Making
Real-TimeDataProcessing:Datawarehousessupportrealtime data processing, enabling organizations to gain immediate insights and respond quickly to changes and events. This capability is critical for applications such as real-time monitoring, anomaly detection, and predictive maintenance.
Operational Dashboards: By integrating with data visualization tools, data warehouses provide real-time dashboards that display key metrics, trends, and anomalies. These dashboards help stakeholders make informed decisions promptly, improving operational efficiencyandreducingdowntime.
Diagram: Real-Time Decision-Making Process
Table: Real-Time Decision-Making Applications
Application Description Example
Real-Time Monitoring
Continuous monitoring of IoT devices and systems Monitoring equipment status infactories
Anomaly Detection Identifying unusual patternsorbehaviors Detecting anomalies in sensordata
Predictive Maintenance Predicting equipment failures to schedule maintenance Proactively maintaining machinery
Data Sharing and Collaboration: Data warehouses enable data sharing and collaboration across different departmentsandstakeholders.Byprovidingaunifiedview of data, data warehouses facilitate better communication and collaboration, leading to more cohesive and informed decision-making.
Driving Innovation: Access to comprehensive and highquality data from data warehouses drives innovation by enabling data scientists and analysts to experiment with new models, algorithms, and approaches. This fosters a cultureofcontinuous improvementandinnovationwithin organizations.
Table: Collaborative and Innovative Applications
Application Description Example
CrossDepartmental Collaboration
Research and Development
Continuous Improvement
Facilitating data sharing across departments Collaborative projects leveraging shareddata
Enabling advanced research and developmentefforts Developing new predictivemodels
Fostering a culture of continuous improvement
Iterative enhancements based on data insights
Personalized Services: By analyzing IoT data, organizationscangaininsightsintocustomerbehaviorand
International Research Journal of Engineering and Technology (IRJET) e-ISSN:2395-0056
Volume: 11 Issue: 06 | Jun 2024 www.irjet.net p-ISSN:2395-0072
preferences, enabling them to offer personalized services andimprove customer experience. Data warehousesstore and process this data, making it available for detailed analysisandactionableinsights.
Customer Feedback Analysis: Data warehouses allow for the integration of customer feedback from various channels, such as social media, surveys, and support interactions. Analyzing this feedback helps organizations understand customer needs and address issues proactively.
Table: Customer Experience Enhancement Applications
Application
Description
Example
Personalized Marketing Tailoring marketing efforts based on customerdata Targeted promotions based onpreferences
Proactive Support Addressing issues beforetheyescalate Predicting and resolving potential problems
Service Optimization Enhancing services based on customer feedback Improving product features based on feedback
3. Architecture of Data Warehousing for IoT Analytics
3.1 Components of IoT Data Warehousing
3.1.1 Data Sources
IoT Devices: These are the primary sources of data in an IoT ecosystem. They include sensors, actuators, and other smartdevicesthatcollectandtransmitdata.
Sensors:Devicesthatdetectandrespondtoinput from the physical environment, such as temperature sensors, humidity sensors, and pressuresensors.
Actuators:Devicesthatperformactionsbasedon inputdata,suchasmotors,valves,andrelays.
Smart Devices: Equipment with embedded sensorsandactuators,such assmartthermostats, smartappliances,andindustrialmachines.
External Data: In addition to IoT devices, data from external sources such as weather data, social media, and
other relevant data streams can be integrated to provide additionalcontextandinsights.
Weather Data: Information on weather conditions, which can impact various IoT applications like agriculture, transportation, and energymanagement.
Social Media Data: User-generated content from social networks, which can be used for sentiment analysis, trend detection, and marketing strategies.
Other Data Streams: Additional relevant data sources, such as traffic data, financial data, and environmental data, which can enhance the analysisandprovidedeeperinsights.
ETL Processes: Extract, Transform, Load (ETL) processes areusedtoextractdatafromvarioussources,transformit intoasuitableformat,andloaditintothedatawarehouse. This ensures that the data is clean, consistent, and ready foranalysis.
Extract: Data is extracted from various IoT devicesandexternalsources.
Transform: Data is cleaned, formatted, and transformedtoensureconsistencyandquality.
Load: Transformed data is loaded into the data warehouseforstorageandanalysis.
Real-time Streaming: Technologies such as Apache Kafka and Apache Flink enable real-time data streaming, allowingdatatobeprocessedandanalyzedassoonasitis generated.
Apache Kafka: A distributed streaming platform thatcanhandlereal-timedatafeeds,ensuringhigh throughputandfaulttolerance.
Apache Flink: A stream processing framework that provides low-latency processing and advancedevent-timesemantics.
International Research Journal of Engineering and Technology (IRJET) e-ISSN:2395-0056
Volume: 11 Issue: 06 | Jun 2024 www.irjet.net p-ISSN:2395-0072
Flowchart: Data Ingestion Process
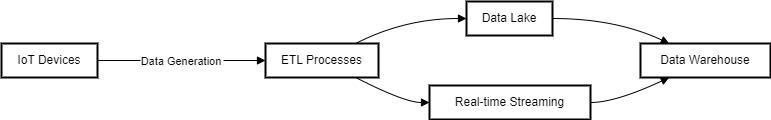
Table: Data Ingestion Tools Comparison
Tool Type Key Features Use Cases
Apache Kafka Realtime High-throughput, fault-tolerant Real-time data streaming
Apache Flink Realtime Stream processing, low-latency Real-time analytics
Talend ETL GUI-based, data integration Batch data processing
Informatica ETL Data integration, dataquality Datawarehousing
3.1.3
DataLakes:DatalakesareusedtostorerawIoTdatainits native format. This allows for flexible data storage and providestheabilitytostorelargevolumesofunstructured data.
Raw Data Storage: Data lakes can store raw, unprocessed data, allowing for flexible data explorationandmachinelearningapplications.
Scalability: Data lakes can scale horizontally to accommodatelargevolumesofdatafrommultiple sources.
Schema-on-Read: Data schema is applied at the time of data reading, providing flexibility in data storageandprocessing.
Data Warehouses: Data warehouses store structured data that has been processed and organized for efficient querying and analysis. They are optimized for analytical workloadsandsupportcomplexqueries.
Structured Data Storage: Data warehouses store structured and processed data, ensuring high performanceforanalyticalqueries.
Schema-on-Write: Data schema is applied at the time of data writing, ensuring consistency and qualityofstoreddata.
Optimized for Analytics: Data warehouses are designed to support complex analytical queries andreportingneeds.
Table: Comparison of Data Storage Options
Feature Data Lakes Data Warehouses
DataType Raw, unstructured, semi-structured Structured
Schema Schema-on-read Schema-on-write
UseCases Data exploration, machinelearning Business intelligence, reporting
Cost Lower Higher
PerformanceVariable, depends on querytype Optimized for complexqueries
Batch Processing: Batch processing frameworks such as Hadoop and Spark are used to process large volumes of data in batches. This is suitable for processing historical dataandperformingcomplexanalytics.
Hadoop: A distributed storage and processing framework that handles large-scale batch data processing.
Spark: An in-memory processing framework that provides fast batch processing and advanced analyticscapabilities.
StreamProcessing:Streamprocessingframeworkssuchas FlinkandStormenablereal-timedataprocessing,allowing forimmediateanalysisandresponsetodataasitarrives.
Flink: A stream processing framework that provides low-latency and stateful processing for real-timedatastreams.
Storm: A real-time processing framework that is fault-tolerant and capable of handling highthroughputdatastreams.
International Research Journal of Engineering and Technology (IRJET) e-ISSN:2395-0056
Volume: 11 Issue: 06 | Jun 2024 www.irjet.net p-ISSN:2395-0072
Diagram: Data Processing Flow.
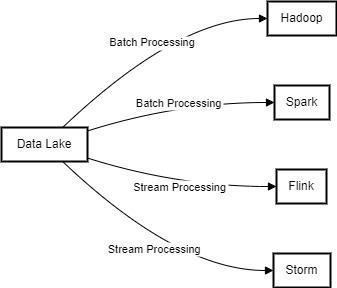
Table: Data Processing Frameworks Comparison FrameworkType Key Features Use Cases
Hadoop Batch Processing Distributed storage and processing Large-scale batch data processing
Spark Batch Processing In-memory processing,fast Batchanalytics
Flink Stream Processing Low-latency, stateful processing Real-time data streaming
Storm Stream Processing Fault-tolerant, real-time processing Real-time analytics
3.1.5 Data Analytics
Descriptive Analytics: Descriptive analytics involves analyzing historical data to understand trends and patterns. This is typically done using dashboards and reports.
Trend Analysis: Identifying patterns and trends inhistoricaldatatounderstandpastperformance.
Summary Statistics: Providing summary statistics such as mean, median, and standard deviationtodescribedatacharacteristics.
Dashboards: Interactive visualizations that provide real-time insights into key metrics and performanceindicators.
Predictive Analytics: Predictive analytics uses machine learning models to predict future outcomes based on historical data. This can be used for applications such as predictivemaintenanceanddemandforecasting.
Machine Learning Models: Algorithms such as regression, classification, and clustering used to predictfutureoutcomes.
Predictive Maintenance: Using historical data to predict equipment failures and schedule maintenanceproactively.
Demand Forecasting: Predicting future demand forproductsandservicesbasedonhistorical data andmarkettrends.
Prescriptive Analytics: Prescriptive analytics involves usingoptimizationmodelstorecommendactionsbasedon data insights. This helps organizations make data-driven decisionsandoptimizetheiroperations.
Optimization Models: Algorithms such as linear programming and genetic algorithms used to recommendoptimalactions.
Decision Support: Providing actionable recommendations to decision-makers based on datainsights.
Operational Optimization: Using prescriptive analyticstooptimizeoperations,reducecosts,and improveefficiency.
Table: Data Analytics Types and Tools
Analytics Type Description Tools
Descriptive Analytics Historical data analysis, trend identification Tableau, Power BI, QlikView
Predictive Analytics Forecasting future outcomes using ML models Python (Scikitlearn, TensorFlow), R
Prescriptive Analytics Optimization and decisionsupport Gurobi,IBMCPLEX
3.1.6
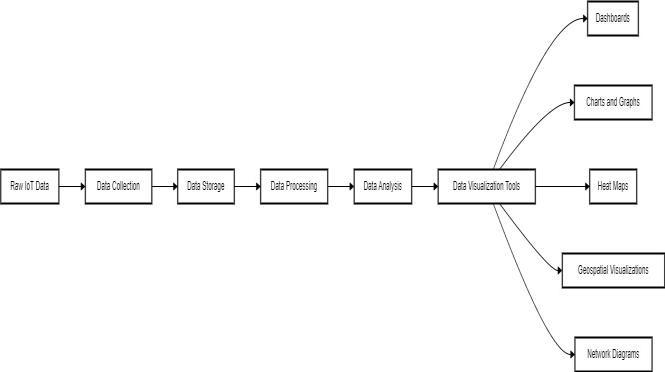
Tools: Data visualization tools suchas Tableau and Power BI are used to create interactive dashboards and visualizations, making it easier to explore and understand datainsights.
International Research Journal of Engineering and Technology (IRJET) e-ISSN:2395-0056
Volume: 11 Issue: 06 | Jun 2024 www.irjet.net p-ISSN:2395-0072
Tableau: A powerful data visualization tool that allows users to create interactive and shareable dashboards.
Power BI: A business analytics tool by Microsoft that provides interactive visualizations and businessintelligencecapabilities.
Importance: Data visualization transforms raw data into visual stories that highlight trends, outliers, and patterns, facilitatingquickerandmoreaccuratedecision-making.
Enhanced Understanding: Simplifies complex data sets, making it easier to understand and interpret.
Improved Decision-Making: Provides a clear view of data trends and anomalies, aiding in quickerandmoreinformeddecisions.
Engagement: Interactive dashboards engage users, encouraging exploration and deeper analysis.
Collaboration: Facilitates better communication and collaboration across teams by providing a commonvisuallanguage.
Table: Common Data Visualization Tools and Features
Tool Key Features Use Cases
Tableau Interactive dashboards, real-timedataupdates Business intelligence, real-timemonitoring
Power BI Integration with Microsoft products, AI features Reporting,datasharing
Qlik Sense Associativedataindexing, self-serviceBI
Data discovery, ad-hoc analysis
D3.js Customizable visualizations, opensource Web-based interactive visualizations
Grafana Real-time monitoring, open-source
Time-series analytics, monitoring
Diagram: Data Visualization Process in IoT Data Warehousing
Example: Dashboard Layout for IoT Data Monitoring
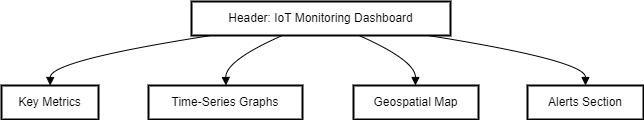
IoTDashboardComponents:
Header: Displaying the title,date,andtime of the lastupdate.
Key Metrics: Highlighting critical KPIs such as devicestatus,datathroughput,andalertcounts.
Time-Series Graphs: Showing trends over time formetricsliketemperature,humidity,andpower consumption.
Geospatial Map: Visualizing the location of IoT devicesandassociatedmetrics.
Alerts Section: Highlighting current alerts and anomaliesdetectedinthesystem.
4. Benefits of IoT Data Warehousing
4.1 Real-Time Data Processing
Speed:Theabilitytoprocessandanalyzedatainreal-time allows organizations to gain immediate insights and respondquicklytochangesandevents.
Scalability:IoTdatawarehousingsolutionsaredesignedto scale horizontally, allowing them to handle large volumes ofdataefficiently.
International Research Journal of Engineering and Technology (IRJET) e-ISSN:2395-0056
Volume: 11 Issue: 06 | Jun 2024 www.irjet.net p-ISSN:2395-0072
Predictive Maintenance: By analyzing data from IoT devices, organizations can predict equipment failures and performmaintenanceproactively,reducingdowntimeand maintenancecosts.
Operational Efficiency: IoT data warehousing enables organizations to monitor and optimize their operations in real-time,leadingtoincreasedefficiencyandcostsavings.
Data Integration: Data warehousing solutions enable the integration of data from various sources, providing a unifiedviewofthedata.
DataQuality:ETLprocessesensurethatthedatastoredin thedatawarehouseisclean,consistent,andofhighquality, enablingaccurateanalysisandreporting.
Table: Key Benefits and Examples
Benefit Description Example
Real-Time Processing Immediate insights andquickresponse Monitoring equipmentstatus
Predictive Maintenance Predicting failures to reducedowntime Predicting machine breakdowns
Operational Efficiency Optimizing processes for cost savings Reducing energy consumption
Data Integration Unified view from multiplesources Combining sensor datawithweather
DataQuality Ensuring accuracy andconsistency Cleaning data for reliablereports
5.1 Data Volume and Velocity
Big Data: IoT devices generate massive amounts of data, making it challenging to store and manage the data efficiently.
Data Storage: Storing large volumes of data requiresscalablestoragesolutionsthatcanhandle theincreasingdatasize.
Data Processing: Processing high-velocity data streams requires robust processing frameworks thatcanensurelowlatencyandhighthroughput.
Real-Time Processing: Ensuring low latency in data processing and analysis is critical for real-time decisionmakingbutcanbetechnicallychallenging.
Low Latency: Achieving low latency in data processing is essential for real-time applications, suchasmonitoringandalerting.
High Throughput: Maintaining high throughput while processing real-time data streams is crucial tohandlethelargevolumeofincomingdata.
Diverse Data Types: IoT data can be structured, semistructured,orunstructured,makingitcomplextointegrate andanalyze.
Structured Data:Datathatisorganizedintofixed formats,suchasrelationaldatabases.
Semi-Structured Data: Data that has some organizational properties, but does not fit into fixedformats,suchasJSONandXML.
Unstructured Data: Data that lacks any organizational properties, such as text, images, andvideos.
Data Integration: Combining data from heterogeneous sources can be difficult and requires robust data integrationframeworks.
Data Transformation: Converting data from various formats into a common format for integrationandanalysis.
Data Harmonization: Ensuring consistency and quality of data from different sources to enable accurateanalysis.
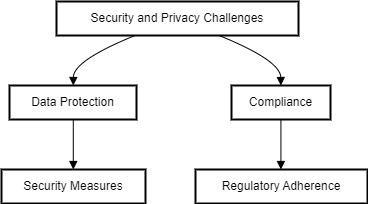
Data Protection: Ensuring the security and privacy of IoT data is critical, especially when dealing with sensitive information.
Data Encryption: Encrypting data at rest and in transittoprotectagainstunauthorizedaccess.
International Research Journal of Engineering and Technology (IRJET) e-ISSN:2395-0056
Volume: 11 Issue: 06 | Jun 2024 www.irjet.net p-ISSN:2395-0072
Access Control: Implementing strict access control policies to ensure that only authorized userscanaccessthedata.
Compliance: Organizations must adhere to regulatory standards and ensure that their data warehousing solutionscomplywithdataprotectionregulations.
Regulatory Compliance: Ensuring compliance with data protection regulations such as GDPR, HIPAA,andCCPA.
Data Auditing: Implementing auditing mechanisms to track data access and usage to ensurecompliance.
StorageCosts:ThecostofstoringlargevolumesofIoTdata can be high, especially when dealing with high-resolution sensordataandlong-termstoragerequirements.
High-Resolution Data: Storing high-resolution sensor data requires significant storage capacity, leadingtoincreasedcosts.
Long-Term Storage:Storingdataforlongperiods requiresdurableandscalablestoragesolutions.
ProcessingCosts:Real-timeprocessingcapabilitiesrequire significant computational resources, leading to high infrastructurecosts.
Computational Resources: Real-time data processing requires powerful computational resourcestohandlethedataloadefficiently.
Cost Optimization: Implementing cost optimization strategies to reduce infrastructure costswhilemaintainingperformance.
Table: Challenges and Mitigation Strategies
Challenge Description Mitigation Strategy
DataVolume High storage needs formassivedata
Use scalable storage solutions
DataVelocity Need for low-latency processing Implement edge computing
DataVariety Integration of diversedatatypes Use flexible ETL tools
Security and Privacy Ensuring data protection and compliance Employ robust securitymeasures
Infrastructure Costs High costs for storage and processing Optimize resource usage and cloud options
6.1 Overview
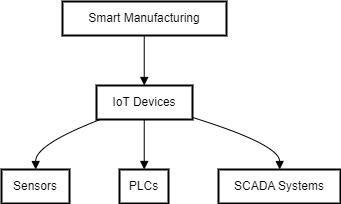
Smart Manufacturing: Smart manufacturing involves the useofIoTdevicesto monitorandoptimizemanufacturing processes.Thisincludescollectingdatafromsensors,PLCs (Programmable Logic Controllers), and SCADA (SupervisoryControlandDataAcquisition)systems.
Sensors: Devices that collect data on various parameters such as temperature, humidity, and pressure.
PLCs: Programmable logic controllers that automate industrial processes by receiving data fromsensorsandexecutingcontrolcommands.
SCADA Systems: Supervisory control and data acquisition systems that monitor and control industrialprocesses.
Diagram: Smart Manufacturing Overview
International Research Journal of Engineering and Technology (IRJET) e-ISSN:2395-0056
Volume: 11 Issue: 06 | Jun 2024 www.irjet.net p-ISSN:2395-0072
Data Sources: In a smart manufacturing setup, data is collected from various sensors, PLCs, and SCADA systems deployedacrossthemanufacturingfloor.
Temperature Sensors: Measure and monitor temperature levels in different parts of the manufacturingprocess.
Pressure Sensors: Monitor pressure levels in machineryandpipelines.
Humidity Sensors: Track humidity levels to ensure optimal conditions for manufacturing processes
Data Ingestion: Real-time streaming technologies such as Apache Kafka are used to ingest data from these sources andstreamittothedataprocessingpipeline.
Apache Kafka: Used for real-time data ingestion, ensuringhighthroughputandfaulttolerance.
Stream Processing:Dataisprocessedinreal-time toidentifyanomaliesandtriggeralerts.
DataStorage:Adatalakeisusedtostorerawdata,whilea data warehouse is used to store structured data that has beenprocessedandorganizedforanalysis.
Data Lake: Stores raw sensor data, providing a flexible storage solution for large volumes of unstructureddata.
Data Warehouse: Stores structured data that has been processed and organized for efficient queryingandanalysis.
Data Analytics: Predictive analytics models are used to predict equipment failures and optimize manufacturing processes. Operational data is analyzed to identify inefficienciesandimproveproductionefficiency.
Predictive Maintenance: Using historical data to predict equipment failures and schedule maintenanceproactively.
Process Optimization: Analyzing operational data to identify bottlenecks and optimize manufacturingprocesses.
Visualization: Real-time dashboards are used to visualize the data and provide actionable insights to manufacturing operatorsandmanagers.
Dashboards: Interactive visualizations that provide real-time insights into key metrics and performanceindicators.
Alerts: Highlighting current alerts and anomalies detectedinthesystem.
Efficiency: By using IoT data warehousing, smart manufacturing systems can improve production efficiency andreducedowntime.
Reduced Downtime: Predictive maintenance reduces unexpected equipment failures and minimizesdowntime.
Optimized Processes: Real-time data analytics enable continuous process optimization, leading toincreasedefficiency.
Cost Savings: Predictive maintenance and operational optimization lead to significant cost savings by reducing maintenancecostsandimprovingresourceutilization.
Maintenance Costs: Proactive maintenance reduces the need for costly repairs and extends thelifespanofequipment.
Resource Utilization: Optimizing resource utilization leads to reduced waste and lower operationalcosts.
Flowchart: Smart Manufacturing Data Flow
Table: Smart Manufacturing Benefits
Benefit Description Example
Increased Efficiency Optimized production processes Real-time monitoring of machinery
Reduced Downtime Predictive maintenance reducesmachinefailure Early detection of wearandtear
CostSavings Lower maintenance and operationalcosts Reduced energy andmaterialwaste
International Research Journal of Engineering and Technology (IRJET) e-ISSN:2395-0056
Volume: 11 Issue: 06 | Jun 2024 www.irjet.net p-ISSN:2395-0072
7.1
Definition:Edgecomputinginvolvesprocessingdatacloser to the data source, rather than sending it to a centralized datacenterorcloud.
Local Processing:Dataisprocessedatornearthe data source, reducing latency and bandwidth usage.
Real-Time Insights: Provides real-time insights and enables immediate actions based on data analysis.
Benefits: Edge computing reduces latency, improves data security, and reduces the amount of data that needs to be transmittedtothedatawarehouse.
Reduced Latency:Processingdatalocallyreduces thetimeittakestoanalyzeandactondata.
Improved Security: Data is processed closer to the source, reducing the risk of data breaches duringtransmission.
Bandwidth Savings: Less data is transmitted to centralized data centers, saving bandwidth and reducingcosts.
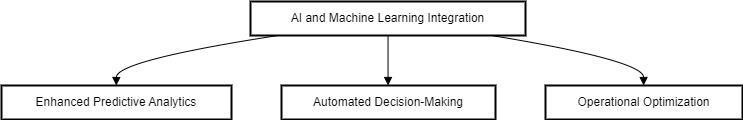
AI Models: Integrating AI and machine learning models with IoT data warehousing enhances predictive and prescriptiveanalyticscapabilities.
Predictive Models:Machinelearningmodelsthat predictfutureoutcomesbasedonhistoricaldata.
Prescriptive Models: AI models that recommend optimalactionsbasedondatainsights.
Automation:Automateddecision-makingprocessescanbe implemented based on AI-driven insights, further optimizingoperationsandreducinghumanintervention.
Automated Maintenance: AI models predict equipment failures and automatically schedule maintenance.
Operational Optimization: AI-driven insights optimize manufacturing processes and resource allocation.
Diagram: AI and Machine Learning Integration
Hybrid Cloud: Hybrid cloud solutions combine onpremisesandcloudstorage,offeringaflexibleandscalable approachtodatastorageandprocessing.
On-Premises Storage: Critical data is stored onpremisesforenhancedsecurityandcompliance.
Cloud Storage: Non-critical data is stored in the cloud,providingscalabilityandcost-efficiency.
Flexibility: Hybrid cloud solutions allow organizations to balance cost, performance, and security by choosing the most appropriate storage and processing environment for theirneeds.
Cost Efficiency:Leveragingcloudstoragefornoncriticaldatareducesinfrastructurecosts.
Performance Optimization: Combining onpremises and cloud resources optimizes performanceandensuresdataavailability.
Enhanced Security: Sensitive data is stored onpremises, ensuring compliance with data protectionregulations.
Table: Future Directions and Expected Outcomes Future Direction Expected Outcome Example
Edge Computing Reduced latency and enhancedsecurity
Local data processing at IoT gateways
AI and Machine Learning Improved predictive and prescriptive analytics AI-driven maintenance schedules
Hybrid Cloud Solutions
Balanced cost, performance, and security Using cloud for scalablestorage
Volume: 11 Issue: 06 | Jun 2024 www.irjet.net p-ISSN:2395-0072
8. Conclusion
Data warehousing for IoT analytics is crucial for harnessing the full potential of IoT data. Despite the challenges, the benefits in terms of real-time insights, enhanced decision-making, and operational efficiency are substantial. Future advancements in edge computing, AI integration, and hybrid cloud solutions will further enhancethecapabilitiesofIoTdatawarehousingsystems.
9. References
1. Chen, M., Mao, S., & Liu, Y. (2014). Big Data: A Survey. Mobile Networks and Applications, 19(2), 171-209.
2. Marr, B. (2015). Big Data: Using Smart Big Data, Analytics and Metrics to Make Better Decisions andImprovePerformance.Wiley.
3. Zikopoulos, P., & Eaton, C. (2011). Understanding Big Data: Analytics for Enterprise Class Hadoop andStreamingData.McGraw-Hill.
4. Gandomi, A., & Haider, M. (2015). Beyond the hype: Big data concepts, methods, and analytics. InternationalJournalofInformationManagement, 35(2),137-144.
5. Manyika, J., Chui, M., Brown, B., Bughin, J., Dobbs, R.,Roxburgh,C.,&HungByers,A.(2011).Bigdata: The next frontier for innovation, competition, and productivity.McKinseyGlobalInstitute.
6. Kaisler, S., Armour, F., Espinosa, J. A., & Money, W. (2013). Big Data: Issues and Challenges Moving Forward.46thHawaiiInternationalConferenceon SystemSciences.
7. Groves, P., Kayyali, B., Knott, D., & Van Kuiken, S. (2013). The ‘big data’ revolution in healthcare: Accelerating value and innovation. McKinsey & Company.
8. Li, S., Xu, L. D., & Zhao, S. (2015). The internet of things: a survey. Information Systems Frontiers, 17(2),243-259.
9. Hashem,I.A.T.,Yaqoob,I.,Anuar,N.B.,Mokhtar,S., Gani,A.,&Khan,S.U.(2015).Theriseof“bigdata” on cloud computing: Review and open research issues.InformationSystems,47,98-115.
10. Zhang, Y., Qiu, M., Tsai, C. W., Hassan, M. M., & Alamri, A. (2017). Health-CPS: Healthcare cyberphysical system assisted by cloud and big data. IEEESystemsJournal,11(1),88-95.
11. Riggins, F. J., & Wamba, S. F. (2015). Research directions on the adoption, usage, and impact of the internet of things through the use of big data
analytics.48thHawaiiInternationalConferenceon SystemSciences.
12. Lee, I., & Lee, K. (2015). The Internet of Things (IoT): Applications, investments, and challenges for enterprises. Business Horizons, 58(4), 431440. International Research Journal of Engineering and Technology (IRJET) e-ISSN:2395-0056