
International Research Journal of Engineering and Technology (IRJET) e-ISSN:2395-0056
Volume: 11 Issue: 06 | Jun 2024 www.irjet.net p-ISSN:2395-0072
International Research Journal of Engineering and Technology (IRJET) e-ISSN:2395-0056
Volume: 11 Issue: 06 | Jun 2024 www.irjet.net p-ISSN:2395-0072
Wael Albawwab1, Tauseef Ahmad Ansari2 ,
Assistant Professor1, University of Buraimi, Oman. Assistant Professor2, University of Buraimi, Oman.
Abstract:
The study of Land Use (LU)/ Land Cover (LC) dynamics in the face of climate change is critical for better long-term ecologicalmanagement.ThisstudyaimedtodetectthechangesoccurredintheLU/LCfrom2002to2022inBuraimicity ofOman.Thesatelliteimagesfortheyears2002and2022weretakenfromGoogle EarthPro.Inthisstudy,fourtypesof LU/LC(i.e.vegetationcover, built-upareassparsebuilt-upandopenlands)areestimated.This studyshowsthatbuilt-up area, vegetation area and sparse built-up area has been increased by 7.64 km2, 0.787 km2 and 15.23 km2 respectively, whiletheopenlandareahasdecreasedby23.65km2.Thisstudywillhelpunderstandtheurbandevelopmentinthecity andmanagethelanduseforsustainabledevelopment.
Key Words: LandUse(LU)/LandCover(LC),RemoteSensingandGIS,GoogleEarthPro,SustainableDevelopmentetc.
Introduction:
Thetermslanduseandlandcoverarefrequentlyusedtogether.However,theyhavequitedistinctmeanings.Anysurface cover on the ground such as vegetation, urban infrastructure, water, bare soil, or other ground surface covers can all be referredtoaslandcover.Whenitcomestoglobal monitoringstudies,resourcemanagement,andplanningactivitiesitis important to identify, delineate and map land cover. Land cover identification creates a foundation out of which monitoringoperationsmaybeconducted,aswellasprovidinggroundcoverdataforbaselinethematicmaps.Thepurpose that the land serves is being known as land use Subsequent monitoring and baseline mapping are both involved in applications that are used by land use because it is required to know what type of land is used and in what quantity to identifythechangesonlandusefromyeartoyear.Thisisdonebythetimelyinformationgathered.Thisinformationwill aidinthecreationofplanstobalanceconservation,competinguses,anddevelopmentpressures.Thelossor disruptionof fertileland,urbanexpansion,andforestdepletionareallissuesthataredrivinglanduseresearch.Accordingto(Lopezet al.2001),thehugeincreaseinpopulationisthemostimportantelementintheglobalshiftoflanduse.Previousresearch hasfoundadirectlinkbetweenLU/LCandanthropogenicimpacts,salinization,groundwateravailabilityandquality,and hydro-meteorological parameters (Dias et al. 2015). The use of remote sensing and hydrological datasets in a GIS frameworkhasbeenproventobeagoodwaytoexaminetheeffectsofLU/LCchangeongroundwaterquantityandquality on a broad scale at a cheap cost and with improved precision (Zampella et al. 2007). Because of their excellent georeferencing processes, digital format suited for computer processing, and recurrent data collecting, satellite remote sensing and GIS are the most used approaches for quantification, mapping, and detection of LU/LCC trends (Lu et al. 2004). Nuez et al. 2008; Rahman et al. 2011). Chen et al. 2005; Nuez et al. 2008; Rahman et al. 2011). To estimate land coverchangesincentralandsouthernlakeareasusingLandsatdata,ShalabyandTateishi(2007)founddifferentformsof LU/LCinEgypt'scoastalzone.GaoandLiu(2010)managedtodiscoverasoilerosiontrendincentralChinathatoccurred overa10-yearperiodowingtosoilcontaminationandflashfloods.Itlabelsinformationfromnumerousdatesseparately; therefore,propercomparisonofmulti-datedatasetdoesnotquitenecessitateanyadjustments(Singh1989;Rivera2005; Zhouet al.2008; WarnerandCampagna 2009). Mohammed FerasBaig (2022)madea study toassesschanges toLU/LC andpredictanyfurtherchangesthatcanhappentoSelangor,Malaysia.Thestudywasdonebyusingsatelliteimagesthat were used to develop maps by SVM (support vector machine) from the year 1991 to the year 2021. Validation metrics were used to show that the spectral analysis mapper did not perform as good as the support vector machine did. There weresixLU/LCclassificationusedtobasetheimagesusedinthisstudyon,namelyarewater,development,barren,forest, agriculture, and wetlands. The satellite imagery has shown an area increase in developed, barren and water lands. However,therewasadecreaseinareasofagricultural,forestandwetlands.
International Research Journal of Engineering and Technology (IRJET) e-ISSN:2395-0056
Volume: 11 Issue: 06 | Jun 2024 www.irjet.net p-ISSN:2395-0072
Study Area and Methodology:
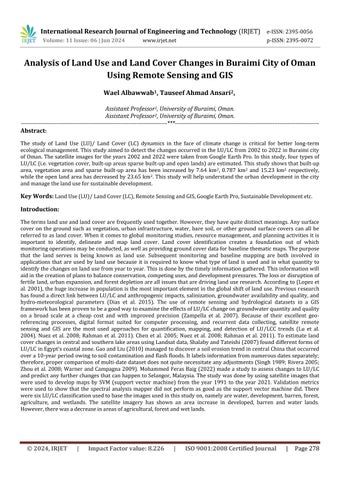
In this study, the Google earth image has been used to classify the various types of LU/LC and change occurred in the LU/LChasbeenestimatedbetweenyear2002to2020inBuraimicityofOman.Thesatelliteimagesfortheyear2002and 2022 from Google were captured to digitize the various land use class. The Quantum Geographical Information System (QGIS) software was used to generate the land use data. Thereafter, all land use were estimated and compared. The methodologyisgiveninFigure1.
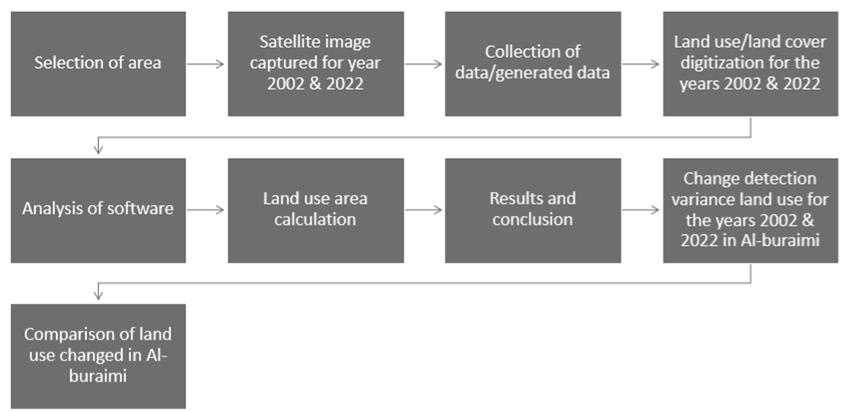
Figure1Methodologyadoptedforthestudy
Study Results and Discussion:
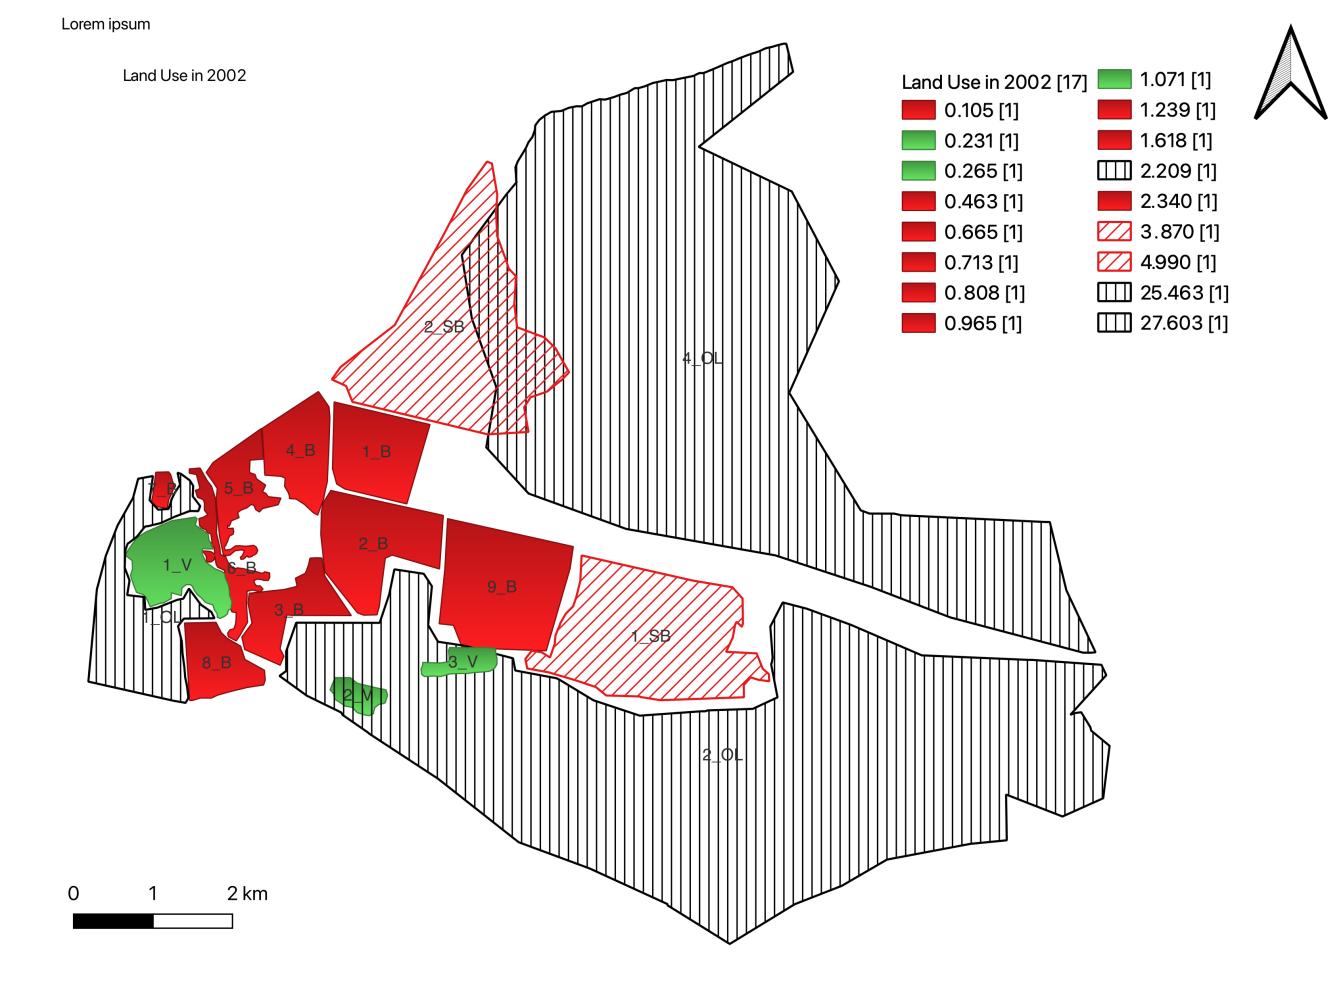
BuraimicityofOmanisawitnessofrapidurbanexpansioninthepast20years.Thevariouslanduseclassesareidentified. Thethematicmapforthelanduse/landcoverisgeneratedfortheyear2002asshowninFigure2.The built-uparea is shown by red color, red inclined shaded area shows the sparse built-up area. The open land is shown by vertical black shaded area while green color shows the vegetation area. The built-up area is estimated as 8.916 km2 while the spare built-upareaisfoundas8.86km2.Thevegetationcovershowedanareaof1.567km2.Moreover, theopenlandareawas about55.275km2.Thetotal areaof Buraimicityis74.618km2.Figure3showsthedifferenttypesoflandusein Buraimi cityin2002digitizedonsatelliteimageoftheGoogleEarthinordertodigitizethelanduse/landcovermapofBuraimi cityfortheyear2002.Thepiechartshowsthevariouslandusestaticsfortheyear2002. Figure4.Landuse/landcover staticsfortheyear2002(B=Built-uparea,OL=Openland,SB=SparseBuilt-uparea,V=vegetationarea)
International Research Journal of Engineering and Technology (IRJET) e-ISSN:2395-0056
Volume: 11 Issue: 06 | Jun 2024 www.irjet.net p-ISSN:2395-0072
International Research Journal of Engineering and Technology (IRJET) e-ISSN:2395-0056
Volume: 11 Issue: 06 | Jun 2024 www.irjet.net p-ISSN:2395-0072
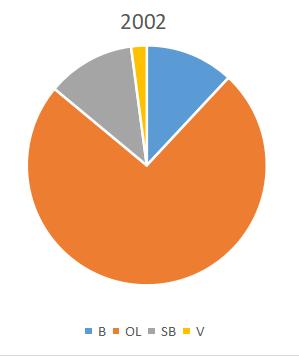
Figure4.Landuse/landcoverstatisticsfortheyear2002
(B=Built-uparea,OL=Openland,SB=SparseBuilt-uparea,V=vegetationarea)
Thelanduseisalsoclassifiedfortheyear2022asshowninFigure5.Thebuilt-upareaisshownbyredcolor,redinclined shadedareashowsthesparsebuilt-uparea.Theopenlandisshownbyverticalblackshadedareawhilegreencolorshows thevegetationarea.Thebuilt-upareawasestimatedas16.556km2.Thesparebuilt-upareaestimatedas24.092km2.The vegetation cover showed an area of 2.354 km2. Moreover, the open land area was calculated as 31.616 km2. Figure 6 showsthedifferenttypesoflanduseinBuraimiin2022digitizedonsatelliteimageofGoogle Earth.Thepiechartshows thevariouslandusestaticsfortheyear2022inFigure7.
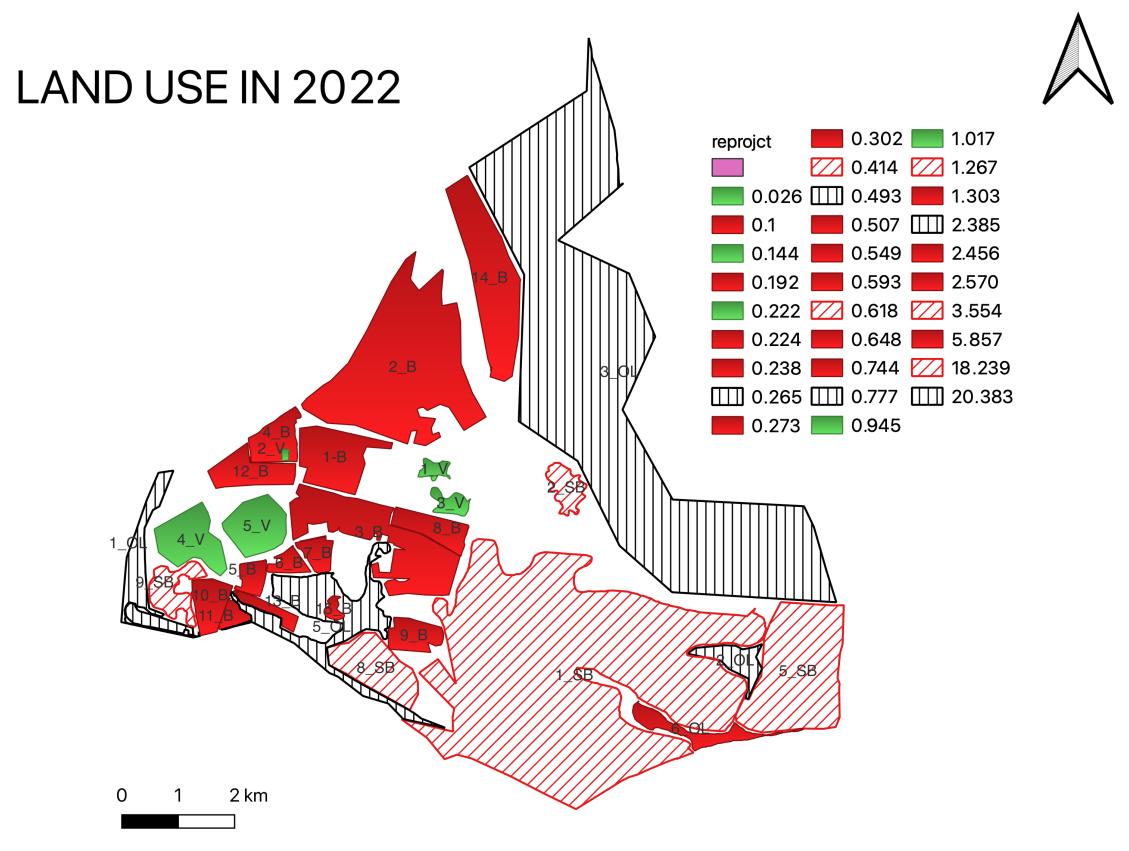
5.Landuse/landcovermapofBuraimicityforyear2022,
International Research Journal of Engineering and Technology (IRJET) e-ISSN:2395-0056
Volume: 11 Issue: 06 | Jun 2024 www.irjet.net p-ISSN:2395-0072
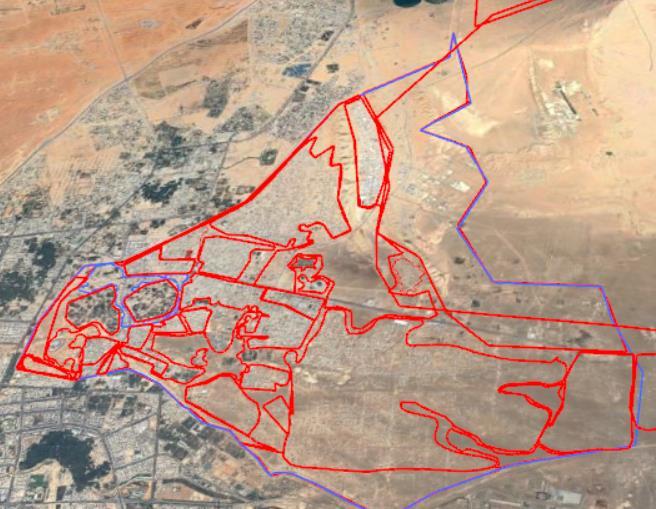
6.SatelliteimagecapturedfromGoogleEarthtodigitizethelanduse/landcovermapofBuraimicityfortheyear 2022
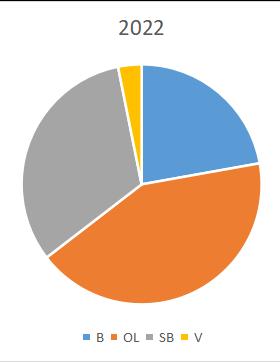
Figure7.Landuse/landcoverstatisticsfor2022
(B=Built-uparea,OL=Openland,SB=SparseBuilt-uparea,V=vegetationarea)
TheresultsshowsthatBuilt-uparea,SparseBuilt-uparea,hasincreasedby8.36km2 and15.23km2 ,respectively.Itisalso observed that the vegetation cover has also increased by 0.78 km2 but the open land area has been decreased by 23.66 km2 The results are summarized and listed in Table 1, while Figure 8 shows that both built-up area and sparse built-up areawithvegetationcoverhasbeenincreasedwhileopenlandhasbeendecreased.
© 2024, IRJET | Impact Factor value: 8.226 | ISO 9001:2008 Certified Journal | Page282
International Research Journal of Engineering and Technology (IRJET) e-ISSN:2395-0056
Volume: 11 Issue: 06 | Jun 2024 www.irjet.net p-ISSN:2395-0072
Table1 Thelanduseclassintheyear2002and2022
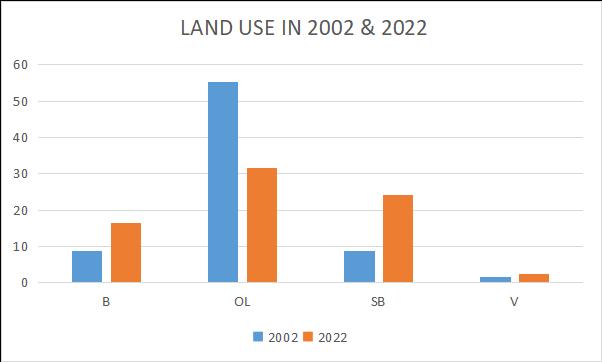
Figure8.ComparisonofLanduse/landcoverbetweentheyear2002and2022
Conclusions and Recommendations:
The above investigations were based on change detection of land use / land cover for the year 2002 and 2022 using satelliteimagery.Theresultsclearlydepictthatbuilt-uparea,sparsebuilt-uparea,vegetationareahasbeenincreased by 11.20%,20.41%,and1.04%,respectively.Whiletheopenlandhasbeendecreasedby31.71%inthelast20years.Itcan beconcludedthatthechangeinlanduseisduetourbandevelopment,populationandtheindustrializationhasbeenalso increased. Most of the open land has been converted into the built-up and sparse built-up area. Moreover, it is observed that the vegetation cover has almost doubled when comparing them between years 2002 and 2022. The reason behind thatistheparksandsportsareahasbeenincreased.However,itisstillconsideredasmallnumberoftheoverallarea.
References:
1. Ramadan, E., Al-Awadhi, T. and Charabi, Y. 2021 “Land Cover/ Land Use Change and Climate Change in Dhofar Governorate, Oman.” International journal of Geoinformatics, vol. 17, no.4, DOI: https://doi.org/10.52939/ijg.v17i4.1949.
2. Eyad.H.R.Fadda(2017).“Analysis,assessment,andmodelingoftheUrbanGrowth inGreaterMuscat,Sultanate ofOman,UsingGeographical InformationSystems&RemoteSensing.”Egypt.J.RemoteSensing&SpaceScience, 1(1),3-22.
International Research Journal of Engineering and Technology (IRJET) e-ISSN:2395-0056
Volume: 11 Issue: 06 | Jun 2024 www.irjet.net p-ISSN:2395-0072
3. Samy Elmahdy, Mohamed Mohamed and Tarig Ali. (2020)“GIS and Mapping Laboratory, American University of Sharjah,SharjahP.O.Box26666,UAE;atarig@aus.edu2CivilandEnvironmentalEngineeringDepartment,United ArabEmiratesUniversity,Al-AinP.O.Box15551,UAE;m.mohamed@uaeu.ac.ae
4. Mohammed Feras Baig, Muhammad Raza Ul Mustafa, Imran Baig, Husna Binti Takaijudin and Muhammad Talha Zeshan, Department of Civil and Environmental Engineering, Universiti Teknologi PETRONAS, Seri Iskandar 32610,Perak,Malaysia;husna_takaijudin@utp.edu.my(H.B.T.);talhaansari510@gmail.com(M.T.Z.)
5. Lopez,E.;Bocco,G.;Mendoza,M.;Duhau,E.2001“Predictingland-coverandland-usechangeintheurbanfringe: AcaseinMoreliacity,Mexico.”Landsc.UrbanPlan.55,271–285.
6. Singh A (1989) Digital change detection techniques using remotely sensed data. Int J Remote Sens 10(6):989–1003
7. Zahra Hassan1 , Rabia Shabbir1 , Sheikh Saeed Ahmad1*, Amir Haider Malik2 , Neelam Aziz1 , Amna Butt1 and SummraErum1Hassanetal.SpringerPlus(2016)5:812DOI10.1186/s40064-016-2414-z
8. Dias,L.C.P.;Macedo,M.N.;Costa,M.H.;Coe,M.T.;Neill,C.Effffectsoflandcoverchangeonevapotranspirationand streamflflowofsmallcatchmentsintheUpperXinguRiverBasin,CentralBrazil.J.Hydrol.Reg.Stud.2015,4,108–122.[CrossRef]
9. Zampella,R.A.;Procopio,N.A.;Lathrop,R.G.;Dow,C.L.RelationshipofLand-use/Land-coverPatternsandSurfacewaterQualityintheMullicaRiverBasin.J.Am.WaterResour.Assoc.2007,43,594–604.[CrossRef]
2024, IRJET | Impact Factor value: 8.226 | ISO 9001:2008