
International Research Journal of Engineering and Technology (IRJET) e-ISSN: 2395-0056
Volume: 11 Issue: 06 | Jun 2024 www.irjet.net p-ISSN: 2395-0072


International Research Journal of Engineering and Technology (IRJET) e-ISSN: 2395-0056
Volume: 11 Issue: 06 | Jun 2024 www.irjet.net p-ISSN: 2395-0072
Rashmi Shankar Pawar 1, Prof. Ganesh C. Jawalkar 2
1 M.Tech student, Dept. of Civil Engineering, N. B. Navale Sinhgad College of Engineering, Solapur, Maharashtra, India
2 Professor, Dept. of Civil Engineering, N. B. Navale Sinhgad College of Engineering, Solapur, Maharashtra, India.
Abstract - This study is conducted to analyze the Effect of Bay Spacing on Pre-Engineered Buildings and comparison of pre-engineered building with conventional building. PEB structure is designed and analyzed for different Bay spacings and the optimum structure is obtained. In first stage, the effect of bay spacing on the structure is checked and the optimum structure is selected. Then the Pre-Engineered Building (PEB) model with optimum Bay Spacing is compared with the Conventional Steel Building (CSB) The results are compared on the basis of Axial Force at Column Base, Steel consumption, Maximum deflection, Maximum Moment at Column Base. From pre-engineered building models, structure with height 9m, roof angle 10° and bay spacing 5m is selected and compared with conventional structure designed using truss members. The results shows that pre-engineered buildings are optimum and steel consumption is reduced by approximately 16%.
Key Words: Pre-EngineeredBuilding,ConventionalSteel Building,Optimisation,SteelConsumption.
Steelisusedasaconstructionmaterialasithashightensile strengthandductility.Theareaswhereconcretecannotbe used, Steel proves to be beneficiary. Until recent years, Conventionalsteelbuildingswithtrusswereusedonlarge scale. But now-a-days, Pre-Engineered buildings have proved to be a good alternative to the conventional steel buildings.PEBstructuresarebeingusedasitishavingsteel sections of reducing weights, better value for money, fast erectionrate,flexiblefittings,etc Taperedsectionsareused inPEBwhicheffectsoneconomyofstructure.
The need of PEB optimization is to study the effect of bay spacing variation in the designing of PEB. Important dimensional variables of trusses include the spans and depths of trusses, lengths of specific truss members (especiallycompressionmembers),spacingoftrusses,and transversepurlinspacing.ThePEBstructurewhendesigned foraparticulardimensionwillhavedifferentresultswhen designingfactorslikeBayspacing,RoofAngleareVaried.
Inthispaper,wewillbestudyingtheeffectofBaySpacingon thePEBstructuretoobtaintheoptimumbayspacingtobe utilizedforachievingeconomyinthestructure
Many papers on comparative study of PEB and CSB concepts have been presented in past years, it has been reported that PEB structures are more advantageous than CSBstructuresintermsofcosteffectiveness,qualitycontrol, speedyconstructionandsimpleerectionmethod
Subodh.S.Patil,(2017)presentedthepaper“Analysisand Design Of Pre-Engineered Building Of An Industrial Warehouse”.Thispapercameoutwithconclusionthatthe PEB structure can be designed by simple method using IS codesand,ItalsotoldusthebenefitsofPEBstructuresthan otherstructure.
Balamuralikrishnan R,(2019) presented the paper “ComparativeStudyonTwoStoreyCarShowroomUsingPreengineered Building (PEB) Concept Based on British StandardsandEuroCode”.Thepaperconcludedthat,Asper BS 5950:2000 code analysis, tapered section design was successfullycarriedoutandEN1993-1-1:2005codeanalysis tapered section was not supported by STAAD Pro V8i softwareandThetaperedframescontributesto40.63%of thetotalweightinBSmode.
V Vishnu Sai,(2021) presented the paper “Structural Performance of Pre Engineered Building: A Comparative Study”.Thestudyconcludedthattheparametersthataffect thestructuralweightandsectionsizesareWindspeedand SeismicZone.
India is one of the fastest growing economies, infrastructuredevelopmentistakinplacerapidly Thus,there isawidescopeforPre-EngineeredBuildingsinIndiaforthe construction of Metro Stations, Bus stands, Airports, etc. Thus, in India PEB is an upcoming field in construction industryfortherapidinfrastructuralgrowth.
Thedistancebetweenthetwoconsecutivetrussesiscalled as Bay Spacing or Spacing of trusses. The Bay Spacing is obtainedbythesizeofspacetobecoveredbyroof.Asthe spacingincreases,thenumberoftrussesmayreducebutthe costofpurlinsincreases.

International Research Journal of Engineering and Technology (IRJET) e-ISSN: 2395-0056
Volume: 11 Issue: 06 | Jun 2024 www.irjet.net p-ISSN: 2395-0072
The bay spacing is mostly determined by the spacing of supporting columns. The supporting column spacing is determinedbythefunctionalrequirements.Wherethereare nofunctionalrequirements,thespacingshouldbesuchthat the cost of roof is minimized. The larger the spacing, the smallerthecostoftrusses,butlargeristhecostofpurlins (as larger sections will be required) and vice versa. Roof coverings also cost more, if spacing between the truss is large.
Letusdetermineanapproximateformulaforarrivingat minimumcost,byconsideringthefollowingvariables.
S=BaySpacingbetweentrusses,
Ct=Costoftrussesperunitarea,
Cp=Costofpurlinsperunitarea,
Cr=Costofroofcoveringsperunitarea,
C=OverallCostofRoofsystem/unitarea.
Since the Cost of truss is inversely proportional to the spacingofthetruss,
Ct α1/S
Ct=k1/S 1 k1=constant
Similarly, Cost of purlins is directly proportional to the squareofspacingoftrusses,
Cp αS2
Cp =k2 S2 2 k2=constant
The Cost of roof coverings is directly proportional to the spacingoftrusses,
Cr αS
Cr=k3S 3 k3=constant
Thus,TotalCost=C=Ct +Cp +Cr = k1/S+k2 S2 +k3S
Fortheoverallcosttobeminimum,dC/dSshouldbezero.
Thus, -k1/S2 +2k2S+k3 =0 -k1/S+2k2S2 +
3S=0 4 -Ct +2Cp +Cr =0
Ct =2Cp +Cr 5
The equation 5 shows that an economic system can be obtainedwhenthecostoftrussesisequaltothecostofroof coveringplustwicethecostofpurlins.
However, it has been found that the economic range of spacingis1/5to1/3oftheSpanofTrussorFrameoftruss.
6PEBstructureswithBaySpacingsof4.5m,5m,5.625m, 6.43m,7.5mand9maredesigned.TheanalysisofthesePEB modelsiscarriedouttoobtaintheoptimummodel.
Onthecomparisonoftheresultsofthe6models,anoptimum Bay Spacing is finalized and used for further work in the project.
Buildingmodeldetailsareasfollowing
BuildingDimension = 45mx20m
Cleareaveheight = 9m
Maximumeaveheight = 10.763m
BaySpacing = 4.5m, 5m, 5.625m, 6.43m, 7.5mand9m
Bracingtype = CrossBracing
Roofslope = 10°
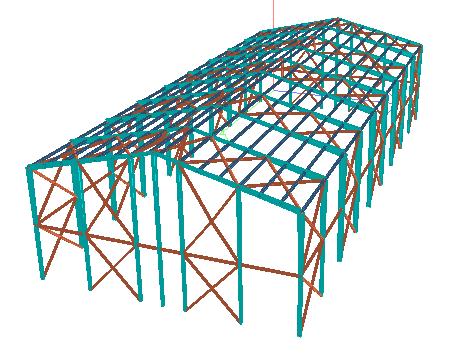
Figure
The analysis is performed using commercial software. In accordancewithIS875,loadcombinationsareconsidered, whichconsistofDeadloads,LiveloadsandWindloads.The bayspacingisvariedandresultsareobtained.
PEB structure with optimum bay spacing obtained is comparedwithCSBwithsamebayspacingandtheresults arecompared.

International Research Journal of Engineering and Technology (IRJET) e-ISSN: 2395-0056
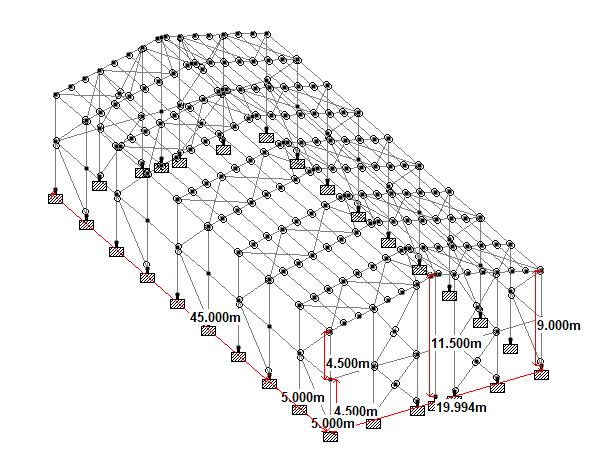
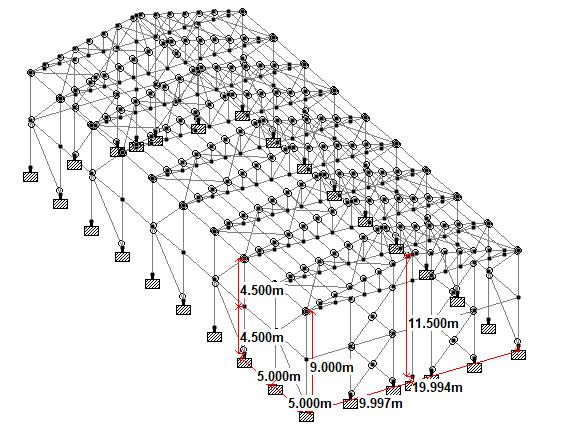
BuildingModelDetailsareasfollowing
Building Dimension = 45m x 20m
Clear eave height = 9m
Maximum eave height = 11.5m
Bay Spacing = 5m
Bracing type = Diagonal Bracing
Roof slope = 14°
3. Results and Discussion
3.1 Effect of Bay Spacing on PEB
a. Effect of Bay Spacing on Axial Force at Column Base -
Table1-AxialForceatBaseofColumn
4.5m

Graph1-EffectofBaySpacingonAxialForceatColumn Base(KN)
i. TheabovegraphshowssinusoidalvariationinAxialforce withbayspacingvariation.
ii. TheabovegraphshowsthatastheBayspacinggoeson increasing, the axial force at the column base goes on increasingbutlaterongoesondecreasingandagaingoeson increasing.
iii. According to the results obtained, 4.5m bay spacing showstheminimumvalueofAxialForceoutofallmodels.
Itshowed40.61%lessAxial Forcethanthehighestvalue obtainedfor9mbayspacingmodel.
b. Effect of Bay Spacing on Steel Consumption (KN)-
Table2-SteelConsumption
Steelconsumption(KN)
4.5m 754.415
5.0m 745.834
5.625m 831.401
6.4285m 825.673
7.5m 997.212
9.0m 1194.059
Volume: 11 Issue: 06 | Jun 2024 www.irjet.net p-ISSN: 2395-0072 © 2024, IRJET | Impact Factor value: 8.226 |

International Research Journal of Engineering and Technology (IRJET) e-ISSN: 2395-0056
Volume: 11 Issue: 06 | Jun 2024 www.irjet.net p-ISSN: 2395-0072
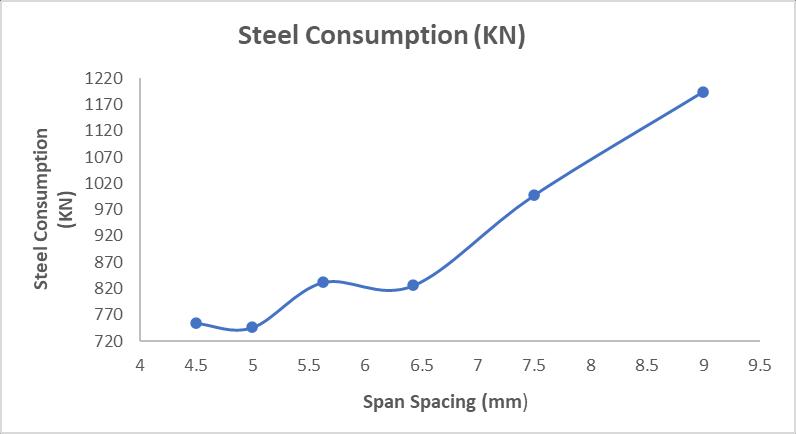
i. The above graph shows sinusoidal variation in steel consumptionwithbayspacing.
ii. TheabovegraphshowsthatastheBaySpacinggoeson increasing,theSteelconsumptiongoesonincreasing.
iii. The minimum the steel consumed, better is the model. Accordingtotheresultsobtained,5mbayspacingshowed theminimumsteelconsumptionoutofallthemodels.
Itshowedaround37.54%lesssteelconsumptionthanthe maximumsteelconsumedbymodelwith9mbayspacing.
c. Effect of Bay Spacing on Deflection –
Table3-MaximumDeflection
4.5m
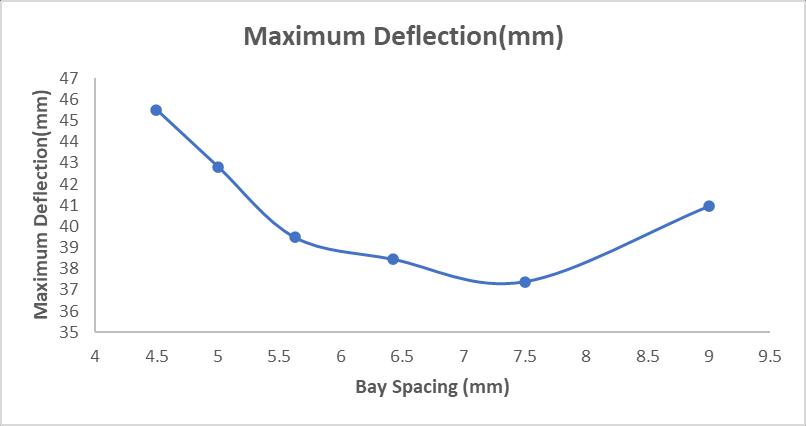
3-
i. TheabovegraphshowsthatastheBayspacinggoeson increasing,thedeflectiongoesondecreasingandthenagain goesonincreasing.
ii. The 7.5m and 6.4285m Bay spacing model gave approximately the same lowest values for minimum deflectionwhichisclearlyseenfromthegraph.
d. Effect of Bay Spacing on Moment at Column Base –
Table4-MaximumMomentatColumnBase
MaximumMomentatColumnBase(KN-m) 4.5m
7.5m

Graph4-EffectofBaySpacingonMomentatColumnBase (KN-m)
i. TheabovegraphshowsthatastheBaySpacinggoeson increasing,theMomentattheColumnBaseinitiallygoeson decreasing and then beyond 5m bay spacing goes on increasing.
ii. Here,the5mspacingmodelgavetheminimumMoment valuewhichisclearlyseenfromthegraph.
iii.Itshowedaround62.6%lessMomentthanthemaximum momentmodelwith9mBaySpacing.
Fromalltheaboveresultsobtained,wecanconcludethat,as we are working to get economical structure, the 5m bay spacingistheoptimumspacingandcantakethevaluefor furtherparametricstudy.

International Research Journal of Engineering and Technology (IRJET) e-ISSN: 2395-0056
Volume: 11 Issue: 06 | Jun 2024 www.irjet.net p-ISSN: 2395-0072
a. Axial Force at Column Base of PEB and CSB-
Table5-AxialForceatColumnBaseofPEB&CSB
MaximumAxialForce(KN)
Pre-engineered building structure 167.291
Conventionalsteelstructure 197.086
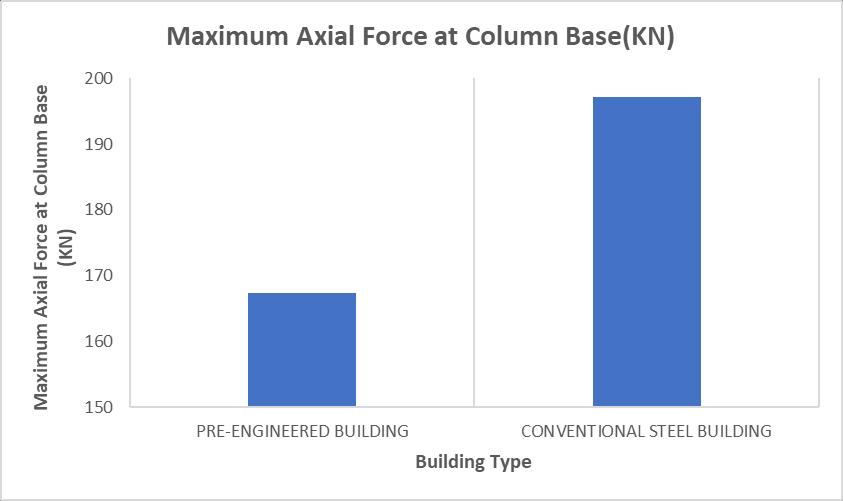
Graph5-AxialForceatColumnBase(KN)ofPEB&CSB
i. The PEB and CSB are studied for comparing the Axial Forcesintheaboveobtainedgraph
ii.ThePEBhaslessAxialforcesascomparedtotheCSB.
b. Effect on Steel Consumption of PEB & CSB-
Table6-SteelConsumptionofPEB&CSB
Steelconsumption(KN)
Pre-engineered building structure 694.8
Conventionalsteelstructure 821.351
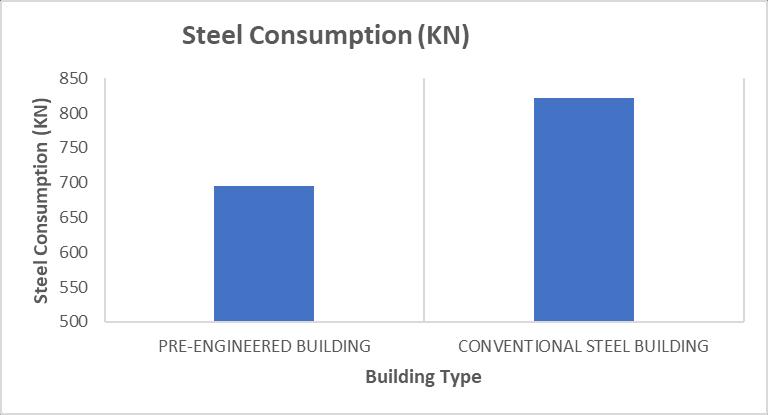
Graph6-SteelConsumption(KN)ofPEB&CSB
i. The PEB and CSB are studied for comparing the Steel Consumptionintheaboveobtainedgraph.
ii.ThePEBhaslessSteelconsumptionthantheCSB.
c. Deflection of PEB & CSB –
Table7-MaximumDeflectionofPEB&CSB
MaximumDeflection(mm)
Pre-engineered building structure 59.347
Conventionalsteelstructure 33.753
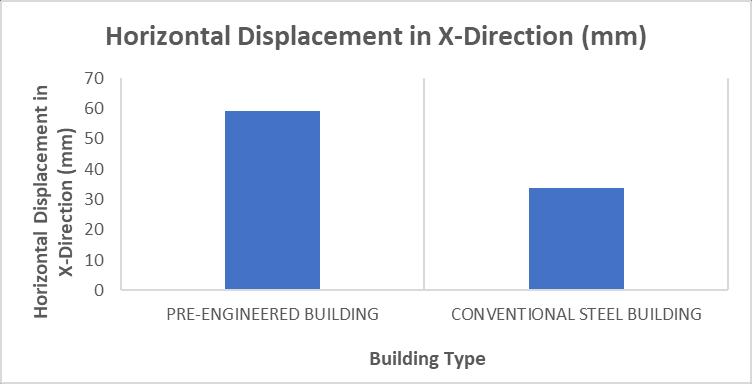
Graph7-MaximumDeflection(mm)ofPEB&CSB
i. ThePEBandCSBarestudiedforcomparingtheDefection intheaboveobtainedgraph
ii.ThePEBhasmoreDeflectionascomparedtotheCSB.
d. Effect on Moment at Column Base of PEB & CSB-
Table8-MaximumMomentatColumnBaseofPEB&CSB
MaximumMomentatColumnBase(KN-m)
Pre-engineered building structure 224.216
Conventionalsteelstructure 120.086
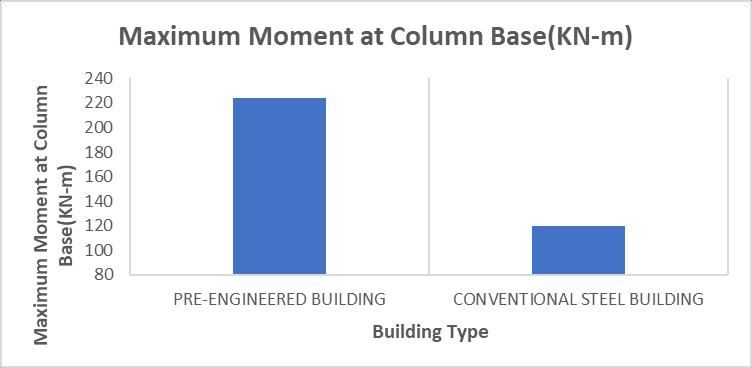
Graph8-MaximumMomentatColumnBase(KN-m)of PEB&CSB

International Research Journal of Engineering and Technology (IRJET) e-ISSN: 2395-0056
Volume: 11 Issue: 06 | Jun 2024 www.irjet.net p-ISSN: 2395-0072
i.ThePEBandCSBarestudiedforcomparingtheMomentat ColumnBaseintheaboveobtainedgraph. ii.ThePEBhasmoreMomentatColumnbaseascomparedto theCSB.
1.Pre-engineeredbuildingshowedlessAxialForceatbaseof thecolumnof15.12%thanconventionalsteelbuilding.
2.ThePEBshowedlesssteelconsumptionofaround15.42% thanconventionalsteelbuilding.
3.ThemaximumdeflectionismoreforPEBataround51.3% thanconventionalsteelbuilding.
4. The maximum Moment at Column Base came more for PEBataround46.44%thanconventionalsteelbuilding.
5. The PEB structure came out to be optimum and cost efficientascomparedtoCSBbyaround15.5%.
6. The whole study gave us the staggered plan-based enhancementresults,withexactvaluesofthebehaviorofthe variousstructuresdesignedandmodelledinthestudy.We gottheexactpercentagesofthedifferencesinthebehaviors ofthemodelsfromwhichweconcludedtheoptimumPEB structure.
[1] BalamuralikrishnanR.,IbrahimShabbirMohammedali “ComparativeStudyonTwoStoreyCarShowroomUsing Pre-engineeredBuilding(PEB)ConceptBasedonBritish StandardsandEuroCode”CivilEngineeringJournalVol. 5,No.4,April,2019.
[2] C. M. Meera “Pre-Engineered Building Design Of An Industrial Warehouse” International Journal of EngineeringSciences&EmergingTechnologies,Volume 5,Issue2,June2013.
[3] T.D. Mythili “Analysis and Comparative Study of Conventional Steel Structure with PEB Structure” InternationalJournalofScienceandResearch,Volume6 Issue4,April2017.
[4] Vishwanath Pujar, Prof. Ravi Tilaganji “Comparative StudyOfCodalProvisionForPre-EngineeredBuilding” International Research Journal of Engineering and Technology, Volume:04Issue:07July-2017.
[5] IS:800-2007IndianStandardGeneralConstructionin Steel-CodeofPractice.
[6] IS:875(Part1)–1987CodeofPracticefordesignloads (other than earthquake) for building and structures (DeadLoad).
[7] IS:875(Part2)–1987CodeofPracticefordesignloads (other than earthquake) for building and structures (ImposedLoad).
[8] IS:875(Part3)–2015CodeofPracticefordesignloads (other than earthquake) for building and structures (WindLoad).
[9] https://www.irjet.net/archives/V8/i1/IRJETV8I1108.pdf
[10] https://www.ijera.com/papers/Vol4_issue9/Versio n%206/Y4906174183.pdf
[11]DesignofSteelStructuresbyS.S.Bhavikatti
[12]Steel Structures Design and Practice by N.Subramaniam