
International Research Journal of Engineering and Technology (IRJET) e-ISSN: 2395-0056
Volume: 11 Issue: 06 | Jun 2024 www.irjet.net p-ISSN: 2395-0072
International Research Journal of Engineering and Technology (IRJET) e-ISSN: 2395-0056
Volume: 11 Issue: 06 | Jun 2024 www.irjet.net p-ISSN: 2395-0072
Apoorva Rajpoot, M. Tech Student, Department of Electrical Engineering, Government Women Engineering College, Ajmer.
Pushpendra Singh, Assistant Professor, Department of Electrical Engineering, Government Women Engineering College, Ajmer.
Abstract - This research proposes a unique technique to optimize the integration of distributed energy resources (DERs) inside distribution networks, intending to improve system performance and meet ancillary service requirements. This study employs Metaheuristic Optimization Techniques, especially a hybrid PSO-EHO algorithm, to determinethe ideal position and size of DERs. The proposed model's effectiveness is assessed using detailed simulations of benchmark distribution systems, including the IEEE 33-bus and 69-bus test networks. Using MATLAB 2021a and the MATPOWER 7.1 toolbox, the optimization procedure exhibits remarkable convergence behavior, as shown in convergence graphs for both systems. The findingsshowconsiderable improvementsin voltage profile and a decrease in active power losses after the installation of DGs,demonstratingtheefficacyofthesuggested strategy. Detailed analyses, including voltage magnitudes, active power losses, and comparison tables displaying the locations and capacitiesoftheDGs,demonstratethePSO-EHObased optimization model's practicalfeasibilityandbenefitsin improving the integration of DERs into distribution networks.
Key Words: Distributed energy resources (DERs), Distribution network, Metaheuristic optimization techniques, PSO-EHO algorithm, System performance, Optimization,Voltageprofile
Inrecentyears,therehavebeenseveralimprovementsinthe electric power industry. Customers are becoming pickier aboutdependabilityandpowerquality,whiledistribution network operators (DNOs) are being forced to increase energyefficiencytosavecostsasaresultofthecurrenttrend towardderegulationinthepowerindustry.Shuntcapacitors (SCs)anddistributedgenerators(DGs)aretwoexamplesof distributed energy resources (DERs) that are crucial for obtainingincreasedenergyefficiencyindistributionsystem functioning.Tomeetsmartgridefficiencyobjectivesofloss reduction and high-quality electricity provided to the end user,integratedsolutionstowell-formulatedchallengesthat reflect the reality on the ground where all such devices coexistareneeded[1].WhileimproperDERplacementmay raisesystemlossesaswellasnetworkcapitalandoperating costs, optimal DER placement can enhance network performance in terms of better node voltage profiles, decreased power flows, reduced feeder losses, improved
powerquality,andreliabilityofelectricsupply.Regardlessof the specific motivation for a DNO, such as permitting the connectionofmoreDGcapacity,decreasingenergylosses,or enhancing network dependability, the DG planning tools needtoincludefundamentalnetworklimitationslikevoltage andheatthresholds[2]
In recent times, there have been several efficacious endeavors toaddressthe issueof the ideal distribution of either SCs or DGs independently[3]. Nevertheless, the deploymentstrategyofDERsintandemismorefeasibleand canindependentlyconfigureand managethe flow of both reactiveandactualpowerinadistributionnetwork(DN)[4]. Usinganalyticalorheuristictechniques,thissimultaneous allocationmethodandhaveshownthemutualinfluenceof thesedevicesonthedistributionnetwork'sperformance.An analytical method for the simultaneous installation of SCs andDGstominimizeinvestmentcosts.Byusingananalytical techniquetoidentifyvoltagesupportzones,theynarrowed thesearcharea,andthenusedahybridPSO-EHOtoaddress theissue.
PSO-EHOtechniquewasusedtoascertaintheidealposition andamountofdistributedgeneration(DG)powerfactorin order to reduce power losses under different circumstances[5].It has been shown that the results have significantlyimprovedintermsoflossreductionandvoltage profileimprovement.Aheuristicmethodinwhichthebest candidatesitesarefoundbyanodesensitivityanalysis,and the capacity of the SCs/DGs is then found through the recommendationofaheuristiccurvefittingprocedure.To addressthismulti-objectiveoptimizationissue,acombined imperialistcompetitivealgorithm(ICA)–geneticalgorithm (GA) approach. Using this strategy, dispersed resource placementandsizeareinitiallydeterminedbytheICA,and these solutions are then further refined by the GA operators[6].
Toreducepowerlosses,severalDGtypesareusedforactual and reactive power injections. PSO-EHO together with an analyticalmethodisusedtoaddresstheissue.Theauthors concluded that bigger systems are better suited for the heuristicmethod[7].Nevertheless,theissuegoalsinthese efforts have mainly been loss reduction and node voltage improvement; peak power losses, feeder current profiles, andsubstationcapacityreleaseforDERallocationhavenot beenconsidered.
International Research Journal of Engineering and Technology (IRJET) e-ISSN: 2395-0056
Volume: 11 Issue: 06 | Jun 2024 www.irjet.net p-ISSN: 2395-0072
Another operational technique that has been widely employed to accomplish several performance goals, including power loss reduction, voltage profile improvement, and congestion control, is distribution networkreconfiguration,orDNR.Asaresult,acoordinated strategy for DER allocation in conjunction with DNR may moresuccessfullyaccomplishgoalslikeimprovedsubstation capacity release, reduced peak power losses, and greater energyefficiency[8].Theelectricitydistributioncompany typicallyinstallsSCs,althoughprivateinvestorsownDGs.In ordertoassignDGsandSCsconcurrently,theelectricutility shouldprovidetheDGinvestora coordinatedsolutionfor the location and scale of DERs. As a matter of fact, a concerted effort of this kind may provide the greatest possibleadvantagesforthenetworkoperatorand/orusers, as well as assess the viability of DER investment in comparisontootherconventionalplanningchoices[9].
appropriateplacementofDERsinDNrequiresdetermining the appropriate quantity, size, and location. [10] It is a nonlinear,complicatedcombinatorialoptimizationproblem. Swarmandevolutionaryoptimizationapproaches,suchas GA and PSO, have been shown to achieve global or nearglobal optima. When applying these approaches to largescale applications[11], [12]it's important to prevent prematureorsluggishconvergenceduetothevastsearch areaavailable.
Only a few of the highest-priority nodes on this list are chosen for DER allocation. However, these methodologies arenotinfallibleandonlygivegeneralrecommendationson theimportanceofprospectivenodes.Thenodesensitivities are determined assuming no such devices are installed. Selectingjustthetopfewnodesassensitivecomponentsdid notprovideanaccuraterepresentationofthedistribution network[13]
TheconventionalPSOmethodconsiderseachparticleasa possible solution to the job inside the search space. In Ddimensionalspace,thelocationandvelocityvectorsoftheith particle may be written as 12 (,,...,) iiiiD xxxx and 12 (,,...,) iiiiD vvvv , respectively. After random particle initialization, the ith particle's velocity and location are updatedasshownbelow.
2r 1r gp
Theinertiaweight( w )mayadjusttheeffectofpriorvelocity onthepresentone.Theweightsof ; gi pp aredeterminedby twoconstants, 1c and 2c ip indicatesthebestpriorposition of the ith individual, whereas represents the best previouspositionofall particlesinthecurrentgeneration. and aretworandomlygeneratedvariablesthathavea uniformdistributionintherange[0,1].
Table -1: PSOalgorithm
Step1: RandomlyinitializeSwarmpopulationofNparticles
Xi(i=1,2,…,n)
Step2: Selecthyperparametervalues w,c1andc2
Step 3: ForIterinrange(max_iter): #loopmax_itertimes Foriinrange(N): #foreachparticle:
a.Computenewvelocityofithparticle swarm[i].velocity= w*swarm[i].velocity+ r1*c1*(swarm[i].bestPos-swarm[i].position)+ r2*c2*(best_pos_swarm-swarm[i].position)
b.Computenewpositionofithparticleusingitsnew velocity swarm[i].position+=swarm[i].velocity
c.Ifpositionisnotinrange[minx,maxx]thenclipit ifswarm[i].position<minx: swarm[i].position=minx elifswarm[i].position>maxx: swarm[i].position=maxx
d.Updatenewbestofthisparticleandnewbestof Swarm if swaInsensitive to scaling of design variables.rm[i].fitness<swarm[i].bestFitness: swarm[i].bestFitness=swarm[i].fitness swarm[i].bestPos=swarm[i].position ifswarm[i].fitness<best_fitness_swarm best_fitness_swarm=swarm[i].fitness best_pos_swarm=swarm[i].position
End-for
End-for
Step 4: ReturnbestparticleofSwarm
Toovercomeglobaloptimizationchallenges,wesimplified elephant herding behavior into the idealized guidelines below.
1)Theelephantpopulationconsistsofclans,eachwitha certainnumberofelephants.
2)Eachgeneration,acertainnumberofmaleelephants leavetheirfamilygrouptolivealonedistantfromthemain group.
3)Eachtribeofelephantsisledbyamatriarch.
International Research Journal of Engineering and Technology (IRJET) e-ISSN: 2395-0056
A.Clanupdatingoperator
Asmentionedbefore,alltheelephantslivetogetherunder the leadership of a matriarch in each clan. Therefore, for each elephant in clan ci, its next position is influenced by matriarchci.Fortheelephantjinclanci,itcanbeupdatedas
,,,,, newcijcijbestcicij xxxxr (3)
,, newcijx and , cijx representtheupdatedandoldpositions of elephant j in clan ci , respectively. The scale factor
0,1
defines the impact of matriarch ci on , cijx .
, bestcix signifiesmatriarch ci ,thefittestelephantinclan ci
0,1 r .Here,uniformdistributionisapplied. Eq. (1) does not update the fittest elephant in each clan ,, cijbestcixx . The fittest one may be upgraded as follows:
,,, newcijcenerci xx (4)
where the impact of the , cenercix on the ,, newcijx is determined by a factor 0,1 . As we can see, the knowledge gathered by every elephant in clan ci is what creates the new individual ,, newcijx in Equation (4). The center of clan ci is denoted by , centercix and its d-th dimensionmaybecomputedas ,,,, 1 1 cin
centercidcijd j ci xx n (5) where 1 dD signifiesthe d-thdimensionandD is thetotaldimension. cin representsthenumberofelephants inclan ci ,, cijdx representsthed-th elephantindividual , cijx .Eq.(5)calculatesthecenterofclan , , centercicix usingD computations.
B.Separatingoperator
Inelephantgroup,maleelephantswillleavetheirfamily group and live alone when they reach puberty. This separatingprocesscanbemodelledintoseparatingoperator when solving optimization problems. In order to further improvethesearchabilityofEHOmethod,letusassumethat the elephant individuals with the worst fitness will implement the separating operator at each generation as showninEq.(6).
,minmaxmin(1)
worstci xxxxrand (6)
max x and minx representthemaximumandlowerbounds ofanelephant'slocation.Theworstelephantinclan ci is
representedby , worstcix .Weemployauniformdistributionin the range 0,1 rather than a stochastic distribution in 0,1 rand
Table -2: ElephantHerdingOptimization(EHO)
Algorithm1ElephantHerdingOptimization(EHO)
1: Initialize population of elephants with random positions
2: Define parameters: number of clans (C), number of elephantsperclan(N),maximumnumberofgenerations(G), scalefactor(σ),separatingprobability(psep),andmaximum mutationstepsize(∆max)
3: while notreachedmaximumgenerations do
4: Evaluatefitnessofeachelephant 5: for eachclan ci do
6: Find the fittest elephant xbest,ci inclan ci
7: Calculatethecenterxcenter,ci ofclan ci 8: for eachelephantjinclan ci do
9: if elephantjisnot thefittestinclan ci then
10: Generate a randomscalefactorr
11:
Updateelephant j’sposition:
12: xnew,ci,j = xci,j+σ · (xbest,ci − xci,j ) · r 13: else
14: Generate a randomfactorη
15:
Calculatethenew positionbasedonthecenteroftheclan: 16 xnew,ci,j = xcenter,ci + η · (xci,j − xcenter,ci )
17: end if 18: end for 19: end for 20: for eachclanci do
21: Findthe elephantwiththe worst fitness xworst,ci inclanci
22: if randomprobability p < psep then 23: Generatearandomvalue rand
24:
Update xworst,ci ’sposition: 25: xworst,ci = xworst,ci+rand
· ∆max
26: end if 27: end for 28: Ensure that all elephant positions are withinthefeasiblerange
29: Incrementgenerationcount
30: end while 31:Selectthebestsolutionfromthefinalpopulation
Volume: 11 Issue: 06 | Jun 2024 www.irjet.net p-ISSN: 2395-0072 © 2024, IRJET | Impact Factor value: 8.226 | ISO 9001:2008
International Research Journal of Engineering and Technology (IRJET) e-ISSN: 2395-0056
Volume: 11 Issue: 06 | Jun 2024 www.irjet.net p-ISSN: 2395-0072
In a hybrid EH-PSO method, the objective function f(x) represents the function to be optimized. This function assessesthequalityorfitnessofasolutionrepresentedby thevectorxinthesearchspace.
The objective function, denoted as fx , is defined dependingontheissuebeingaddressed.Inaminimization problem, the objectiveisto discover thesmallestpossible value for the function fx , whereas in a maximization issue,theobjectiveistofindthelargestpossiblevalue.
Theobjectivefunctionmaybemathematicallyexpressed as:
Minimize fx Or
Maximize
fx
Where:
xisavectorthatrepresentsapossiblesolutionin thesearchspace.
Theobjectivefunction fx examinesthequality ofasolution( x ).
In a hybrid EH-PSO method, the optimization process combines EHO's exploration and PSO's exploitation capabilities. This combination seeks to strike a better balancebetweenexplorationandexploitation,resultingin enhancedconvergencecharacteristicsandsolutionquality.
Thehybridmethodrepeatedlyadjustsparticlelocations (representedby x )usingamixofEHOandPSOprocesses. These systems are often built around mathematical equations that regulate particle movement in the search space.
In PSO, the update equation for a particle's location at iterationt+1maybestatedasfollows: (1)()(1) ttt iii xxv
() t ix isthepositionofparticleiatiterationt.
(1) t iv isthevelocityofparticleiatiterationt+1 Similarly,inEHO,theupdateequationforanelephant's locationmayberepresentedinnumerouswaysdepending onitsdynamicsandexplorationapproach.
The hybrid EH-PSO method combines the update equationsfromEHOandPSOinamannerthattakesuseof each algorithms' capabilities. The objective function
fx directs the optimization process and ensures highqualitysolutionsfortheissue.
Table -3: ProposedAlgorithm
Algorithm 1 Hybrid PSO-EHO Algorithm for Hyper parameterTuning
1: Initialize population of elephants and swarm of particleswithrandompositions
2:Defineparametersforbothalgorithms:
• ForEHO:numberofclans(C), numberofelephantsperclan(N), maximumgenerations(G),scale factor(σ),separatingprobability (psep),andmaximummutationstep size(∆max)
• ForPSO:maximumnumberof iterations(max iter ), inertia weight (w ),cognitiveweight(c1 ),andsocial weight(c2 )
3: while notreachedmaximumgenerations(forEHO)or maximumiterations(forPSO) do
4: PerformEHOsteps:
5: Evaluatefitnessofeachelephant
6: for eachclan ci do
7: Findthefittestelephant xbest,ci inclan ci
8: Calculatethecenter xcenter,ci ofclan ci
9: for eachelephant j inclan ci do
10: if elephant j isnotthefittestinclan ci then
11: Generatearandomscalefactor r
12: Updateelephant j’sposition:
13: xnew,ci,j = xci,j + σ (xbest,ci xci,j ) r
14: else
15: Generatearandomfactor η
16: Calculatethenewpositionbasedonthecenterofthe clan:
17: xnew,ci,j = xcenter,ci + η (xci,j xcenter,ci )
18: end if
19: end for
20: end for
21: Performseparatingoperator
22: Ensure that all elephant positions are within the feasiblerange
23: PerformPSOsteps:
24: for Iterinrange(maxiter) do
25: for eachparticleinswarm do
26: Computenewvelocityofparticle
International Research Journal of Engineering and Technology (IRJET) e-ISSN: 2395-0056
Volume: 11 Issue: 06 | Jun 2024 www.irjet.net p-ISSN: 2395-0072
27: Compute new position of particle using its new velocity
28: Clippositionifoutofrange
29: Updatebestpositionofparticleandbestpositionof swarm
30: end for
31: end for
32: Incrementgenerationcountoriterationcount
33: end while
34:ReturnthebestsolutionfoundbyEH-PSO
The optimal allocation of DERs aims to maximize annual savingsandprofitbyreducingchargesforenergylosses,peak power losses, and substation capacity release, while maintainingbetternodevoltageandfeedercurrentprofiles undermulti-levelloads.Apenaltyfunctiontechniqueisgiven for determining the maximum node voltage variation and temperature limit of distribution feeders. The objective functionisexpressedasfollows:
is designed to address node voltage variations and feeder currentconstraints.Itisdefinedasthegeometricmeanofthe node voltage penalty function pfV and the feeder current penaltyfunction pf I ,asseenbelow:
whereNandLrepresentthenumberofsystemnodesand load levels, respectively. The multi-level piece-wise yearly load profile considers the number of load levels and their durations ( LN and j H respectively). , lossbjP and , lossajP representpowerlossesforuncompensatedandcompensated systemsatthe thj loadlevel,respectively. , lossbP and , lossaP represent peak power losses for uncompensated and compensated systems. p bS represents the base case substation capacity, while p a S represents the sub-station capacityafterDERallocationandreconfiguration. SCQ and DGP represent reactive and active compensation at a candidate node. epSSCDGKKKKK are the unit costs of energy,peakpowerlosses,sub-stationcapacityrelease,shunt capacitorinstallation,andDGinstallation,respectively.The first and second terms reflect the costs of reducing yearly energylossandpeakpowerloss,respectively.Thethirdterm coverstheyearlycostsforsubstationcapacityrelease.The fourth and final periods represent the yearly costs for installingSCsandDGs,respectively.Thepenaltyfunction
Equation(9)demonstratesthat pfV isderivedbyassessing thehighestdeviationinnodevoltageacrossallsystemnodes, consideringallloadlevels.Here, njV representsthevoltage deviationofthe thn nodefromthesourcevoltageatthejth load level. Similarly, the value of pf I is calculated using equation(10),where njI representsthedeviationofthe currentinthe thn feederfromitsratedampacityduringthe thj loadlevel.Thevaluesof njnjIandV aredeterminedby using equations (11) and (12), respectively. A soft voltage limitationisimplementedin(5)byestablishingaminimum specified node voltage, min S V , which must be maintained below the minimum allowable node voltage, minV , as determinedbythepowerregulatingauthority. max V refersto the highest allowable voltage at a node as determined by regulatorybodies,whereas max n I representsthedesignated lineampacityforthenthline.
minmin minmax 1; 0;;, arg; njSnj njnj VVVV VVVVnNjL averylenumberelse
(11)
max 0; ;, arg; njn nj II InNjL averylenumberelse
(12)
As follows, the capital recovery factor for DER investmentsarecalculated:
International Research Journal of Engineering and Technology (IRJET) e-ISSN: 2395-0056
Volume: 11 Issue: 06 | Jun 2024 www.irjet.net p-ISSN: 2395-0072
(13)
wheredrepresentsthediscountrateandYdenotesthe DER allocation project's planning horizon. Thesubsequentoperationallimitationsareimplemented: ()0; j ghjL (14)
where () j gh denotes the collection of power flow
equationsapplicabletothe thj loadlevel. At each node, the aggregate active and reactive power introduced by DG and SCs must remain within the permissiblerange,whichisdelineatedasfollows:
(16)
where ,minDGP and ,maxDGP represent,respectively,the minimumandmaximumactivepowergenerationlimitsata node.Inthesamemanner,theminimumandmaximumlimits on reactive power generation at a node are denoted as ,minSCQ and ,maxSCQ ,respectively.
Thefollowingarethedefinedsystempowergeneration limitsforSCsandDGs:
, 1 ; loc SCnD n QQnN
(17) , 1 ; loc DGnD n PPnN
(18)
Itispostulatedthatthecombinedactiveandreactivepower injected by DGs and SCs at every candidate node location should be in excess of the system's nominal active power demand DQ andreactivepowerdemand DP ,respectively. Prohibitedbyequations(15)and(16)istheduplicationof candidatesitesforDERs.
,, ;, SCaSCb NNabN (19) ,, ;,DGaDGb NNabN (20)
whereNDGandSCrefer,correspondingly,tocandidate sitesforDGsandSCs.GiventhatdiscretesizesofDERsare commerciallyavailable,theyaremodeledasfollows:
;0,1,2,...,SCbbb QKQKnsc (21) ;0,1,2,...,DGddd PKPKndg (22)
bQ and dP denote the unit size of SCs and DGs, respectively.
bK and dK denotethequantityofcapacitorbanksand discretedispatchesofDG,respectively.
Initially optimizing the solution, it determines the ideal location and dimensions of Distributed Energy Resources (DERs),consideringtheyearlydemandprofile.
Next,theoptimizationprocessisperformedindividually for each demand level to find the most efficient power distributionof the deployedDistributedEnergyResources (DERs). Nevertheless, the locations for Distributed Energy Resources(DERs)remainfixedandtheircapacityislimited to the size determined by the solution reached. The supplementarylimitations necessarytoascertainthemost efficient allocations of SCs and DGs are represented as follows:
,, ;0,1,2,...,/ SCnttSCn QKQKQQ (23) ,, ;0,1,2,...,/ DGnmdmdDGn PKPKPP (24)
P and Q indicate the relative discrete sizes of availablecommercialSCsandDGs.
AfterproperlylocatingDistributedEnergyResources(DERs), the distribution network is changed individually for each demandlevel.Thereconfigurationissueaimstoreduceactual power loss lossP at the thj load level, while ensuring compliance with different operational restrictions of the network.ThemathematicalframeworkfortheDNRissueis expressedas:
(25)
Theactiveandreactivepowerflowsinthenthbranchofthe systemaredenotedby njP and njQ ,respectively,whereE indicates the total number of branches. The symbol n R represents the resistance of the thn branch, whereas njV represents thevoltage atthe thn node at the thj load level.
Equation(25)isboundbythefollowinglimitations:
Therevisednetworkconfigurationmustberadial,meaning thatitshouldnothaveanyclosedpaths.Thus,theradiality constraintfortherthradialtopologyisdefinedas:
International Research Journal of Engineering and Technology (IRJET) e-ISSN: 2395-0056
Volume: 11 Issue: 06 | Jun 2024 www.irjet.net p-ISSN: 2395-0072
representsthesymbolicrepresentationofaclosed loop.
2. Node voltage constraint
DuringtheDNR,astringentvoltagelimitisimplementedasa crucial operating strategy for the network. During the optimizationprocess,itisnecessarytoensurethatallnode voltages njV of the system remain within the specified minimum( minV )andmaximum( max V )limits.
;, nj
Thepowerflowconstraintisdeterminedbyequation(27).
The radiality limitation is the most significant obstacle whenaddressingtheissueofnetworkreconfiguration.The issueissolvedusingthecodificationdescribedin[14]inthe currentstudy.Thisisarule-basedmethodfordetectingand correctingradialtopologiesthatarenotpractical.Basedon thiscodification,threecriteriahavebeenformulatedusing graphtheorytodetectandrectifyinfeasibleindividualsthat mayarisethroughoutthecomputingprocess.
Simulation results:
TheproposedapproachistestedusingIEEE33-busand69bustestdistributionsystems.Inmatlab2021a,theobtained resultsarebriefedoutinthissectionasfollows.
IEEE-69 and 33 bus system:
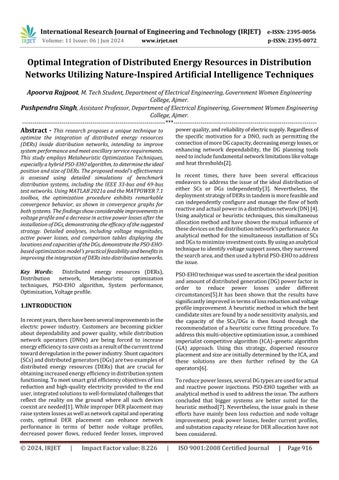
TheIEEE69,33BUSsystemsareutilizedbyusingmatpower 7.1toolkitandtheoptimallocationsforDG’sandcapacities areobtainedusingahybridPSO-EHOalgorithm.figure1&2 showstheobjectivefunctionvalueconvergesoverthegiven numberofiterations.
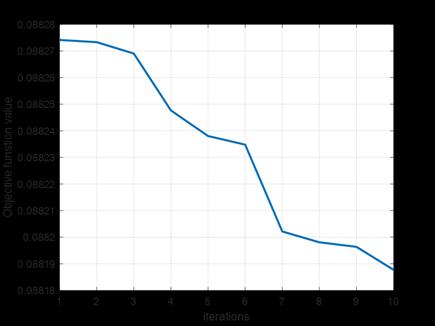
Fig-1: 69-Busconvergenceplot
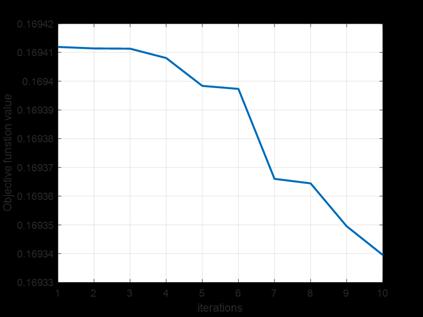
Fig- 2: 33-Busconvergenceplot
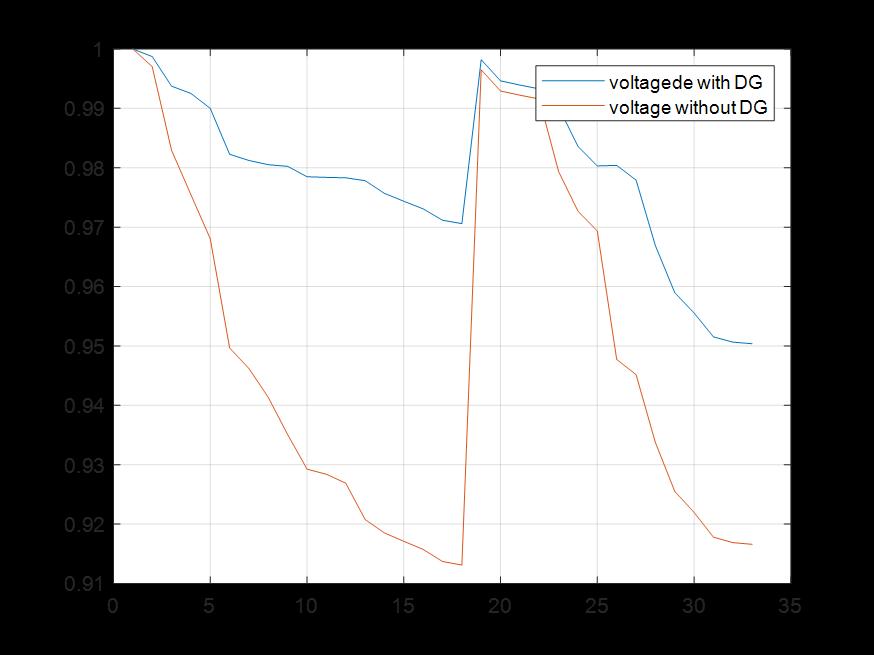
The obtained voltage magnitudes with and without DG placementofa69and33bussystemisshowninfig3and4. It is observed that is voltage profile enhances due to the placementofDG’s.
- 3: 69-Busvoltageprofile
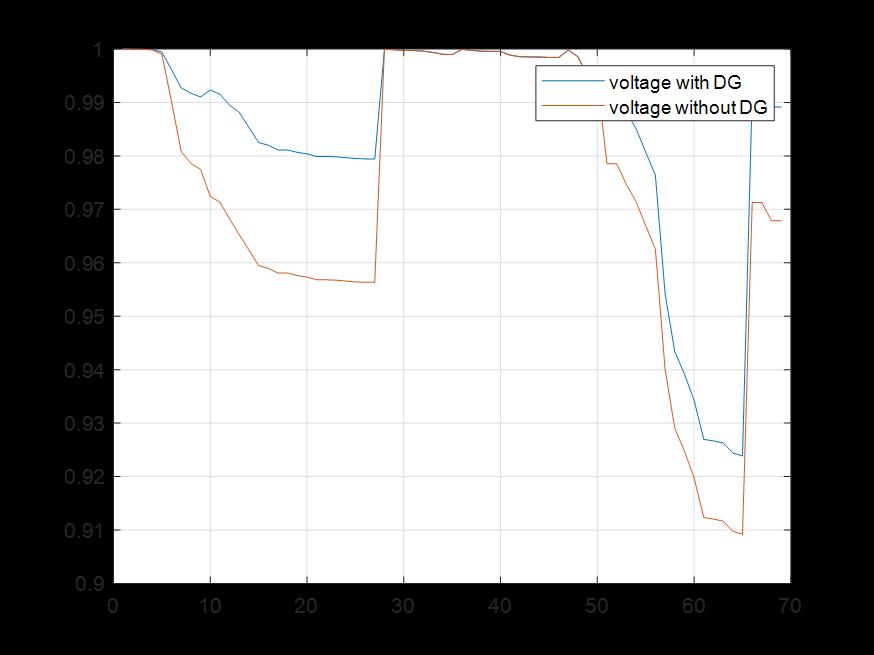
Fig- 4:33-Busvoltageprofile
International Research Journal of Engineering and Technology (IRJET) e-ISSN: 2395-0056
Volume: 11 Issue: 06 | Jun 2024 www.irjet.net p-ISSN: 2395-0072
Infigure5and6depictstheactivepowerlossofthe33 and69bussystems,anditisobservablethatthelossis significantlyreducesduetotheplacementsofDG’s.
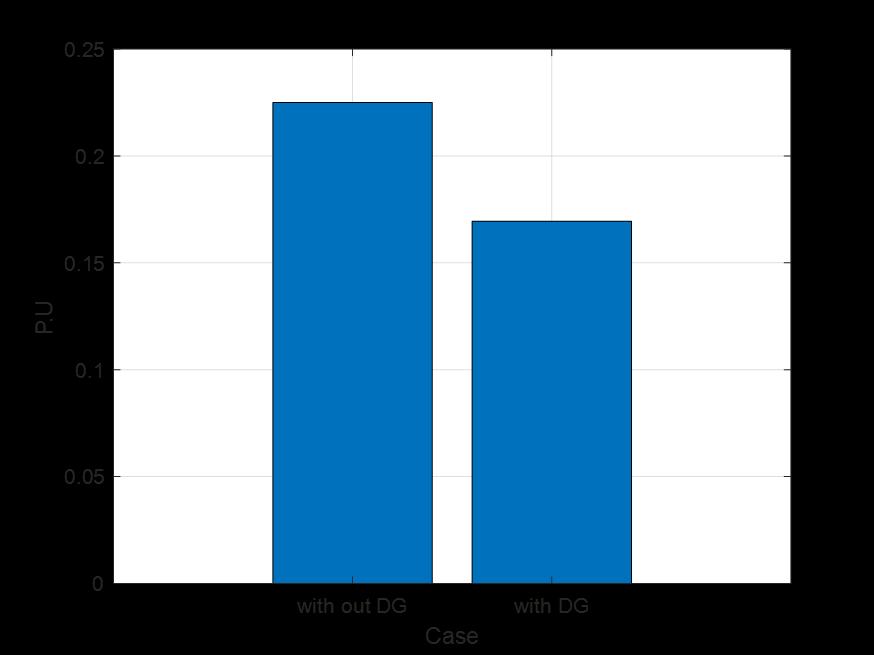
5: busactivepowerloss
Fig- 6 :33-busactivepowerloss
ThelocationandcapacityofplacedDG’saregivenintable4.
Table- 4 Comparisontable
Thesuggestedtechnique,testedonboththeIEEE33-busand 69-bustestdistributionsystems,yieldsencouragingresults, as seen by simulation results. Using the MATLAB 2021a environmentandthehybridPSO-EHOmethodforoptimum DG placement, the research successfully demonstrates systemperformanceimprovements.Figures1and2provide convergence graphs for objective function values across iterations, demonstrating the effectiveness of the optimization process. The subsequent examination of voltageprofiles,showninFigures3and4,demonstratesthe realadvantagesofDGdeployment,withsignificantincreases in voltage magnitudes throughout both systems. Furthermore,thedecreaseinactivepowerlosses,asshown in Figures 5 and 6, supports the suggested methodology's usefulnessinimprovingsystemefficiency.Table4containsa thoroughcomparisonofthelocationsandcapabilitiesofthe deployedDGs, whichprovidesinsights intotheirstrategic deployment within the systems. Overall, these findings support the hybrid PSO-EHO algorithm's practicality and usefulnessinoptimizingDGplacement,whichcontributesto improved system performance, voltage stability, and reducedpowerlossesinboth33-busand69-busdistribution systems
[1] M. El-Hawary, “The Smart Grid–State-of-the-Art and FutureTrends,” Electr. Power Components Syst.,2014.
[2] G. P. Keane, A.; Ochoa, L.F.; Borges, C.L.T.; Ault, G.W.; Alarcon-Rodriguez,A.D.;Currie,R.A.F.;Pilo,F.;Dent,C.J.; Harrison,“State-of-the-ArtTechniquesandChallenges Ahead for Distributed Generation Planning and Optimization,” IEEE Trans. Power Syst.,2013.
[3] D. Das, “Optimal placement of capacitors in radial distribution system using a Fuzzy-GA method,” Int. J. Electr. Power Energy Syst.,2008.
[4] A.NabaviandA.Akbarimajd,“AMethodforPlacement of DG Units in Distribution Networks,” IEEE Trans. Power Deliv.,2000.
[5] F. S. Abu-Mouti, “Optimal Distributed Generation Allocation and Sizing in Distributed Systems via Artificial Bee Colony Algorithm,” IEEE Trans. Power Deliv.,2011.
[6] M.Moradi,“Anefficienthybridmethodforsolvingthe optimal sitting and sizing problem of DG and shunt capacitor banks simultaneously based on imperialist competitive algorithm and genetic algorithm,” Int. J. Electr. Power Energy Syst.,2014.
[7] P. Singh, S. K. Bishnoi, and N. K. Meena, “Moth Search OptimizationforOptimalIntegrationofDERsforAnnual
International Research Journal of Engineering and Technology (IRJET) e-ISSN: 2395-0056
Volume: 11 Issue: 06 | Jun 2024 www.irjet.net p-ISSN: 2395-0072
Energy Loss Minimization in Distribution Systems,” India Int. Conf. Power Electron. IICPE, vol. 2018December, pp. 1–6, 2018, doi: 10.1109/IICPE.2018.8709410.
[8] D.SharmaandP.Singh,“OptimalPlanningofDistribute Energy Resources Sizing and Location Problem - A Review,” Proc. 2nd Int. Conf. Inven. Res. Comput. Appl. ICIRCA 2020, pp. 500–504, 2020, doi: 10.1109/ICIRCA48905.2020.9182899.
[9] P. S. Georgilakis, “Optimal Distributed Generation Placement in Power Distribution Networks: Models, Methods,andFutureResearch,” Power Syst.,2013.
[10] P. Singh, N. K. Meena, S. K. Bishnoi, B. Singh, and M. Bhadu, “Hybrid Elephant Herding and Particle Swarm OptimizationsforOptimalDGIntegrationinDistribution Networks,” Electr. Power Components Syst.,vol.48,no. 6–7, pp. 727–741, 2020, doi: 10.1080/15325008.2020.1797931.
[11] D.Kaur,“Multiperiodshuntcapacitorallocationinradial distributionsystems,” Int. J. Electr. Power & Energy Syst.,2013.
[12] P.Singh,S.K.Bishnoi,N.K.Meena,andF.IlahiBakhsh, “Novel Amalgamation of Bat and Elephant Herd Optimization Algorithms for Generation Mix in RenewableActiveDistributionNetworks,” Electr.Power Components Syst., pp. 1–25, doi: 10.1080/15325008.2023.2286348.
[13] A. El-Fergany, “Cuckoo Search-based Algorithm for Optimal Shunt Capacitors Allocations in Distribution Networks,” Electr. Power Components Syst.,2013.
[14] K. R. Swarnkar, Anil ; Gupta, Nikhil ; Niazi, “A novel codification for meta-heuristic techniques used in distribution network reconfiguration,” Electr. Power Syst. Res.,2011.
2024, IRJET | Impact Factor value: 8.226 |