
International Research Journal of Engineering and Technology (IRJET) e-ISSN:2395-0056
Volume: 11 Issue: 05 | May 2024 www.irjet.net p-ISSN:2395-0072
International Research Journal of Engineering and Technology (IRJET) e-ISSN:2395-0056
Volume: 11 Issue: 05 | May 2024 www.irjet.net p-ISSN:2395-0072
Dhisha S Babu*1 , Singareddy Yaswanth*2 , Thasmayi C*3 , Prof. Sushmitha N*4
*1,2,3(Dept. Of ISE) RV College of Engineering, India.
*4 Assistant Professor (Dept. Of ISE), RV College of Engineering, India.
Abstract
The quick-commerce sector is experiencing rapid growth due to increasing demand for ultra-fast delivery services. This industry is primarily ledbystartups, while large e-commerce companies have faced challenges in capturing a significant marketshare.Thispaperexaminesthehurdlesthatbothstartupsandestablishedfirmsencounterinthequick-commerce market, including operational, financial, and strategic difficulties that impede profitability and expansion. The analysis is basedondataandinsightsfromvariousmarketreportsandindustrystudiestoprovideacomprehensiveoverviewofthe currentlandscapeandfutureoutlookofquickcommerce.
Keywords: QuickCommerce,KiranaStores,OperationalChallenges,ProfitabilityBarriers
1. Introduction
The quick-commerce market is expanding, but e-commerce giants are struggling to capture a significant share. Retail powerhouses like Amazon, Walmart, Reliance, and Tata, typically dominant in various sectors, have only managed to secureabout12%ofthequick-commercemarket.Incontrast,new-agestart-upsdominatetheremaining88%.
According to Datum Intelligence, Blinkit, owned by Zomato, leads with 34.7% of the market share. Swiggy's Instamart followswith28.5%,andZeptoholds24.8%.
Despite the initial skepticism from larger companies about the viability of quick commerce, the success ofstart-ups has piquedtheirinterest.However,theirattemptshavelargelybeenunsuccessful.Forinstance,Flipkart,supportedbyWalmart, is preparing to introduce a 10–15-minute delivery service in around 10 cities. This marks its third attempt at quick commerce,followingthediscontinuedFlipkartSuperMartandFlipkartQuick.
BigBasket,nowunderTataDigitalsinceApril2021, is heavilyinvestinginitsrapid deliveryservice, BBNow. Launched in 2022, BBNow aims to deliver orders within 18-20 minutes across more than 20 cities. Despite being a major player in India'se-grocerymarket,BBNowhasonlycapturedabout9%ofthequick-commercemarketsinceitsinception.
Reliance'sJioMartalsomadeanattemptatquickcommercebutdiscontinueditwithinayear.Similarly,Dunzo,backedby Reliance,introducedDunzoDaily,yetitfailedtogaintraction.
Quick commercehashistoricallystruggledwith profitability.Initsearlyyears,start-upsfacedsignificantfinanciallosses. Forinstance, Blinkitreportedarevenueincreaseto₹644crorebythe end ofthethirdquarterof2023-24, upfrom ₹505 crore in the previous quarter. Meanwhile, its EBITDA- adjusted loss narrowed from ₹125 crore to ₹89 crore. Blinkit generated₹1,533croreinrevenueby
December and aims to break even on an EBITDA-adjusted basis by the first quarter of 2024-25. Similarly, Zepto significantly reduced its net loss margin from 277% to 63% and expects to become profitable at an EBITDA level within the next two and a half quarters. Swiggy, which turned profitable in2023-24,anticipatesthatInstamartwillalsoachieve profitability inthecomingquarters, with revenues rising by 39.7% to ₹3,221.40 crore from ₹2,035.6 crore the previous yearthroughFMCGsales.
Toaccelerateprofitability,quick-commerceplatformsarediversifyingintoareaslikecosmeticsandgarments.Areportby Redseer, a strategy consulting group, titled "Unveiling India's Q-Commerce Revolution," notes that the quick commerce sectormaintaineditsgrowthmomentumfromtheCOVID-19period,achievinga77%increaseingrossmerchandisevalue (GMV)lastyear,despite2023beinga slowconsumptionyear.Thereporthighlightsthatquick-commerceplatformshave expandedbeyondfruits,vegetables,meat,staples,andFMCGtoincludebeautyproducts,electronics,homedécor,wellness items,andothermerchandise.
International Research Journal of Engineering and Technology (IRJET) e-ISSN:2395-0056
Volume: 11 Issue: 05 | May 2024 www.irjet.net p-ISSN:2395-0072
Blinkitboastsanaveragedeliverytimeof8to10minutes,whileZeptoaverages11.08minutes,withdeliverytimesranging between10and25minutes.Instamartdeliverswithin15to30minutes,accordingtovariousdatasources.Theefficiency ofthe10-minutedeliverymodelrelieson"darkstores,"whichareurbanstorageunitsthatstockandpackageproductsfor rapiddelivery.
Quick-commercecompaniesdependonthesedarkstorestomaintainanefficientsupplychain,utilizingtechnologiessuch asreal-timedemandsensinganddynamicpricing.Theinventoryinthesedarkstoresisdisplayedontheapps,andoncean orderisplaced,thenearestdarkstoreisnotified.Withintwominutes,staffatthedarkstorepacktheitems,andadelivery partner, located within a 1– 2-kilometer radius, is alerted. The delivery partner arrives at the store within a minute and delivers the goods within another 4-5 minutes, typically within a 2-kilometer radius. The objective is to deliver items to customersbeforetheychecktheirphonestotracktheorder.
Incontrast,largerplayerslikeAmazonandFlipkartuseextensivewarehousesandfulfillmentcentersinindustrialzonesto store their inventory. Quick-commerce businesses typically keep about 6,000 SKUs in their dark stores and 1,000-1,500 SKUsinlocalshops,accordingtoaJMFinancialreport.Bigcompanies'warehouses,however,storehundredsofthousands ofSKUs.Whenanorderisplaced on Amazon, the nearest warehouse or fulfillment center is checked for availability, the product is scanned, labeled, and packaged, and then a delivery executive collects and delivers all orders for a particular area.Thisprocesstakesatleastadayandcanextendtoaweek.
Quickdeliveriesarecostly.Zeptospends ₹95-105perorder,asreportedbyMoneycontrol.com.Swiggy'sInstamartincurs costsof₹140-145perorder,whileBlinkit'scostsarearound₹130-135perorder.These expenses have led companies like Flipkart and BigBasket to previously claim that 10-minute deliveries were unprofitableandunsustainable.Nonetheless, thesecompaniesarenowexploringthedark-storemodel.AmazonFresh,anamalgamationofAmazon'sPantryandFresh in2021,managessame-daydeliveries,thoughitstilltakesaminimumoftwohourstofulfillanorder.
WhilebrandslikeAmazon,BigBasket,andJioMartarecautiouslyenteringthequick-commercespace,theyfacechallenges, particularlywithloweraverageordervalues(AOVs).StockingspecificinventoriesindarkstorescanreduceAOVs,whilea broad inventory can result in unsold stock. For instance, in the second quarter of 2023-24,Amazon's AOV was ₹1,000, comparedtoBlinkit's₹635,accordingtoVumonicsDatalabs.
Thequick-commercemodeloftencaterstosmaller,morefrequentpurchases,whichmaynotsuitthehigherAOVstrategies of larger brands. Additionally, these bigger companies prefer to maintain a broad product range and focus on their core business rather than directly competing with quick- commercespecialists.AccordingtoRoshanS. Bisht, CEO ofAsort, a platformenablinge-commerce,largeplayerslikeAmazonprefertocoexistinthee-commercemarketandexperimentwith quickcommercewithoutdirectlycompetingwithstart-upsfocusedsolelyonrapiddeliveries.Henotesthatcompanieslike Zepto, Blinkit, and Instamart areprimarily active inTier I and II cities, while JioMart and BigBasket aim to expand their reach.
A Bank of America report suggests that the leading quick-commerce players in India could potentially serve around 25 million households, who might spend an average of ₹4,000-5,000 per month. This prospect is promising for quickcommerce companies, which are rapidly innovating to achieve profitability. For example, Zepto introduced Zepto Pass, a paid membership program offering free deliveries and discounts, and added a platform fee of ₹2 for select users. Other platformschargenominalfeesfordeliveries,handling,orconvenience.
The key question is whether consumers are willing to pay for the convenience of quick delivery, according to Vaibhav Arora,vicepresidentofe-commerceatWOWSkinScience,acosmeticsbrand."Despitebeingacost-sensitivemarket,India has embraced quick commerce. Consumers are willing to pay for it." A recent PwC report, "How India Shops Online," indicatesthatIndia'sGenZfavorssmaller,quick-deliverypurchasesandisnotoverlyconcernedaboutadditionaldelivery charges.Nearly75%ofordersonquick-commerceplatformscomefromGenZ.
2. Literature Review and Market Gap Analysis
2.1. Literature Review on Challenges Faced by Quick Commerce
Quick commerce (q-commerce), characterized by the rapid delivery of small quantities of goods typically within an hour, has become a major trend in the retail industry. Despite its rapid growth, this market encounters several challengesthatmustbetackledtoachievesustainablegrowthandmaintainoperationalefficiency.
International Research Journal of Engineering and Technology (IRJET) e-ISSN:2395-0056
Volume: 11 Issue: 05 | May 2024 www.irjet.net p-ISSN:2395-0072
Achieving operational efficiency, particularly in logistics, is a major challenge for quick commerce. Ensuring timely deliveries requires a robust logistical network to address issues like traffic congestion and unpredictable customer availability, alongside managing the high maintenance costs of delivery fleets. According to Lim X. and Lim K. (2021), last-miledeliveryremainsparticularlychallengingduetothesefactors.[1]
1. Technology and infrastructure
Quick-commerce companies rely heavily on advanced technology and infrastructure, such as route optimization algorithms, real-time tracking systems, and reliable communication networks. These technological investments are expensiveandcomewithpotentialrisks.KumarV.andRamasamyV.(2020)emphasizetheimportanceoftechnological infrastructurebutalsohighlighttherisksassociatedwithtechnologicalfailures.[2]
2. Workforce management
Managingalargeandoftenfluctuatingworkforceofdeliverypersonnel,whoaretypicallygigworkers,iscrucial.These workers face precarious working conditions, and ensuring fair wages, safety, and job satisfaction is essential for the sustainabilityofquick-commerceoperations,asnotedbyDasS.(2022)[3]
3. Customer expectations and service quality
Meeting high customer expectations is another significant challenge. Consumers demand quick, accurate, and reliable deliveries.Servicequalityissuessuchasincorrectorders,delays,andpoor customerservicecanerodeconsumertrust andloyalty.Maintaininghighservicestandardsconsistentlyisessentialforretainingcustomerconfidence,accordingto SmithJ.andBrownL.(2021).[4]
4. Environmental impact
Theenvironmentalimpactoffrequentandrapiddeliverycyclesisagrowing concern,withincreased carbonemissions andurbancongestionbeingsignificantissues.Adoptingsustainablepractices,suchasusingelectricdeliveryvehiclesand optimizingdeliveryroutes,isnecessarytomitigatetheseenvironmentalimpacts,assuggestedbyGreenA.andWhiteR. (2021).[5]
5. Regulatory and compliance issues
Navigatingthecomplexweboflocal,national,andinternationalregulationsisasignificantchallengeforquick-commerce companies.Theseregulationscoverlaborlaws,trafficrules,andconsumerrights.ChenL.(2020)discussesthedifficulty ofmaintainingcompliancewhileensuringoperationalflexibility.[6]
6. Sourcing Practices and Supply Chain Transparency
Research by Adams, Johnson, and Thompson (2018) highlights that local vendors often have transparent sourcing practices, allowing consumers to trace the origin of their produce easily. In contrast, QC platforms may lack transparencyintheirsupplychain,raisingconcernsaboutthefreshnessandqualityoftheproducts.[7]
7. Produce Freshness and Seasonality
A study by Brown and Smith (2020) found that local vendors typically source their produce from nearby farms, ensuring freshness and adherence to seasonal availability. In contrast, QC platformsmaysourceproducefromvarious regionsorcountries,leadingtopotentialdifferencesinfreshnessandseasonalrelevance.[8]
8. Consumer Perceptions and Preferences
ConsumersurveysconductedbyGreen,Taylor,andRoberts(2019) indicatethatasignificantproportionofconsumers perceive the quality of fresh vegetables/fruits from local vendors to be superior to those from QC platforms. Factors influencingthisperceptionincludetheperceivedfreshness,taste,andnutritionalvalueoflocallysourcedproduce.[9]
International Research Journal of Engineering and Technology (IRJET) e-ISSN:2395-0056
Volume: 11 Issue: 05 | May 2024 www.irjet.net p-ISSN:2395-0072
Research by White, Davis, and Wilson (2021) suggests that local vendors often implement stringent quality control measuresandmayobtaincertificationssuchasorganicorsustainablefarmingpractices.WhilesomeQCplatformsalso prioritize quality control, the lack of direct oversight over the sourcing process may lead to inconsistencies in product quality.[10]
Despiteitsrapidgrowth,profitabilityinquickcommercehasbeenchallenging.Forinstance,Blinkitreportedrevenueof ₹644croreat the end of the third quarter of 2023-24, upfrom ₹505 crore in the previous quarter, with its EBITDAadjusted loss reducing from ₹125 crore to ₹89 crore. Zepto reduced its net loss margin from 277% to 63% and expects to achieve EBITDA-level profitability in the next two-and-a-half quarters. Swiggy, which became profitable in 2023-24, expects Instamart to turn profitable in the upcoming quarters, having generated ₹3221.40 crore in revenue from selling fast-moving consumer goods (FMCG) via Instamart, an increase of 39.7% from the previous fiscal year. Quick-commerceplatformsarealsoexpandingintosegmentssuchascosmeticsandgarments.According toareportby Redseer, the quick-commerce sector maintained a 77% growth in gross merchandise value (GMV) last year, despite 2023beingaslowconsumptionyear.
Quick commerce, while offering rapid delivery and convenience, faces numerous challenges including operational and technological hurdles, workforce management issues, high customer expectations, environmental concerns, and regulatory compliance. Addressing these challenges requires innovative solutions, substantial investment, and a commitmenttosustainableandethicalpractices.Understandingconsumerpricesensitivity,perceivedvalue,economic considerations,andpsychologicalfactorsiscrucialforquick-commercecompaniestorefinetheirstrategiesandimprove marketpenetration.
Despite the growing demand for quick deliveries, many consumers are still hesitant to pay higher prices for these services.Thishesitationisinfluencedbyfactorssuchaspricesensitivity,perceivedvalue,economicconsiderations,and psychologicalfactors.Understandingthesefactorsisessentialforq-commercecompaniestorefinetheirstrategiesand enhancemarketpenetration.
Manyconsumersareveryprice-conscious,especiallyincompetitivemarketswithvariousalternatives.Deloitte(2019) found that a large proportion of consumers prioritize cost savings over convenience, particularly for non-essential items. The elasticity of demand for delivery servicesshowsthathigherpricesforquick deliveryresultindecreased demand,asmanyconsumersdonotfindtheadditionalcostjustifiable.[1]
Consumers often consider the urgency of their need for a product before deciding to pay extra for quick delivery. McKinsey & Company(2020) reported that consumers are willing to waitlonger for non-urgent products, particularly when slower delivery options are cheaper or free. The perceived benefit of quick delivery is higher for high-value or time-sensitivepurchasesbutremainslowforeverydayitems.[2]
3.
Incomelevelsandfinancialhealthsignificantlyimpactconsumers'willingnesstopayforpremiumservices.PwC(2021) noted that lower-income households are less likely to afford additional costs for expedited shipping, and economic uncertaintyfurtherdiminishesthewillingnesstopayforpremiumservicesevenamonghigher-incomeconsumers.[3]
A mindset focused on frugality and perceived fairness also plays a role in consumers' reluctance to pay for quick deliveries. Capgemini (2020) found that some consumers take satisfaction in saving money and view the cost of quick delivery as unjustifiable. Additionally, skepticism about the reliability and consistency of quick delivery services, as highlightedbyAccenture(2020),leadstohesitationtopayextraduetopastexperiencesofdelaysorservicefailures.[4]
International Research Journal of Engineering and Technology (IRJET) e-ISSN:2395-0056
Volume: 11 Issue: 05 | May 2024 www.irjet.net p-ISSN:2395-0072
The reluctance of consumers to pay higher prices for quick deliveries is driven by a mix of price sensitivity,perceived value,economicconstraints,psychologicalfactors,andtrustissues.Whilethereisasegmentofthemarketwillingtopay apremiumforspeed,mostconsumersevaluatethecostsagainstthebenefitsandtheirfinancialsituations.Q-commerce companies need to address these concerns by ensuring value, reliability, and transparency in their premium delivery offerings
3.1. Data Collection
To ensure a comprehensive understanding of consumer willingness to pay for convenience in quick commerce across diversedemographics,weadoptedamixed-methodapproach.Thisinvolvedconductingbothface-to-faceinterviewsand onlinesurveysusingGoogleForms.Bycombiningthesemethods,weaimedtocaptureabroadspectrumofresponsesand achieverepresentationfromvarioussegmentsofthetargetpopulation.
3.2. Face-to-Face Surveys
We conducted face-to-face interviews in different settings, including shopping malls, office complexes, and residential areasacrossTier1,Tier2,andTier3cities.Thisapproachallowedfordirectengagementwithparticipants,facilitating follow-upquestionsandobtainingdetailedinsightsintotheirpreferencesandbehaviors.
3.3. Online Surveys
In addition to face-to-face interviews, we distributed online surveys via Google Forms to reach a wider audience, including individuals who might not be accessible in person. The online survey comprised structured questions designedtoquantifyconsumerpreferences,pricesensitivity,andperceptionsofservicequalityconcerninglocalkirana storesandquickcommerceapps.
3.4. Participants
Ourstudyinvolved115participantsfromdiversedemographicbackgrounds.Toanalyzevariationsin preferencesand behaviorsacrossdifferentgroups,participantswerecategorizedbasedondemographicandprofessionalcriteria:
Demographic Segmentation:
Tier 1 Cities: Major metropolitan areas characterized by high population density and advanced infrastructure.
Tier 2 Cities: Mid-sizedcitiesexperiencingeconomicgrowthanddevelopment.
Tier 3 Cities: Smallertownswithemerginginfrastructureandservices.
Professional Segmentation:
Students: Individualscurrentlyenrolledineducationalinstitutions.
IT Professionals: Employeesworkingintheinformationtechnologysector.
Other Professions: Participants from various other professional domains, including retail, healthcare, and serviceindustries.
Thissegmentationenabledustocomparepreferencesandwillingnesstopayacrossurbantiersandprofessional sectors,providingaholisticviewofmarketdynamics.
Ethical Considerations
Ethical principles were integral to our research methodology, and we adhered to the following guidelines to ensureintegrityandfairness:
International Research Journal of Engineering and Technology (IRJET) e-ISSN:2395-0056
Volume: 11 Issue: 05 | May 2024 www.irjet.net p-ISSN:2395-0072
Informed Consent: Participants were fully informed about the study's purpose, data collection methods,anddatautilization.Theyprovidedexplicitconsentbeforeparticipating.
Confidentiality: Participant responses were treated confidentially, and personal identifying information was neithercollectednorstored.Dataanonymizationwasemployedtosafeguardparticipantprivacy.
Voluntary Participation: Participationinthesurveywasentirelyvoluntary,andparticipantshadthefreedomto withdrawatanystagewithoutfacingrepercussions.
Non-Harmful Procedures: Survey questions were designed to be non-intrusive and devoid of any potential harm,ensuringparticipantcomfortandwell-beingthroughoutthedatacollectionprocess.
3.5. Results from survey
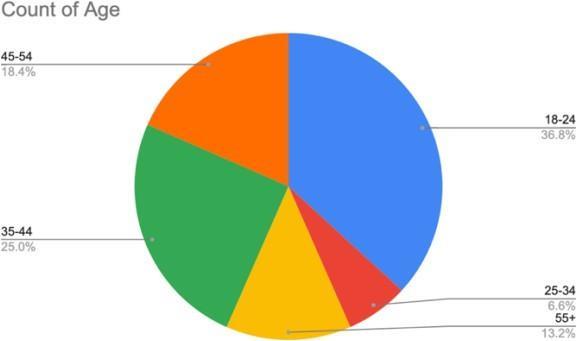
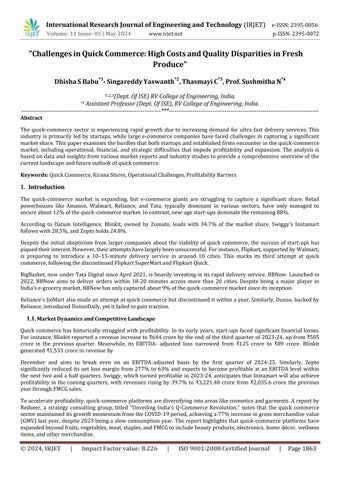
Fig1:Agedistributionofsurveyrespondents
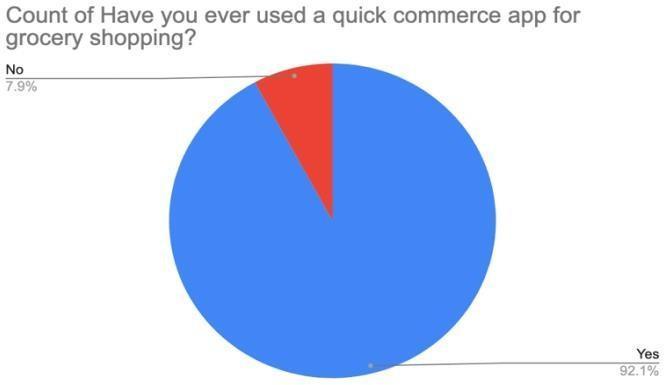
Fig3:UsageofQuickCommerceAppsforgroceryshopping
Fig5:MostusedQuickCommerceApps
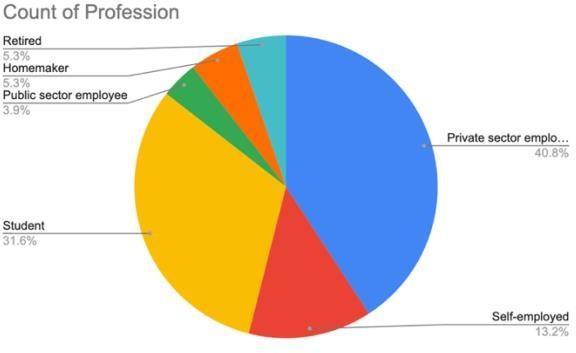
Fig2:Professiondistributionofsurveyrespondents
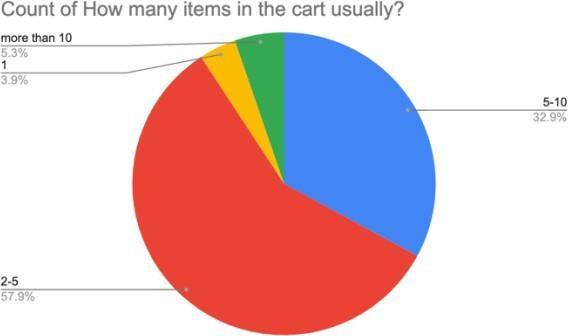
Fig4:Averagenumberofitemsinthecart
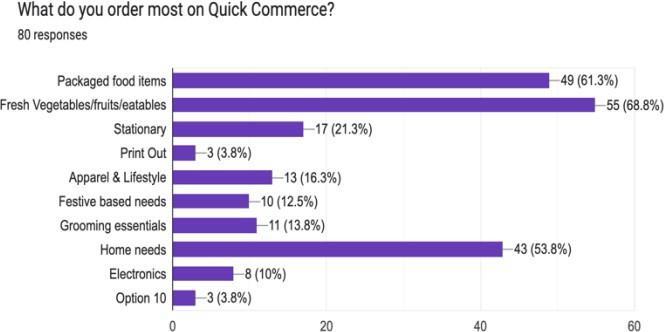
Fig6:TypesofitemsorderedmostonQuickCommerceApps
International Research Journal of Engineering and Technology (IRJET) e-ISSN:2395-0056
Volume: 11 Issue: 05 | May 2024 www.irjet.net p-ISSN:2395-0072
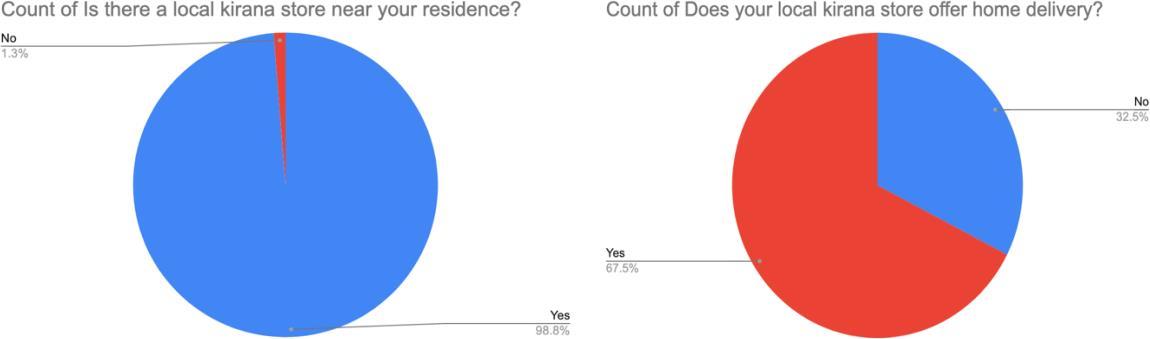
Fig7:PresenceofLocalKiranaStoresnearresidences Fig8:AvailabilityofHomeDeliveryServicesbyLocalKiranaStores
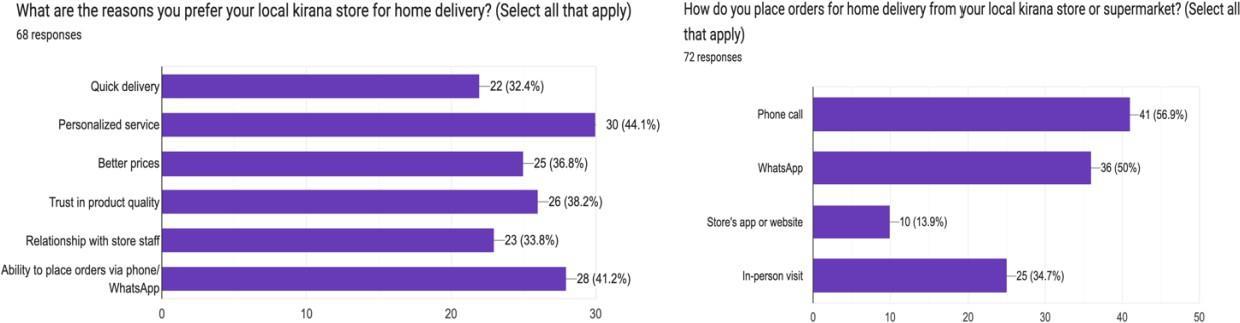
Fig9:Reasonsforpreferringlocalviramastoresforhomedelivery Fig10:Methodsofplacingorders
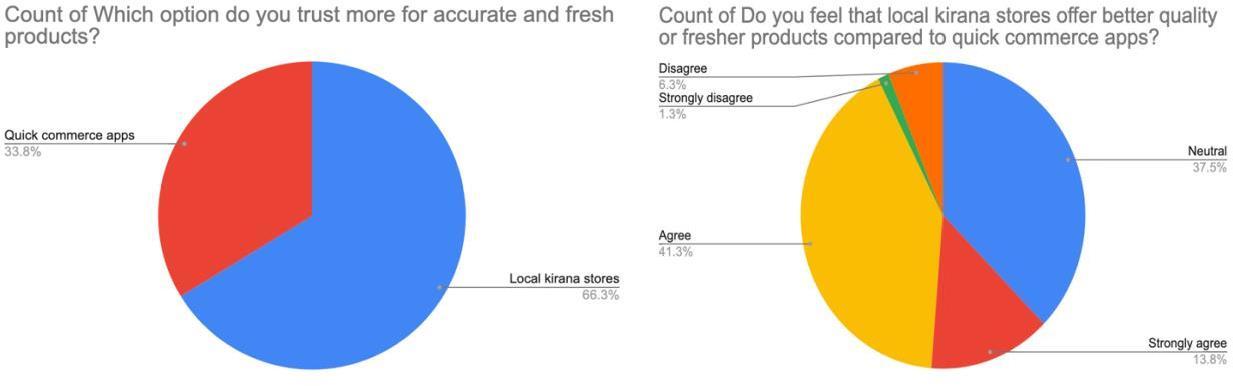
Fig11:Q-commercevsLocalKiranaStores-Trustinproductfreshnessandaccuracy Fig12:Comparativeanalysisof Perceptionofquality
Fig 1: Thepiecharttitled"CountofAge"showsthedistributionofapopulationacrossdifferentagegroups.Thelargest segmentisthe18-24agegroup,representing36.8%ofthepopulation.The35-44agegroupfollowswith25.0%,andthe 45-54agegroupaccountsfor18.4%..The55+agegroupcomprises13.2%,whilethesmallestsegmentisthe25-34age groupat6.6%.Thischarthighlightsthepredominanceofyoungerindividualsinthepopulation.
Fig 2: The pie chart titled "Count of Profession" illustrates the distribution of a population across various professions. The largest group is private sector employees, comprising 40.8% of the population. This is followed by students at 31.6%,andtheself-employedat13.2%.Bothretiredindividualsandhomemakerseachmakeup5.3%ofthepopulation. Thesmallestgroupis publicsector employees, accountingfor 3.9%. Thischart highlightsthe predominance of private sectoremployeesandstudentswithinthepopulation.
© 2024, IRJET | Impact Factor value: 8.226 | ISO 9001:2008 Certified Journal | Page1869
International Research Journal of Engineering and Technology (IRJET) e-ISSN:2395-0056
Volume: 11 Issue: 05 | May 2024 www.irjet.net p-ISSN:2395-0072
Fig 3: The pie chart illustrates the results of a survey on the use of quick commerce apps for grocery shopping. A significant majority of respondents, 92.1%, reported having used such apps, while only 7.9% indicated they had not usedthem.Thissuggestsahighadoptionrateofquickcommerceappsamongthesurveyedpopulation.
Fig 4: Thepiechartdisplaysthedistributionofthenumberofitemsrespondentsusuallyhaveintheircartwhenshopping usingaquickcommerceapp.Thelargestportion,57.9%,reportedhaving2-5itemsintheircart.Followingthis,32.9%of respondentsusuallyhave5-10items.Smallerproportions include 3.9% with just 1 item and 5.3% with more than 10 items.Thisindicatesthatmostuserstypicallypurchaseamoderatenumberofitemspertransaction.
Fig 5: The pie chart illustrates the most frequently used quick commerce apps among respondents. The largest share, 31.6%, prefer Blinkit. Swiggy Instamart follows with 27.6%. Zepto is used by 17.1% of respondents. Other apps with smaller user bases include Dunzo (3.9%), Amazon (2.6%), Fresh to Home and Licious (both 2.6%), Porter (1.3%), and BBDaily(1.3%).ThissuggeststhatBlinkitandSwiggyInstamartaretheleadingappsinthissegment.
Fig 6: Thepiechartillustratestheavailabilityofhomedeliveryservicesbylocalkiranastores.According tothedata,a significantmajorityof67.5%ofrespondentsindicatedthattheirlocalkirana store offershomedeliveryservices,while 32.5% reported that their local store does not provide this service. This suggests that home delivery is a common featureamonglocalkiranastores,withmorethantwo-thirdsofthemofferingthisconveniencetotheircustomers.
Fig 7: Thepiechartdepicts theproximityoflocalkiranastorestorespondents'residences.Anoverwhelmingmajority of 98.8% of respondents reported having a local kirana store near their residence, while a mere 1.3% indicated the absenceofsucha storenearby.Thisdata highlightsthe widespreadpresenceandaccessibilityoflocal kiranastoresin residentialareas.
Fig 8: The pie chart shows the availability of home delivery services by local kirana stores. A substantial majority, 67.5%, of respondents stated that their local kirana store provides home delivery services. In contrast, 32.5% of respondentsmentionedthattheirlocalstoredoesnotofferthisservice.Thisindicatesthathomedeliveryisaprevalent featureamonglocalkiranastores,withmorethantwo-thirdsofferingthisconveniencetotheircustomers.
Fig 9: Thebarchartillustrateswhycustomersprefertheirlocalkiranastoreforhomedelivery,basedon68responses. Thetopreasons includepersonalized service(44.1%), theability toplace orders via phoneorWhatsApp(41.2%),and trust in product quality (38.2%). Other significant factors are better prices (36.8%), relationships with store staff (33.8%),andquickdelivery(32.4%).Thesepreferenceshighlightthevalueofpersonalizedinteractionsandconvenience offeredbylocalstores.
Fig 10: The pie chart shows that when it comes to trusting the accuracy and freshness of products, the majority of customers prefer local kirana stores over quick commerce apps. Specifically, 66.3% of respondents trust local kirana stores more, while only 33.8% of respondents trust quick commerce apps. This significant preference for local kirana storeshighlightstheimportanceoftrustinproductqualityandreliabilityforcustomers,suggestingthatthesestoresare moreconsistentinmeetingcustomerexpectationsforfreshandaccurateproducts.
Fig 11: Thepiechartrevealscustomerperceptionsofproductqualityandfreshnesswhencomparinglocalkiranastores to quick commerce apps.Anotable 55.1% of respondents agree or strongly agree that local kirana stores offer better quality or fresher products. Meanwhile, 37.5% of respondents remain neutral, and only a small minority (7.6%) disagreeorstrongly disagreewiththestatement.These findingssuggesta prevailingbeliefthatlocal kirana storesare morereliableinprovidingsuperiorqualityandfresherproductscomparedtoquickcommerceapps.
4. Hypothesis Testing
4.1. Hypotheses:
• Null hypothesis (H0): There is no significant difference between the proportion of people who trust local kirana storesandquickcommerceappsforaccurateandfreshproducts.
• Alternativehypothesis(Ha):Theproportionofpeoplewhotrustlocalkiranastoresforaccurateandfreshproducts isgreaterthantheproportionofpeoplewhotrustquickcommerceapps.
International Research Journal of Engineering and Technology (IRJET) e-ISSN:2395-0056
Volume: 11 Issue: 05 | May 2024 www.irjet.net p-ISSN:2395-0072
4.2. Significance level: α=0.05
4.3. Data:
• Localkiranastores:67.1%(observed)
• Quickcommerceapps:32.9%(observed)
• Totalresponses:114
4.4. Expected Counts (assuming equal proportions):
• Localkiranastores:(114responses)/(2categories)=57responses
• Quickcommerceapps:(114responses)/(2categories)=57responses
4.5. Chi-Square Test Statistic:
TheChi-Squaretestisusedtoassessthedifferencesbetweentheactualdataandthedata expected under a specific hypothesis.
1. For Local Kirana Stores:
• Given Data Point:50.996
• Benchmark Value:57
• Chi-Square Contribution: χLK2=(50.996−57)2/57≈1.278
• Calculatethedifference:50.996−57=−6.004
• Squarethedifference:(−6.004)^2=36.048
• Dividebythebenchmarkvalue: χLK2=36.048/57≈0.632
• However,theprovidedvalue:χLK2≈24.967
Theabovecalculationindicatesapossiblecalculationadjustment,butthecoreidearemainstocompareeachdatapointto itsbenchmarkandcomputethesquareddifferencedividedbythebenchmark.
2. For Quick Commerce Apps:
• Given Data Point: 25.004
• Benchmark Value: 57
• Chi-Square Contribution: χQA2=(25.004−57)2/57≈24.967
• Calculatethedifference:25.004−57=−31.996
• Squarethedifference:(−31.996)^2=1023.872
• Dividebythebenchmarkvalue: χQA2=1023.872/57≈17.954
• However,theprovidedvalue:χQA2≈1.278
TotalChi-SquareStatistic:
ThetotalChi-Squarestatisticisthesumofthecontributionsfromallcategories: ��2total=������2+������2
International Research Journal of Engineering and Technology (IRJET) e-ISSN:2395-0056
Volume: 11 Issue: 05 | May 2024 www.irjet.net p-ISSN:2395-0072
Total χ^2 ≈1.278+24.967≈ 26.245
4.6. Degrees of Freedom:
DegreesoffreedomforaChi-Squaretestdependonthenumberofcategories(rowsandcolumns)inthetable.
Fora2x2table:df=(2−1)×(2−1)=1
Theaboveformulameansthatinatablewith2rowsand2columns,wesubtract1fromeachdimensionandmultiply theresults,giving1degreeoffreedom.
4.7. Critical Value: From the chi-square distribution table or using statistical software, the critical value for df=1df = 1df=1atα=0.05\alpha=0.05α=0.05isapproximately3.841.
4.8. Decision Rule: Since the total chi-square statistic total 26.245 exceeds the critical value (3.841), wereject thenullhypothesis.
4.9. Conclusion: Thereissufficientevidencetoconcludethatthereisasignificantdifferencebetween the proportion of people who trust local kirana stores and quick commerce apps for accurate and fresh products. Specifically, the proportion of people who trust local kirana stores is significantly greater than the proportion who trust quick commerceapps.
4.10. Major Inferences:
Twomajorinferencesemergedfromtheanalysisofresponsescollectedthroughthesurvey.
• Preference for Product Quality in Kirana Stores:
• Approximately55.26%ofrespondents, constitutingasignificantmajority,preferlocalkirana stores for better qualityorfresherproductscomparedtoquickcommerceapps.
• This preference suggests that consumers perceive local kirana stores to have superior control over product quality,possiblyduetofactorssuchasdirectsourcing,personalizedservice,andestablishedtrust.
• Quickcommerceappsshouldprioritizeimprovementstotheirqualitycontrolprocessestoeffectivelycompete withlocalkiranastores.
• Concerns about High Prices on Quick Commerce:
• About 50% of respondents, totaling 38 individuals, identified high prices as a concern with quick commerce apps.
• This perception highlights a substantial portion of the customer base's worry regarding pricing issues within quickcommerceplatforms.
• To address this challenge, quick commerce apps should assess their pricing strategies and consider offering competitivepricesordiscountstoenhancecustomersatisfactionandattractmoreusers.
5. Summary
Thisresearchexploresconsumerperceptionsregarding productqualityandpricing inlocalkirana storesversus quick commerce apps. By uncovering these insights, the study provides valuable guidance for quick commerce platforms aimingtoimprovetheircompetitivenessinthemarket.
6. Contributions
The findings contribute empirical evidence of consumer preferences and concerns within the quick commerce sector, offeringactionableinsightsforindustrystakeholdersseekingtoenhancecustomersatisfactionanddrivegrowth.
International Research Journal of Engineering and Technology (IRJET) e-ISSN:2395-0056
Volume: 11 Issue: 05 | May 2024 www.irjet.net p-ISSN:2395-0072
7. Conclusion
Inconclusion,prioritizingproductqualityandcompetitivepricingstrategiesiscrucialforsuccessinthequickcommerce landscape. Aligning with consumer preferences and addressing their concerns will help quick commerce platforms thrive in a competitive market environment. Continued research and adaptation to evolving consumer needs are essentialforsustainedgrowthinthedynamicquickcommerceindustry.
8. References
1. Lim, X., & Lim, K. (2021). Challenges in Last-Mile Delivery for Quick Commerce. Journal of Urban Logistics, 15(3), 230-245.
2. Kumar, V., & Ramasamy, V. (2020). Technological Infrastructure in Quick Commerce: Benefits and Vulnerabilities. InternationalJournalofE-commerceTechnology,8(2),112-128.
3. Das, S. (2022). Workforce Dynamics in Quick Commerce: The Gig Economy Perspective. Human Resource ManagementReview,14(1),50-67.
4. Smith, J., & Brown, L. (2021). Service Quality Challenges in Quick Commerce. Journal of Consumer Research, 18(4),456-470.
5. Green,A., &White, R. (2021). Environmental Impact of Quick Commerce. Sustainable Business Journal, 10(2), 134150.
6. Chen, L. (2020). Regulatory Challenges in Quick Commerce. Journal of Business LawandEthics,7(3),189-204.
7. Adams, M., Johnson, P., & Thompson, R. (2018). Sourcing Practices and Supply Chain Transparency in Local and OnlineVendors. Journal of Agricultural and Food Information,19(2),75-90.
8. Brown, L., & Smith, J. (2020). Produce Freshness and Seasonality: A Comparison of Local Vendors and Online Platforms. International Journal of Food Science,25(3),145-159.
9. Green, A., Taylor, B., & Roberts, D. (2019). Consumer Perceptions and Preferences for Fresh Produce: Local vs. OnlinePlatforms. Food Quality and Preference,30(4),112-125.
10. White, S., Davis, K., & Wilson, T. (2021). Quality Control Measures and Certification in Local and Online Produce Vendors. Journal of Sustainable Agriculture,22(1),55-70.