
International Research Journal of Engineering and Technology (IRJET) e-ISSN: 2395-0056
Volume: 11 Issue: 05 | May 2024 www.irjet.net p-ISSN: 2395-0072
International Research Journal of Engineering and Technology (IRJET) e-ISSN: 2395-0056
Volume: 11 Issue: 05 | May 2024 www.irjet.net p-ISSN: 2395-0072
R. R. Ahire1 , N. K. Aher2 , K. T. Gaikwad3, S. M. Valvi4 , A.V. Dudhekar5
1,2,3,4 Student, Department of Civil Engineering, KK Wagh Institute of Engineering Education and Research, Nashik, India
5 Prof., Department of Civil Engineering, KK Wagh Institute of Engineering Education and Research, Nashik, India ***
Abstract - This research delves into an in-depth analysis of groundwater modeling and recharge pit assessment in Nashik district using MODELMUSE MODFLOW-6 simulations. Data from Survey of India, Open Topography, and India WRIS websites were processed to create Thiessen polygons around 18 observation wells, with two models per polygon developed to study the impact of recharge pits over a year. Various parameters including aquifer characteristics, EVT rates, recharge rates, hydraulic conductivities, sediment thickness, and drain conductance were considered. Different scenarios based on minimum, average, and maximum conditions were explored to evaluate groundwater dynamics. The introduction of recharge pits led to a notable increase in groundwater inflow, with 3248 strategically placed recharge pits influencing observation wells. Additionally, satellite imagery from the Bhuvan portal was utilized to derive a land use map for Nashik district, aiding in well placement in areas of low elevation and barren land. The research findings provide valuable insights for sustainable water resource management in Nashik district
Key Words: Groundwater,GIS,Shapefiles,DEM
1.INTRODUCTION ( Size 11 , cambria font)
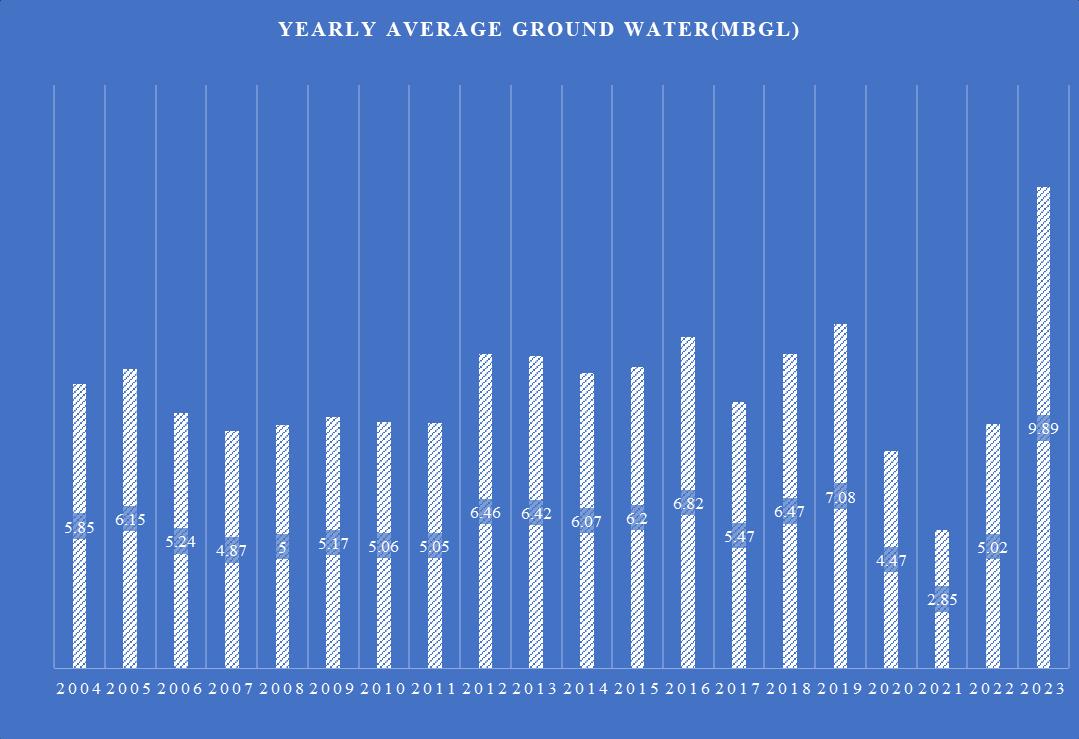
NashikDistrict,situatedinMaharashtra,India,coversanexpanseof15,525squarekilometersandsupportsapopulation exceeding6million.Overthepast19years,theregionhaswitnessedasignificantdeclineingroundwaterlevels,with2023 markingarecordlowof9.89metersbelowgroundlevel.DatafromtheIndiaWaterResourcesInformationSystemhighlights thepressingneedforsustainablegroundwatermanagementinNashikDistrict.Innumerousvillages,womenendurelong journeystofetchwater,underscoringtheprofoundimpactofdwindlinggroundwaterresourcesonlocalcommunities.
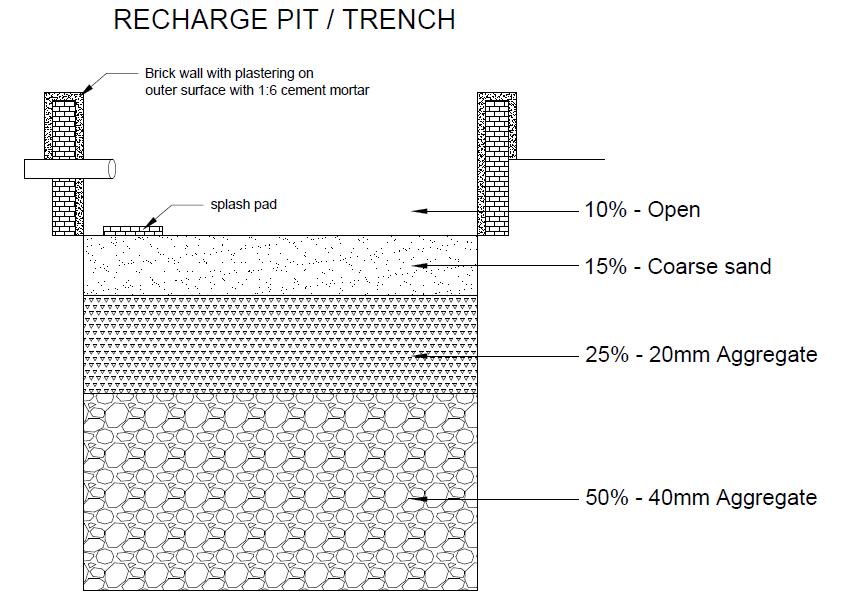
Groundwaterrechargestructuresplayavitalroleinreplenishingaquifersandsustainingwaterresourcesinregionsfacing waterscarcity.Amongthesestructures,rechargepitsstandoutasaprimarymethodforaugmentinggroundwaterlevelsby facilitatingtheinfiltrationofsurfacewaterintotheunderlyingaquifer.Rechargepitsarestrategicallydesignedtocaptureand percolatewaterefficiently,aidinginmaintainingthewatertableandmitigatingtheeffectsofexcessivegroundwaterextraction.
Rechargepitsareman-madestructuresstrategicallylocatedinareaswithfavorablesoilpermeabilitytopromoteefficient waterseepageintotheground.Thesepitsserveasessentialcomponentsofsustainablewatermanagementpractices,enabling the gradual infiltration of collected water into the aquifer to replenish the groundwater table. By supporting natural groundwaterrechargeprocesses,rechargepitscontributesignificantlytowaterconservationefforts,watertablestability,and mitigationofdroughtimpacts.
International Research Journal of Engineering and Technology (IRJET) e-ISSN: 2395-0056
Volume: 11 Issue: 05 | May 2024 www.irjet.net p-ISSN: 2395-0072
Variousresearchendeavourshavebeenundertakentocomprehensivelyanalysegroundwaterdynamicsindiverseregions, offeringdistinctinsights.IntheChikkodiregionofBelagaviDistrict,AnushaHonnannanavar,NagrajPatil,andVivetPatilutilized MODFLOWforgroundwateranalysis,prioritizingparameterslikeevapotranspiration,temperature,andhydraulicconductivity. Theirstudy,inclusiveoflithologyconsiderationsusingSURFERsoftware,aimstoelucidatetheintricateinterplayofthesefactors withintheChikkodiregion'sgroundwatersystem.
ResearcherslikeSouvikChakrabortyhaveutilizedtoolslikeVisualMODFLOW.Thistoolsimplifiescomplexaquiferbehaviours andwasusedinChakraborty’sstudyofEastMidnapur,India.Usingdatafrom2002and2012,thetoolpredictedgroundwater levelsfor2017.Thepredictionswerevalidatedagainstobserved2012data.Thestudyalsoconsideredpotentialseawater ingressionfromtheBayofBengal.Thisresearchhighlightstheimportanceofsuchtoolsinunderstandinghydrogeologyacross diverseregions.
InIran'saridandsemi-aridlandscapes,FarzanehSoltani,SamanJavadi,AbbasRoozbahani,andAlirezaMassahinvestigated escalatingwaterdependencyduetopopulationgrowth.Theirscrutinyofriver-groundwaterrechargeinteractionsconcluded thatriversmaynotbesubstantialcontributorstogroundwaterrecharge,emphasizingtheneedforalternativewaterresource managementstrategies.
DrSajeenaShaharudeenandothershaveusedVisualMODFLOW,integratedwithMT3Dsoftware,tosimulatethisphenomenon intheKadalundiriverbasin.Theirstudyutilizedwaterlevelandqualitydata,alongwithsecondaryhydrogeologicalparameters andaquiferproperties.Thefindingssuggestpotentialsalinewaterintrusionextending0.5kmto1.9kmfromthecoast.Activities likecoconutretting,limeshelling,andsandmining,alongwithincreasedgroundwaterpumpingduetodevelopment,contribute to this issue. The study emphasizes the importance of groundwater replenishment and sustainable development as countermeasures.
Dr. Chaitanya Pande and Sudhir Kumar Singh developed a groundwater flow model for the Akola and Buldhana regions, incorporatingdatafrom9testwells.UtilizingMODFLOW,theirmodelprovidesacomprehensiveunderstandingofgroundwater
International Research Journal of Engineering and Technology (IRJET) e-ISSN: 2395-0056
Volume: 11 Issue: 05 | May 2024 www.irjet.net p-ISSN: 2395-0072
flowdynamicsinthespecifiedarea.Collectively,thesestudiespaintanuancedpictureofgroundwatersystemsacrossdiverse geographies,underscoringthepivotalroleofMODFLOWinadvancinghydrogeologicalunderstanding.[6-15]
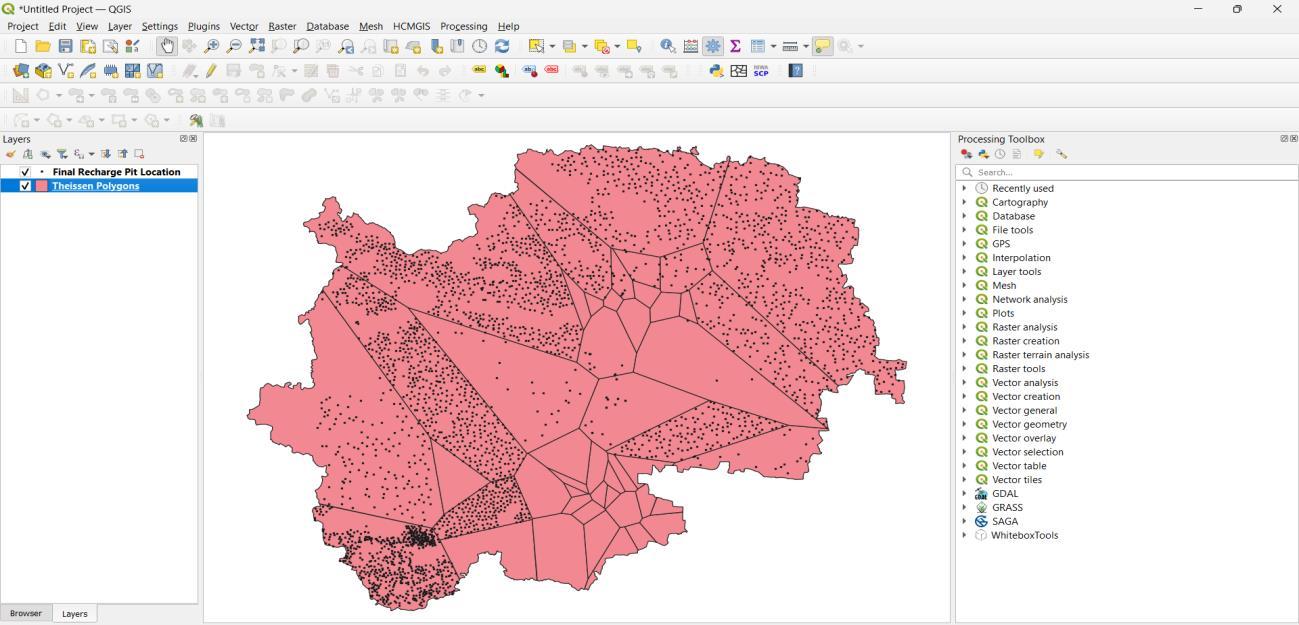
This study employed an exhaustive and intricate approach to investigate groundwater levels using the Geographic InformationSystem(GIS)andMODFLOW.Thefocuswasontheareasinfluencedby18observationwellslocatedinvarious villages within the Nashik district. These observation wells include Belgaon Dhaga, Devlane, Dongargoan, Matane, Nandgaon(MCL),Nimbole,PhuleNagar,Pimpalgaon,Satvaichiwadi,Sawatamalinagar(Nv),Varhale,Vighanwadi(Bharatpur), Warshi,Kanchangaon,Kapashi,Khuntewadi,Kumbharde,andMalegaon_3stations.Theresearchcommencedwiththecareful acquisitionofessentialdata.TheAdministrativeBoundaryShapefile,whichdelineatesthegeographicalboundariesofallthe TalukasinIndia,wassourcedfromtheSurveyofIndiaWebsite.
Digital Elevation Models (DEM), crucial for providing topographical details, were obtained from the Open Topography Website.Thesemodelspresenta3Ddepictionofaterrain’ssurface,whichiscriticalforcomprehendingthephysicalattributes ofthestudyarea.GroundwaterLevelDataforthedates21stand22ndNovember2023wasgatheredfromtheIndiaWRIS website.Thisdata,whichincludesthenamesofthestations(i.e.,villagenames)andthegroundwaterlevelsintermsofmbgl, providesabaselineforthestudy.Itisessentialforunderstandingthepresentstateofgroundwaterlevelsandservesasa reference point for future projections. The groundwater level data was extracted from the downloaded excel sheet and preparedforfurtheranalysis.ThisinvolvedisolatingthestationssituatedinNashikDistrictapproximately,bynotingtheir coordinatesfromGoogleMapsandpreparinganotherexcelsheetcontainingtheNameofStation,X-Coordinate,Y-Coordinate, andWaterlevel.Thesheetwasthensavedin“.csv”format.ThisexcelfilewasimportedintoQGISasDelimitedTextLayer.By samplingtheelevationsatthosecoordinatesandsubstractingitfromthegroundwaterreadings,thegroundwaterlevelis convertedfrommbgltometersabovemeansealevel.Thesevaluesweretheninterpolatedusingthe“IDWInterpolation”tool fromthe“ProcessingToolbox”.
Oncethedatawassecured,itwasprocessedusingQGIS,apowerfulopen-sourceGISsoftware.Theboundaryshapefilewas preparedbyselectingtherequiredtalukasofNashikDistrictandmergingthemintoasingleshapefile.basedonthelocationsof observationwells,thepolygonofNashikdistrictwassegregatedintoanumberofinfluenceareasfortheobservationwells.
TheDEMwasthenclippedandconvertedtotheappropriateformat,whichwasASCIIrasterformatwiththe.ascextension foreachpolygon.Thisprocessensuredthatthetopographicaldatamatchedthegeographicalboundariesofthestudyarea.
The next phase of the research involved creating a model in MODFLOW, a popular software used for simulating and predictinggroundwaterlevelsandflow.Themodelgridwassetup,andtheaquiferlayersweredefinedbasedonthereport titled“AQUIFERMAPPINGANDMANAGEMENTOFGROUNDWATERRESOURCESBAGLAN,CHANDWAD,DEOLA,MALEGAON, NIPHAD,SINNARBLOCKS,NASHIKDISTRICT,MAHARASHTRA”bytheCentralGroundWaterBoard(CGWB).Thelayerswere providedasfollows:
Description Model_Top
Aquifer-I(Hardrock)
Range - 8to32
ModelFormula Model_Top=DEM
Model_Top-20
Aquifer-I(Alluvium)
Aquifer-II(HardRock)
10to40 30to200
Model_Top-25
Model_Top-200
ThedatafortheEvapotranspirationrateanddepthon21stNovember2023wassourcedfromtheIndiaWRISwebsite.The dimensionsoftherechargepitswerepresumedtobe1.5mx1.5mx3m.Therechargerateofthesepitswasdeterminedusing theequation(1)[4]:
Q=AxRxC…..(1)
Here,
QrepresentstheRechargerate,
AsignifiestheArea=4.5x10⁻⁶mm²,
RisthemeanQuantumofRainfall,calculatedasthetotalactualrainfalldividedbythenumberofyears=1010.697mm/year asperdatafromIWRIS(India–WaterResourcesInformationSystem),
International Research Journal of Engineering and Technology (IRJET) e-ISSN: 2395-0056
CistheRunoffCoefficient,C=0.479….. [3].
Thequantumofrainfallwascalculatedbyusingtherainfalldatafrom1993to2023.Thevalueofrechargerateofone rechargepitisworkedouttobe0.96798m/year.Thenaturalrechargerateswereselectedfromtherange specifiedinthe “Annex2Infiltrationrateandinfiltrationtest”bytheFoodandAgricultureOrganization.Thehydraulicconductivity,asfound inliterature,wasusedtocomputethedrainconductanceusingtheformulagivenontheMODFLOWGuidewebsite,asshownin equations(2)[7]and(3)[7].
DrainConductance=Kz/(DrainSedimentThickness) …..(2)
WhereKz=(HydraulicConductivity)/10…..(3)
ThisdrainconductancewasappliedtotheimporteddrainshapefileinMODFLOW-6.Thesedrainshapefileswerecreatedby processingtheDEMsinQGISforall18influenceareas.Theevaporationratewascalculatedbasedonthegeneralweatherdata availablefromonlineresourcesfor21stNovember2023.Thefollowingformulaisasshowninequation(4)[6]:
EvaporationRate(gh)=(25+19v)xAx(Xs−X)…..(4)
Wherev=VelocityofAir=1.625mph
A=WaterSurfaceArea=954933191.283m²
Xs=MaximumHumidityratioofsaturatedair=0.72
X=CurrentHumidityRatioofAir=0.5625
TheEvaporationRatefor21stNovember2023wasfoundtobe53.655m/year.arectangularobjectwasconstructedover the entire area of interest to incorporate the evaporation, evapotranspiration, and recharge rate. Both evaporation and evapotranspirationwereaccountedforwithintheEvapotranspirationpackage.Inadditiontotheinfiltrationrates,halfofthe simulationsalsoincludedthecumulativerechargerate,whichistheproductoftherechargerateperpitandthetotalnumber of pits, within the Recharge Package. This approach assumes a uniform distribution of recharge from the pits across the entiretyoftheTheissenpolygon.
The research involved creating 36 simulations using MODFLOW, each representing the 18 Theissen polygons. These simulationsweredesignedtoreflectthecurrentsituationandaproposedsituationwiththeimplementationofrechargepits. EachThiessenpolygonwassimulatedtwotimesoncewithrechargepitsandoncewithoutrechargepits.The36simulations providedresultsintheformofWaterBudgetsasshowninfigure.FollowingTableshowsthedatausedforthesimulations:
Table -2: ParametersandtheirvaluesforMODFLOWsimulations
Parameter
EvapotranspirationRate
InfiltrationRate
Volume: 11 Issue: 05 | May 2024 www.irjet.net p-ISSN: 2395-0072 © 2024, IRJET | Impact Factor value: 8.226 | ISO
0.32mm/day IWRIS(India–WaterResourcesInformationSystem)
7.5mm/hr
FAO(FoodandAgricultureOrganizationoftheUnited Nations)
International Research Journal of Engineering and Technology (IRJET) e-ISSN: 2395-0056
Volume: 11 Issue: 05 | May 2024 www.irjet.net p-ISSN: 2395-0072
Hydraulic Condictivity for Aquifer-I (Hard Rock) and Aquifer-II(HardRock)
×10 7 m/s
HydraulicConductivityforAquifer-I(Alluvium) 0.0023m/s
DrainSedimentThickness 2.32km
DrainConductance 0.00215perday
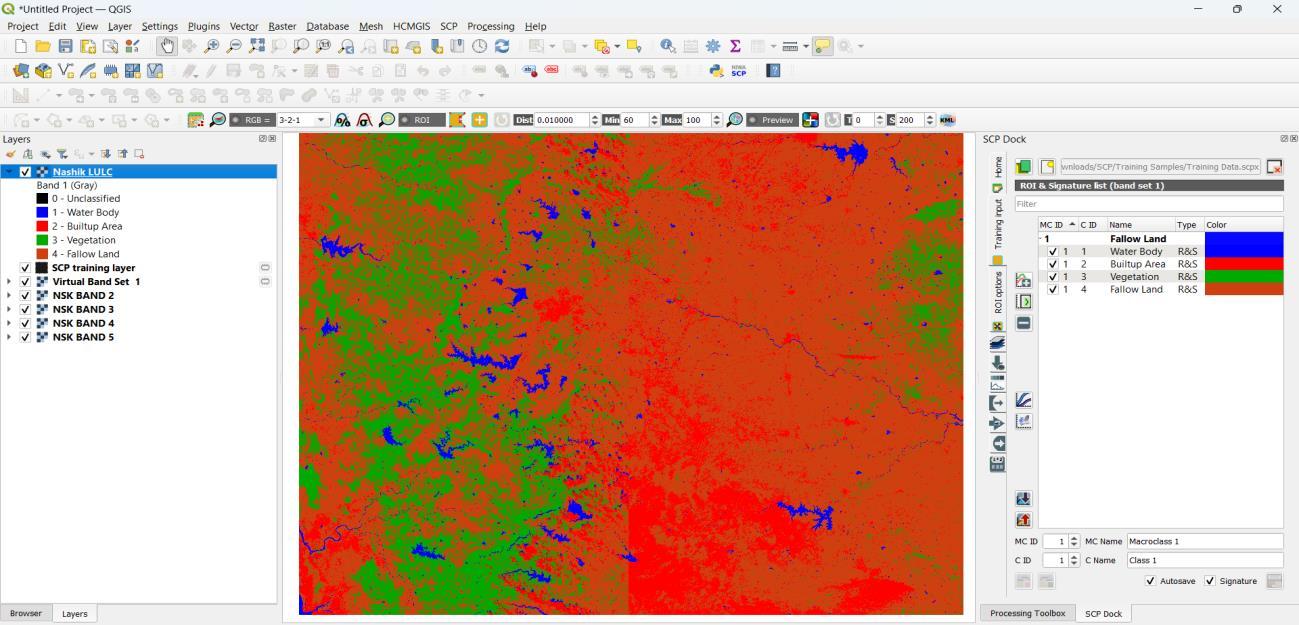
ThisstudyincorporatedtheuseofsatelliteimageryobtainedfromtheBhuvanLandsatDataportal.Theseimagesunderwent processinginQGIStoproduceaLandcovermap.Thelandcovermapwasthenusedtodeterminetheareaofthewatersurface, whichwasessentialforcalculatingthemodel’sevaporationrate.Therechargepitswerestrategicallyplacedonbarrenland withinthepriorityzoneandatlowerelevations,guidedbythegeoreferencedMaharashtraGroundwaterRechargePriority Map.Intotal,3248rechargepitswereidentifiedandtheirlocationswerepreservedinashapefile.
International Research Journal of Engineering and Technology (IRJET) e-ISSN: 2395-0056
Volume: 11 Issue: 05 | May 2024 www.irjet.net
Table -3: VolumeBudgetobtainedfromMODFLOW-6for18villagesanditsanalysis
International Research Journal of Engineering and Technology (IRJET) e-ISSN: 2395-0056
Volume: 11 Issue: 05 | May 2024 www.irjet.net p-ISSN: 2395-0072
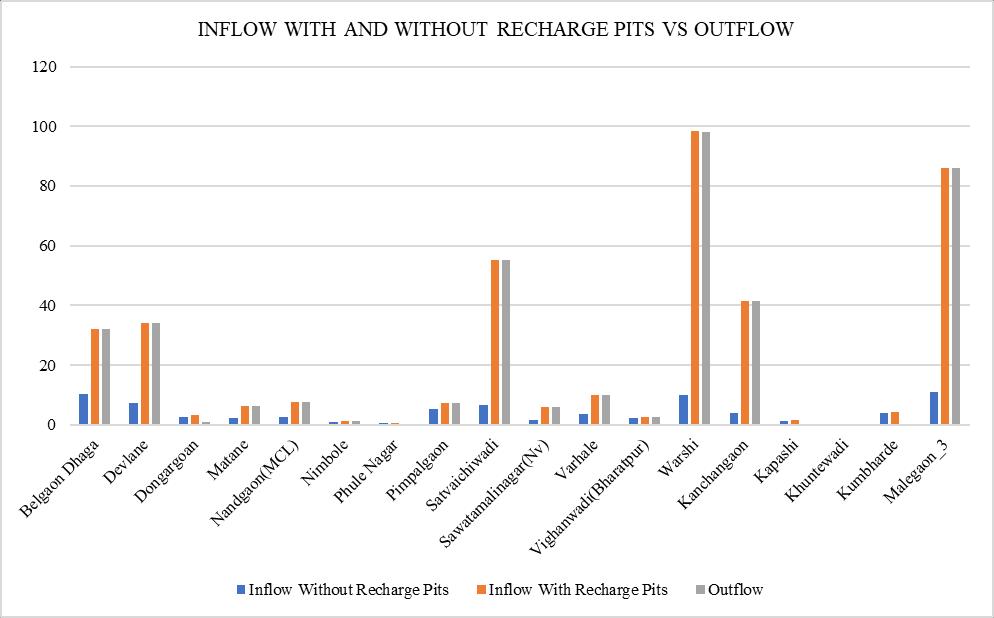
Chart -2:ChartofInflowwithandwithoutrechargepitsvsOutflowvaluesfor1yearsimulation
3. CONCLUSIONS
The Nashik District’s abundant unused land offers an opportunity for installing groundwater recharge systems. Drain conductance,amajorfactoringroundwaterloss,isinverselyrelatedtodrainsedimentthickness.Thislosscanbereducedby encouraging natural sediment formation in rivers with minimal human interference or by constructing structures like percolationtanksandcheckdams.Evaporationandevapotranspiration,whilecontributingtogroundwaterloss,arerelatively minorcomparedtootherfactors.Giventhedisparitybetweennaturalgroundwaterrechargeanddepletion,artificialrecharge structuresare crucial for preventinggroundwaterscarcity.Rechargepits,small but effective,can beconstructedinlarge numberstoimprovegroundwaterconditions.Thesepitssignificantlyincreasegroundwaterinflow,withvaluesincreasingfrom 0.3252-10.939m³withoutpitsto0.4019-86.0437m³withrechargepits.Thisincrease,coupledwitharelativeheadincreaseof theorderof10−2 inone-yearsimulations,highlightstheroleofrechargepitsinpromotinggroundwaterconservationand sustainability.
TheauthorsarethankfultoDr.K.N.Nandurkar,Principal,KKWIEER,Dr.S.Y.Kute,Dean,KKWIEER,andDr.P.D.Jadhao,HOD, DepartmentofCivilEngineering,KKWIEER.Theauthorsarealsothankfultothepeoplewhoknowinglyandunknowingly helpedthemwiththispaper.
[1] El-Rayes,A.,Omran,A.,Geriesh,M.etal.Estimationofhydraulicconductivityinfracturedcrystallineaquifersusingremote sensingandfielddataanalyses:AnexamplefromWadiNasabarea,SouthSinai,Egypt.JEarthSystSci129,203(2020). https://doi.org/10.1007/s12040-020-01470-5
[2] Raazia,S.,Dar,A.Q.AnumericalmodelofgroundwaterflowinKarewa-AlluviumaquifersofNWIndianHimalayanRegion. Model.EarthSyst.Environ.8,871–882(2022).https://doi.org/10.1007/s40808-021-01126-3
2024, IRJET | Impact Factor value: 8.226 | ISO 9001:2008
International Research Journal of Engineering and Technology (IRJET) e-ISSN: 2395-0056
Volume: 11 Issue: 05 | May 2024 www.irjet.net p-ISSN: 2395-0072
[3] Khadka,D.B.(2019)ExperimentalStudyofRunoffCoefficientsforDifferentHillSlopeSoilProfiles.OpenJournalofCivil Engineering,9,157-171.https://doi.org/10.4236/ojce.2019.92011
[4] General Guidelines on Rainwater Harvesting & Artificial Recharge to Ground Water, National Water Mission, India. https://nwm.gov.in/sites/default/files/RWH_Structures_final.pdf
[5] Sushini,K.,Srijayanthi,G.,SolomonRaju,P.etal.EstimationofsedimentarythicknessintheGodavaribasin.NatHazards 71,1847–1860(2014).https://doi.org/10.1007/s11069-013-0977-3
[6] Seputra, J. (2018). Thermal Effectiveness of Wall Indoor Fountain in Warm Humid Climate. IOP Conference Series: MaterialsScienceandEngineering.316.012005..10.1088/1757-899X/316/1/012005.
[7] DRN:DrainPackagePane.(n.d.).https://water.usgs.gov/nrp/gwsoftware/ModelMuse/Help/drn_object_pane.htm.
[8] Bagemghaleh,Simin&Babazadeh,Hossein&Rezaie,Hossein&SaraiTabrizi,Mahdi.(2023).NumericalModelingand TrendAnalysisofMahabadAquiferQuantitativeStatus.3.10.22098/MMWS.2022.11275.1113.
[9] Chakraborty,Souvik.(2017).StudyandVerificationofGroundwaterLevelatCoastalAreasofPurbaMidnapurDistrictin WestBengalbyVisualMODFLOWSoftware.10.13140/RG.2.2.16163.45604.
[10] Dr.SajeenaS,SwathyPSandAbdulHakkimVM.Predictionoftheextentofsalinewateradvancementinthecoastalstretch ofKadalundiriverbasin,Malappuramdistrict,KeralausingvisualModflow:Acasestudy.ThePharmaInnovationJournal. 2022;11(3S):365-372.
[11] Pande,C.B.,Moharir,K.N.,Singh,S.K.etal.GroundwaterflowmodelinginthebasaltichardrockareaofMaharashtra,India. ApplWaterSci12,12(2022).https://doi.org/10.1007/s13201-021-01525-y.
[12] Soltani,Farzaneh&Javadi,Saman&Roozbahani,Abbas&Massah,Alireza.(2022).ModelingGroundwaterandRiverAquiferInteractions(CaseStudy:ShazandPlain).
[13] Kumar,GNPradeep&Kumar,P..(2014).DevelopmentofGroundwaterFlowModelUsingVisualMODFLOW.
[14] Behera,Ajit&Pradhan,RudraMohan&Kumar,Sudhir&Chakrapani,Govind&Kumar,Pankaj. (2022).Assessmentof GroundwaterFlowDynamicsUsingMODFLOWinShallowAquiferSystemofMahanadiDelta(EastCoast),India.Water.14. https://doi.org/10.3390/w14040611.
[15] Soltani,Farzaneh&Javadi,Saman&Roozbahani,Abbas&Massah,Alireza.(2022).ModelingGroundwaterandRiverAquiferInteractions(CaseStudy:ShazandPlain).
[16] Honnannanavar,Anusha&Patil,Nagraj&Patil,Vivek.(2023).GroundwaterFlowModelingofAMicrowatershedusing VisualModflowFlex.CurrentWorldEnvironment.18.740-751.http://dx.doi.org/10.12944/CWE.18.2.24
[17] Sourabh Gupta & J. R. Verma. CGWB. (2016). AQUIFER MAPS AND GROUND WATER MANAGEMENT PLANS, OF CHANDVAD, DEOLA, NIPHAD AND SINNAR TALUKAS, NASHIK DISTRICT, MAHARASHTRA PART-I. chandvad_deola_niphad_and_sinnar_talukas_nashik_district_part-i_1_compressed.pdf(cgwb.gov.in).
[18] DineshKumar,M.,Bassi,N.,Kumar,S.(2022).FactorsInfluencingGroundwaterBehaviourDuringMonsoon:Analysisfrom Maharashtra. In: Drinking Water Security in Rural India. Water Resources Development and Management. Springer, Singapore.https://doi.org/10.1007/978-981-16-9198-0_2
International Research Journal of Engineering and Technology (IRJET) e-ISSN: 2395-0056
Volume: 11 Issue: 05 | May 2024 www.irjet.net p-ISSN: 2395-0072