
International Research Journal of Engineering and Technology (IRJET) e-ISSN: 2395-0056
Volume: 11 Issue: 05 | May 2024 www.irjet.net p-ISSN: 2395-0072
International Research Journal of Engineering and Technology (IRJET) e-ISSN: 2395-0056
Volume: 11 Issue: 05 | May 2024 www.irjet.net p-ISSN: 2395-0072
Anantbhat Sachin Narayan1, Akilesh Revankar2, Enriq Dsouza3 Gourish Katti4
Mahesh Sattigeri5 N.B. Rajeev Rao6
1234Undergraduate Students B.E(Mechanical Engineering) K.L.S Gogte Institute of Technology, Belagavi, Karnataka 5Assistant Professor Dept of Mechanical Engineering K.L.S Gogte Institute of Technology, Belagavi, Karnataka 6Technical Director, Kaavata Valves (India) Pvt Ltd, Belagavi Karnataka
Abstract - This research paper will cover the monitoring of data through use of advanced technology and also the predictive maintenance ofamechanicalequipmentalongwith prediction model using data analytics with which the mechanical equipment can be continuously monitored and also predictions can be made based on the data available thus enabling us to predict the failures and thus avoid any breakdown. This research paper is mainly divided into parts which are IOT and Data Analytics. Efforts have been to put forth the entire work in terms of literature and thus will help the reader to have a clear and effective understanding of the concept and thus contribute to the knowledge of the reader.
Key Words: IOT, Valves, Fluid Machinery, Predictive Maintenance, Data Analytics, Mechatronics, Mechanical Device, Control Engineering, Instrumentation Engineering, Electronics Engineering.
1.INTRODUCTION
In this research paper exhibits the application of IOT and Data Analytics onto a mechanical device which helps to control,monitorthebehaviorandtheworkingconditionsof amechanicalcontroldeviceandalsowithdataavailablea predictionmodelisbeensetupinordertopredictthefailure andthusavoidanybreakdownsoraccidents.Thisresearch paper will give an idea on use of these technologies on conventional mechanical control equipment with help of electronicsensors,programmingofvariouspartshasbeen done in order to facilitate wireless technology and thus achievinganinterfacewhichmonitors,controls,predictsthe actualworkingofthecontrolequipment.Inconclusionthis research paper will showcase the application of wireless technologythatcanbeimplementedonmechanicaldevice and also data analysis of the data that can be extracted throughIOT.
What is data analytics? Data analytics is process of analyzing the available dataset to find the insights of data and historical trends for solving problem and data driven decision making. It involves use of math, statistic, and computertechniquesforconvertingrawdataintoactionable
insights Ithelpsingettingtherelationshipbetweenthe independentanddependentvariableswhichgivesaclear linearrepresentationaboutthedataset
How data analytics can be implemented on control equipment: Implementing data analytics on any control devicehelpsincontinuouslymonitoringandevaluatingthe data which helps to analyze the current condition and predict the future scenario of device. It helps in remotely monitorthedataallowingtogettheperformanceofdevice and take the preventive action on it Data analytics has helpedforanalyzingthedataandconvertingtherawdataset inmultipleways.
Manipulatingdata:
Data analytics helped selecting the true row and column removing the duplicate data reordering the data and also addingnewdatastatisticalsummeringthedata
Regressionanalysis:
Findingtheresidualsinthedatawhichallowsusknowing errorsintherawdatasetandalsofittingthelinearequation toobserveddataevaluatingthemodel
Failureprediction:
With the use of linear regression and applying algorithms suchasrandomforestonthedatasets.Dataanalyticshelped usinthepredictingthefurtherscenarioofvalveonwhich correctiveactionwouldbeimplemented.
Theequationusedforlinearregressionmodel
Y=A+BX+E
Where,
Y-Dependentvariable
A-Intercept
B - Slope that change in dependent variable for unit changeinindependentvariable
X-Independentvariable
E-Error.
International Research Journal of Engineering and Technology (IRJET) e-ISSN: 2395-0056
Volume: 11 Issue: 05 | May 2024 www.irjet.net p-ISSN: 2395-0072
1. Data collection:
Thedatacollectedwasof3-wayballwhichinvolvedtwokey variables the valve opening (Percentage) and the correspondingflowrate(literspersecond)
2. Manipulating and Filtration of data:
Thedatacollectedwasfilteredbyremovingtheunwanted and Garbage data and relevant data which would make a impactontheresultwastakenintoconsideration
3. Model building by the actionable data:
Basedonthedataavailableamodelwasbuilt.
4. Splitting the data:
Thedatawassplitintotwothingsthatistestandtraindata where 80 percent of the data was allocated to train the modeland20percenttotestthemodel.
5. Fitting the model:
Alinearregressionlinewasgeneratedbythemodelbased onwhichtheerrorinthemodelanddatawasAnomaly.
6. Model prediction:
The buildmodel will predictthe Subsequentvaluesofthe flowratecorrespondingtotheopening.
7. Model evaluation:
Evaluating the model involve checking the residual the mean, median standard error and r(square and finally plotting the results comparing it with observed and predictedvalue.
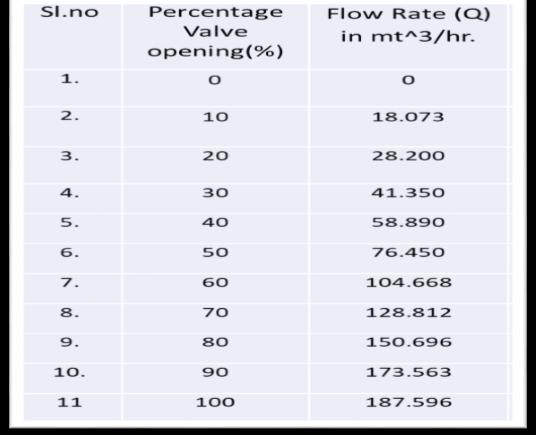
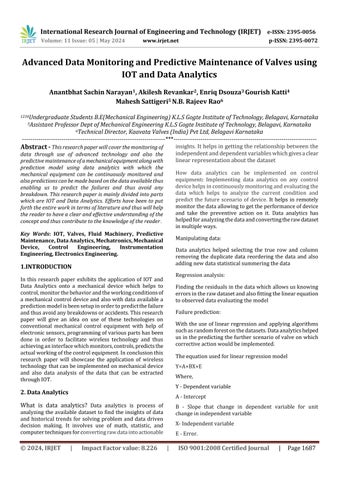
Fig-2.2: Datasetusedforanalyzing
Theabouttablerepresentsthedatasetsof3-wayballvalve on whichtheanalyses were being done.It consists oftwo
variables (percentage opening and flow rate) here the percentage is independent variable and flow rate is dependentvariable.
The opening is incremented by 10 unit each and correspondingflowrateismeasured
Initiallyapackagecalled"Tidyverse"wasinstalledinwhich subpackageareDesigned
Asthedatasetwasobtainedfromthesensorwascovered into Excel file this file was attached and was assigned to variablecalled"data"
For data visualization plots were created qplot which is from ggplot2 packages and this package is sub package designedinsidethe Tidyverse package
A linear regression was built by using lm() function with flowrateasdependentandopeningasindependentvariable
Using the function predict () the model predicted certain valuesofflowrateforgivenvaluesofopening
Finally, a tabular column was created in which the comparison was shown between actual flow rate and predictedflowrate.
Presenting of raw data in graphical form is called as data visualizationvarioustoolsindataanalyticsareusedsuchas scatterplot,boxplothistogram,togetagraphicalviewofthe datasetstounderstandandfiltrationofdataintoactionable data.
Usingthevariousplotstovisualizedatasetsmadeeasierto understandandanalysesthedataquicklytoknownflowrate correspondingtoopeningistakingplaceandalsolookingat the trends rather than the numerical values facilitated to takethedecisionandexplainthedatamoreclearly.
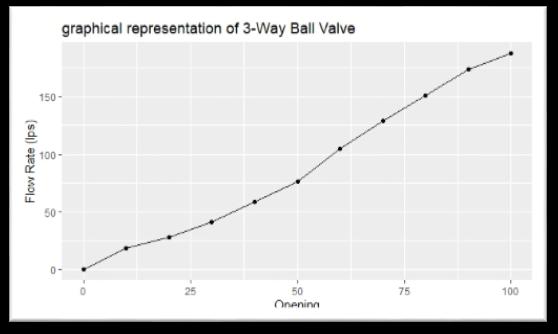
Fig-2.3.1: LineGraphForDataVisualization.
International Research Journal of Engineering and Technology (IRJET) e-ISSN: 2395-0056
Volume: 11 Issue: 05 | May 2024 www.irjet.net p-ISSN: 2395-0072
The figure 2.3.1 is depicting the line graph for 3-way ball valvehavingvariables(flowrateandopening)thedatapoint at bottom left corner indicates lowest flow rate corresponding to opening and the data point at top right indicatesthehighestflowratecorrespondingtoopening
Aswecanexaminefromthegraphinitiallythereisagradual surge in the flow rate for certain range of opening yet openingrangeat85to100percentthechangeinflowrateis gradually reduced reason for this likely would be the turbulence which is resisting the flow rate of valve or another reason would be design constraint while manufacturingoftheballvalve.
Indataanalyticsregressionisatechniqueofpredictingthe dependedvariablebasedontheknowortherelateddata.
It consists analyzing a linear equation the equation is combinationofvariousindependentvariableswhichhelpto predictthedependentvariable.
Linearregressionhelpedmetounderstandandpredictthe datamoreaccuratelyanditgavemeanindicationofwhat willbetheflowrateforvaluesofopeningorviceversaalso itisasuperpowerindataanalyticstoreducetheerrorsin thedatasetsbyplottingastraightlinealsocalledasbestfit line.[1]
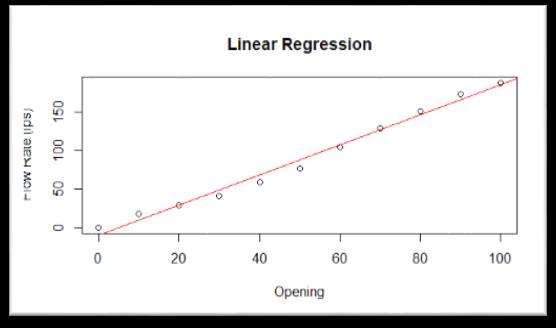
Fig-2.4.1: GraphusingLinearRegression.
The figure 2.4.1 depicts linear regression applied on the dataset of 3-way ball valve where the x axis is displaying percentageopeningandyaxisisdisplayingflowrateatliters persec
Herethelinearmodelistryingtoplotabestfitlineforthe dataset of 3-way ball valve that is it trying to predict the dependentvariablewhichinourcaseisFlowratebyusing thedatapointsofindependentvariablewhichinourcaseis percentageopening.
Foreachunitchange in percentageopening thechange in flowratein3wayballvalvetakingplace.
A Prediction model is used to predict or determine the valueswhichmayberequiredbytheuser.Herethemodel analysesthedataavailablealreadyandthenpredictsavalue thatisbasedonthedatasetthatwasfedtothemodel.
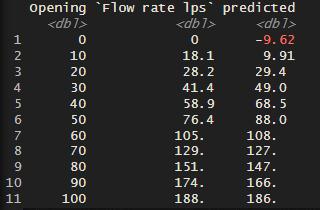
Fig-2.5.1: TabularcolumnofPercentageOpening,actual flowrateandpredictedvaluesforflowrate.
Theabovetabledepictsthecomparisonbetweentheactual flowrateandthepredictedflowratemadebythemodel The modelpredictedtheflowratecorrespondingtotheopening.
From the table we can observe that at certain range of openingthemodelhaspredictedtheapproximatevaluefor flowrateandthiswecanrelatefromthelinearregressionas the data points are close to the linear line the model has predicted the approximate values for the flow rate.
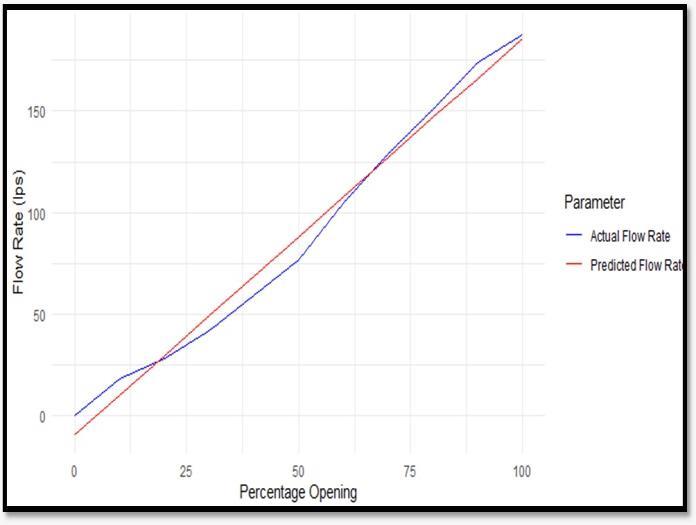
Fig-2.5.2: GraphrepresentingComparisonbetweenactual flowrateandpredictedflowrate.
Volume: 11 Issue: 05 | May 2024 www.irjet.net p-ISSN: 2395-0072
Fig-2.5.3: Inputprovidedformodel
Fig-2.5.4: Outputbasedoninputprovided
IOT stands for Internet of things it is an approach of achievingwirelessconnectionthroughtheuseofsoftware andelectronicsIthelpsinachievingaoveralloptimizationof thesystems,InthecaseofmechanicaldevicesIOThelpsin wirelessmonitoringthroughmultipledevicesbyusingWIFI andBluetooth.Itenablesusinimprovingthesystemswhich requirecontinuousmonitoringanddeviceswhichneedtobe controlledremotely.WiththeuseofIOTsuchmodifications andoptimizationofthesystemsispossible.[2][3][4]
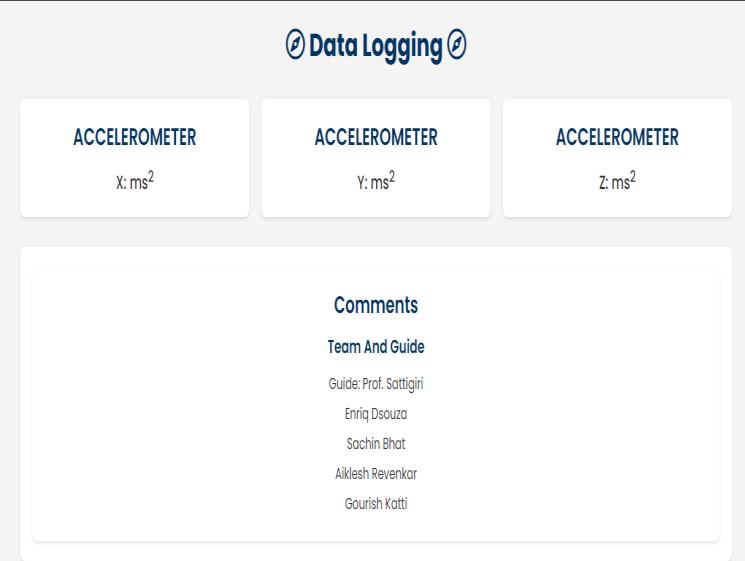
In the following we use an ESP 32 with a sensor for vibration i.e. MPU6050,usingthefollowValuesusing the following Sensor for the following values are then send through the web server for Live Monitoring and data Collection.
3.2
MPU6050wasselectedforits 3-axisgyroscopeanda3-axis accelerometer on the same silicon die, together with an onboard Digital Motion Processor™ (DMP™)
ESP32isagreatDevelopment BoardforIOTandBluetooth based application, Being Open Source and having many connection for GPIO pins we have selected the following Pins.
Arduino IDE was used for its simplicity with its default modules and open Source Contribution , the MPU 6050 libraries available directly on the Library Managers are a plus Point for using the following IDE although ESP 32 providesthenativesupportforthefollowingIDE
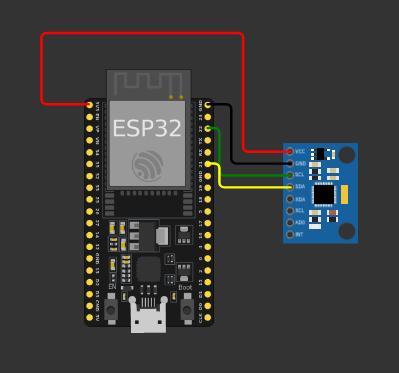
The connection for the following Setup was simulated on wokowiasshowninthegivenfigure3.2.1thiswasdoneto testouttheprimaryCircuitforthefollowingSetupandits Capability.
Forthecodethefollowinglibrarieswereused,
ESPAsync webserver - to create the webserver for the following application, AsyncTCP to handle Tcp communication in a non-blocking manner, Ardunio _JSON libraryforinterchangeandexchangeofthetheJSONformat, adafruitMPU6050.h,AdafruitSensor.hfortheinterfacewith theMPU6050andtheesp32throughttheIDE,Aduino.hfor Arduinofunctionsandwifi.hfortheconnectionthroughthe WIFIsensorforthefollowingsensor.
SPIFFS.h- provides access to the SPIFFS (SPI Flash File System)filesystemontheESP32.
Hence using the following libraries we send the Sensor values for the ESP 32 and file systems associated with it although we get the following systems values TheMPU6050hastheCapability tomeasuretherotation andaccelerationandtheTemperatureinthisweonlyusethe Acceleration values for the Measurement of the following Sensor values because we are focusing on Acceleration Andonvalvesthereisnorotationornotsohaveignoredthe followingsystemforthenorotationofthefollowingsystem.
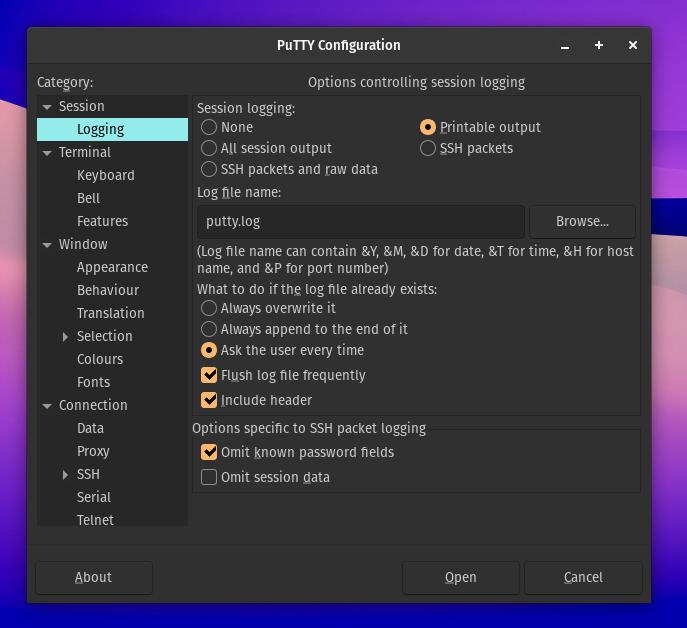
DataiscollectedusingPuTTySSHClientforDataLoggingthe SerialMonitortheDataisStoredinODTformatwhichisthen structuredinCSVorExcelfileforDataAnalysisfollowedby Prepossessing.
International Research Journal of Engineering and Technology (IRJET) e-ISSN: 2395-0056
Volume: 11 Issue: 05 | May 2024 www.irjet.net p-ISSN: 2395-0072
Multi Devices Setup:
The Esp 32 would be used for the following for better communicationsforthefollowingvaluescanbeconnectedto multipleDeviceforbettercommunicationsandmulti-device alongwithsecureProtectionofData
Network Security – The Esp 32 and the Host used the WPA2- PSK security protocol, so it provides the most securityforthefollowingprotocolandWIFIUsegiveninthe following systems.
Alsothefollowingvaluescanbesharedwiththerestofthe networkortheInternetusingsecurenetworkprotocolfor the following.
Thefollowingfront-endwebpagewasBuiltusingHTML,CSS andJavaScripttakingreferencefromRandomNerdTutorial.
3.5 Methodology for IOT
1.PrimaryCircuitDesignandSimulationonWokwi
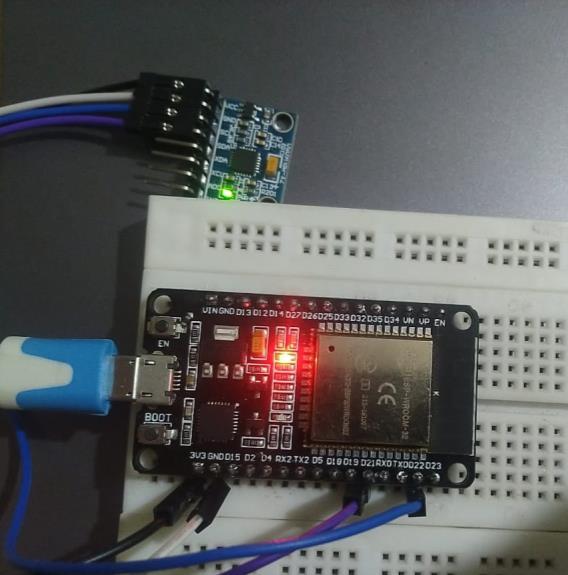
2.PhysicalDesignoftheCircuit
3. Installation of Libraries and Dependencies on the Host FlashingSetup.
4.TestingandqualitycheckingthesensorandCalibration
5.CodetestinganddebuggingontheIDE
6.TestingtheWholeSetup
7. MultiDeviceTestingandDevelopment
International Research Journal of Engineering and Technology (IRJET) e-ISSN: 2395-0056
Volume: 11 Issue: 05 | May 2024 www.irjet.net p-ISSN: 2395-0072
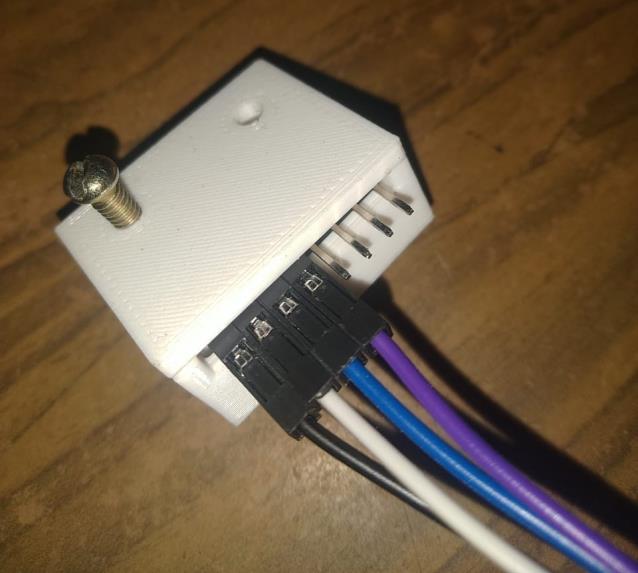
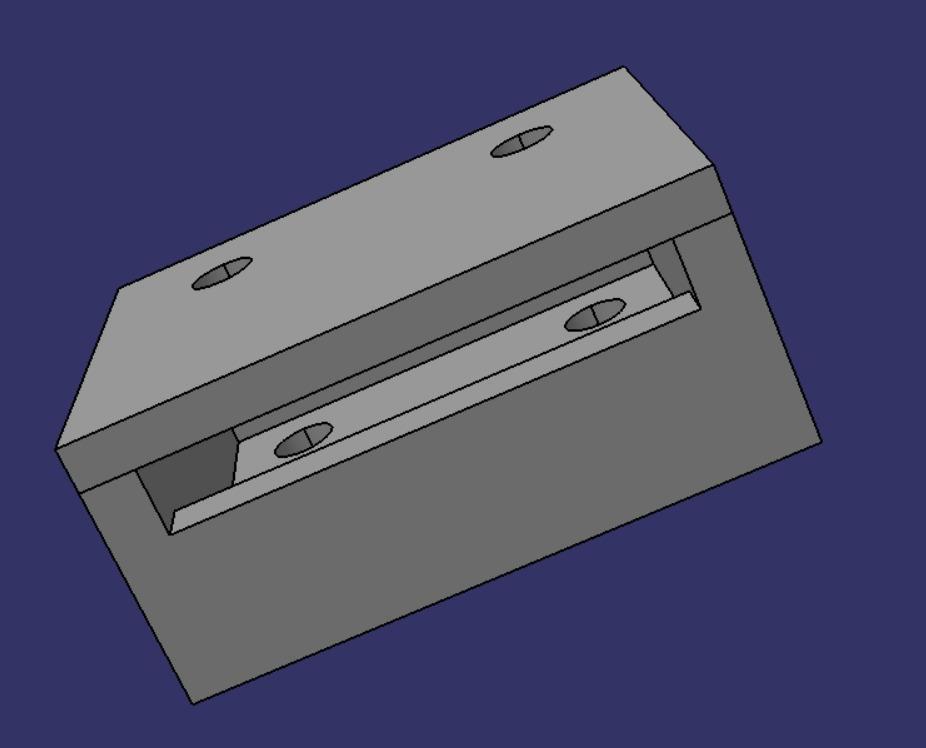
3DPrintedcasewithattachment
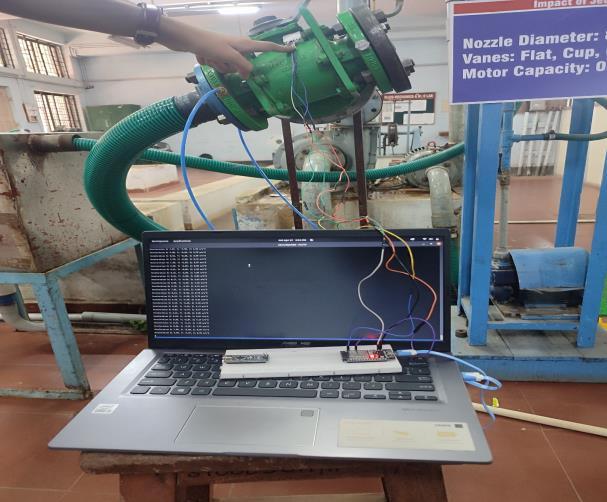
Fig-3.5.5: Testingofthesensor 4. CONCLUSIONS
From the above entire work, we have built an IOT model whichcanbeimplementedontomechanicaldevicesbythe use of which we are enabled to obtain monitoring of the deviceandalsocanbeusedforpredictivemaintenance.Also, with the help of data analytics and the use of linear regression and prediction model we can explore the data interpretthetrendsandanalyzethebehavioroftheflowof fluidthroughthevalvepredictionmodelhelpsustopredict the values for a given value of input. In general, these techniquescanhelpimprovisetheperformanceandoverall userexperienceofmechanicaldevicesandalsoenableusfor bettermonitoringandadvancedcontrolthroughtheuseof wirelesstechnology.
The Authors express their gratitude to the Management, Principal, Head of Department (H.O.D) Mechanical EngineeringofK.L.SGogteInstituteofTechnologyBelagavi, Karnataka and the Kaavata Valves (India) Pvt Ltd Dewarwadi, Kolhapur Maharashtra for their immense support and motivation. Special gratitude to Prof Mahesh Sattigeri and Mr. N.B. Rajeev Rao for their expertise, guidanceandsupervisionthroughouttheentireprocess.We are really thankful to Mr. N.B. Rajeev for his constant motivation and enthusiasm and imparting us knowledge throughpracticalapplication.Wewouldalsoliketothank thestaffofboththeorganizations.
[1] Kavitha, S., S. Varuna, and R. Ramya. "A comparative analysis on linear regression and support vector regression."In2016onlineinternationalconferenceon green engineering and technologies (IC-GET), pp. 1-5. IEEE,2016.
[2] Guo,Jiang,Junfang,Zhang,YixinWang,QijuanChen,and HongyunWang."TheControl-Maintenance-Management SystemBasedontheInternetofThingsforLifeCycleof Valves."2010
[3] Priyanka, E. B., S. Thangavel, P. H. Prasad, and R. Mohanasundaram."IOTfusionbasedmodelpredictive pid control approach for oil pipeline infrastructure." International Journal of Critical Infrastructure Protection35(2021):100485,2021.
[4] Sangolt, John-Kenneth, Marita Bjorøy, and Thomas Erstad. "Application of industry 4.0 concepts for increasing reliability of valves." Bachelor's thesis, HøgskulenpåVestlandet/WesternNorwayUniversityof AppliedSciences,2019.


AnantbhatSachinNarayan
AkileshUmeshRevankar
International Research Journal of Engineering and Technology (IRJET) e-ISSN: 2395-0056
Volume: 11 Issue: 05 | May 2024 www.irjet.net p-ISSN: 2395-0072


EnriqDsouza
GourishKatti
MaheshSattigeri
N.B.RajeevRao