
International Research Journal of Engineering and Technology (IRJET) e-ISSN:2395-0056
Volume: 11 Issue: 05 | May 2024 www.irjet.net p-ISSN:2395-0072
International Research Journal of Engineering and Technology (IRJET) e-ISSN:2395-0056
Volume: 11 Issue: 05 | May 2024 www.irjet.net p-ISSN:2395-0072
Wael Albawwab1, Tauseef Ahmad Ansari2
Assistant Professor1, University of Buraimi, Oman
Assistant Professor2, University of Buraimi, Oman
Abstract:
NormalizedDifferenceVegetationIndex(NDVI)isaparameteroffindingthe vegetationontheearthsurface.Itisusedto monitortheclimatic changes,occurs inthevegetation,foresthealth,indicate water stressinvegetation Inthis research, NDVIfrom2000to2011generatedtoanalyzedthechangesoccurredinvegetationcover ItisfoundthattheoverallNDVI valuewas inthe rangeof -0.20to0.94from year2000 to2011.Itisalsoobserved thattheNDVI value isin therange of 0.75to0.94innorthpartofthedistrict.Whilethecentralandsouthpartshowsrangeof-0.20to0.45andremainingareas intherangeof0.45to0.75.Inthe11years,mostofthegreenspaceshasbeenreducedintheNagpurDistrictfromlast19 years. Hence, there is a need of proper planning and management for maintaining the ecosystem, and there must be the rulesforsustainabledevelopment.
Key Words: NormalizedDifferenceVegetationIndex(NDVI),Landsat,LandUse(LS)/LandCover(LC),Rainfall,ArcGIS etc.
Introduction:
The NDVI is a remotely sensed measure of vegetation greenness and is related to various properties of vegetation including its growth and productivity (Gamon et al. 1995). NDVI has found a wide application in vegetative studies as it has been used to estimate crop yields, pasture performance, and rangeland carrying capacities among others. It is often directlyrelatedtoother groundparameterssuchaspercentofgroundcover,photosyntheticactivityoftheplant,surface water, leaf area index and the amount of biomass. NDVI is reliable indicator of vegetation changes at both global (Kawabata et al., 2001). The possibility of expressing the relationship between precipitation and vegetation has been greatly improved upon by the development of meteorological instruments and the collection of systematic climatic observations.(AreolaM.etal.,2018) InIndia,theclimateisdominatedbythemonsoon,althoughmonsoonalprecipitation is not uniform throughout the country; it varies with place and time (Diwan 2002). NDVI has higher sensitivity corresponding with crown density change than other vegetation index. Therefore, information on degree of forest degradation including forest fragmentation need to be defined to formulate a strategy for habitat and ecosystem management(PriatnaD.etal.2012).BhandariandKumar(2012),usedmulti-spectralremotesensingdatatofindspectral signature of vegetation index, land cover, concrete road structure, urban areas, rocky areas Yang. and Gong (2013), highlighted some important discoveries about the climate system that have not been detected by climate models and conventional observations; Bothale and Katpatal (2014), studied the variability of rainfall with El Niño Southern Oscillation(ENSO)eventsatthewatershedleveltodeterminethepatternofwateravailableforagriculturalplanningand water and soil conservation. study area was analyzed in combination with NDVI data from the Moderate Resolution Imaging Spectro radiometer (MODIS) sensor. They found the correlations between ENSO events, rainfall, and vegetation. RainfallandvegetationshowsapositivevarianceduringLaNiñaeventsandanegativevarianceduringElNiñoevents.The impacts of moderate to severe ENSO events (in 2009 and 2010) can be mainly observed on rainfall and vegetation. The sensitivity of vegetation cover with changes in precipitation patterns and that reduction in rainfall and vegetation greenness across large parts of Amazonia (Hilker and Sellers, 2014; There are various scientists (Kinthada.N.R, and Gurram.M.K,2014;Bothale.R.VandKatpatal.Y.B,2015;Jiao.N.Z,et.al,2015;Gandhi.M.et.al2015;Mazzarino.MandFinn.J.T, 2015; Rishma.C and Katpatal.Y.B, 2016; Kumara.N and Tischbeinb.B, 2017; Zaitunah A., et.al. 2018) evaluated the spatial andtemporalpatterninthesensitivityofvegetationtorainfall
Study Area:
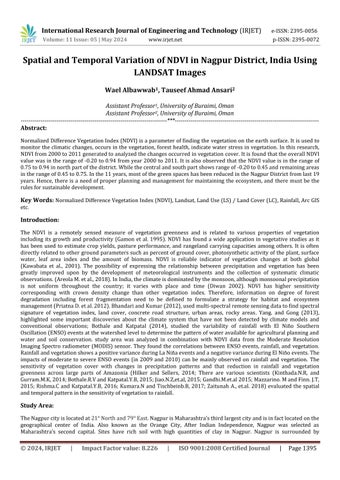
TheNagpurcityislocatedat21°Northand79°East NagpurisMaharashtra’sthirdlargestcityandisinfactlocatedonthe geographical center of India. Also known as the Orange City, After Indian Independence, Nagpur was selected as Maharashtra’s second capital. Sites have rich soil with high quantities of clay in Nagpur. Nagpur is surrounded by
International Research Journal of Engineering and Technology (IRJET) e-ISSN:2395-0056
Volume: 11 Issue: 05 | May 2024 www.irjet.net p-ISSN:2395-0072
Metamorphicrock,Clay,andSandstone.Thecityitselfisrichwithgreenery,containsmultiplenaturalaswellasartificial lakes,andwasevenawardedthetitleofbeingthesecondgreenestcityinIndia. Nagpurhastropicalwetanddryclimate. The city experiences extreme temperatures of 49.7° C in summer season from March to June. While minimum temperaturesrecorded3.9°C.Theaverageannualrainfallis1055mm.Thegeneralsurfaceslopeisfromwesttoeastand thehighestelevationlevelis358.25mwhilelowestelevationis284.79m.(Ansari,etal.2016)
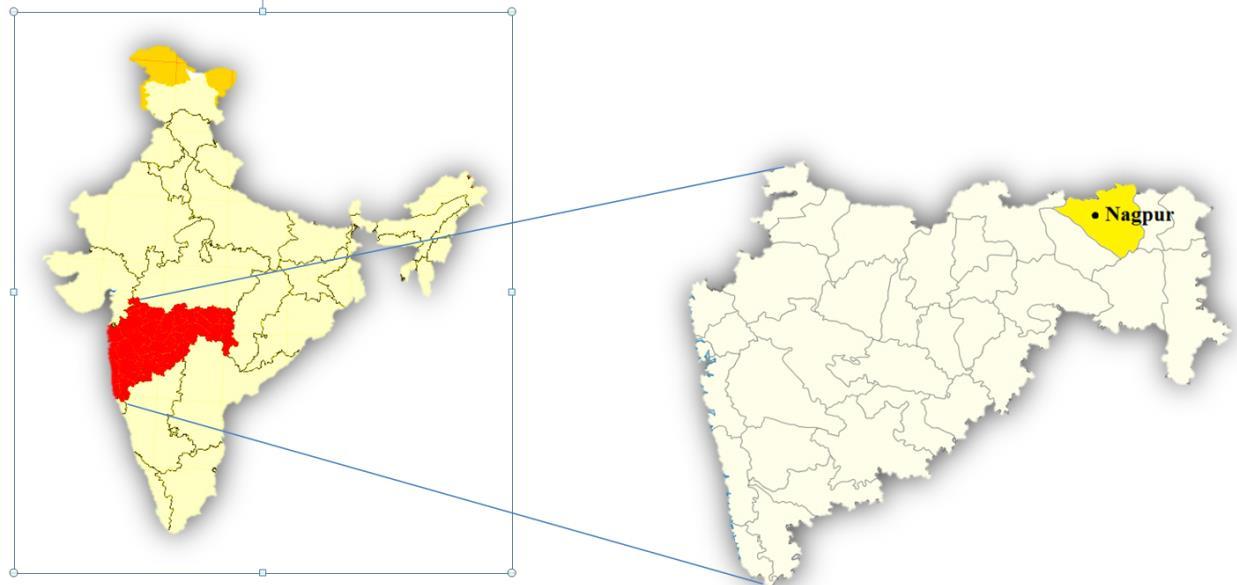
Figure1:NagpurDistrictasareaofresearchsituatedinMaharashtraState
Software Used:
ArcGIS software has been used for the image processing, where the satellite images are opened ArcGIS is a Geographic information system (GIS) for working with maps and Geographic Information. It is used for creating and using maps, compiling geographic data, analysing mapped information, sharing and discovering geographic information, using maps and geographic information in a range of applications, and managing Geographic Information in a database. The system provides an infrastructure for making maps and geographic information available throughout an organization, across a community,andopenlyontheWeb.
Methodology:
Inthefirststep,dataiscollectionfromUSGSEarthExplorerwebsite TheUSGSEarthExplorer(EE)toolprovidesusersthe abilitytoquery,search,andordersatelliteimages,aerialphotographs,andcartographicproductsfromseveralsources.In additiontodata fromtheLandsatmissionsanda varietyofotherdata providers,EEnowprovidesaccesstoMODISland data products from the NASA Terra and Aqua missions, and ASTER level-1 B data products over the U.S. and Territories from the NASA ASTER mission. The MODIS image of code MOD13Q1 V6 is selected from MODIS Vegetation Indices- V6 fromtheyear2000to2018 forthemonthofJulyforeveryyear.Insecondstep,satelliteimagesreprojectedintheWGSUTM1984-44NzoneprojectionsystemintheArcGISsoftwarewhichsuitstoIndia.Third,theimagesclippedforNagpur District using clip command. In fourth step, analyses are performed in Arc Map module from add data option NDVI thematicmapsweregeneratedusingNIRandredbandusingequation1.
NDVI=NIR-Red/NIR+Red (1)
Table1showstherangeofNDVIvaluesforvarioustypesofvegetation.
International Research Journal of Engineering and
Volume:
Table1RangeofNDVIvaluesusedforclassificationofland
S. No. Vegetation Type
1 DenseVegetation
2 MediumVegetation
3 SparseVegetation
4 NoVegetation
5 Waterbodies
Range of NDVI values
>0.45
0.25-0.45
0.15-0.25
0.1-0.15
<0.1
Results:
TheNDVIvalues wereobserved forthemonthofJulyfrom2000to2011. TheNDVIvaluemorethan0.45(greencolour) showsdensevegetationinnortheastpartinNagpurdistrict,whichisverydistinct,whereasintheperipheralareasofcity, values observed between 0.25-0.45 (yellow colour) shows medium vegetation In central part, NDVI value observed between0.1-0.15(redcolour)showsthereisnovegetation.Thereasonis,Nagpurcityissituatedincentralpartbasedon highdenseurbanland.NDVIvaluefrom0.25-0.45(mediumdense)isreducedto0.15-0.25(sparsevegetation) and0.150.25 (sparse vegetation) has been converted into (no vegetation) urban areas (Figure 2) The highest and lowest value fromtheyear2000to2011isgiveninbelowTable2
Table2:ThehighestvaluesofNDVIvaluesfromyear2000to2011.
Discussion:
Based on the analysis of the Normalized Difference Vegetation Index (NDVI) results from 2000 to 2011, it can be concluded that the vegetation cover in Nagpur District has undergone significant changes over this period. The overall NDVIvaluesrangedfrom-0.20to0.94,indicatingvariationsinvegetationdensityandhealthacrossdifferentpartsofthe district. Specifically, the northern part of the district exhibited higher NDVI values (0.75 to 0.94), signifying denser and healthiervegetation.Incontrast,thecentralandsouthernpartsshowedlowerNDVIvalues,rangingfrom -0.20to0.45and 0.45to0.75,respectively,indicatinglessdenseandpotentiallystressedvegetation.UsingRemotesensingandGISalarger area can be cover for the research purpose and number of analyses can be done. The analyses can be used for proper urbanplanningandmanagement.
2024, IRJET | Impact Factor value: 8.226 |
International Research Journal of Engineering and Technology (IRJET) e-ISSN:2395-0056
Volume: 11 Issue: 05 | May 2024 www.irjet.net p-ISSN:2395-0072
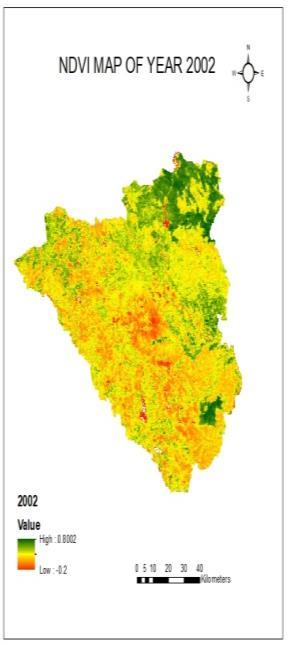

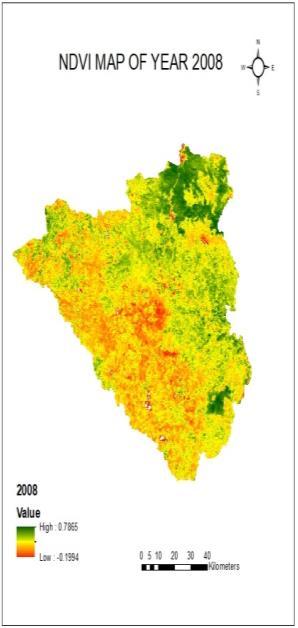
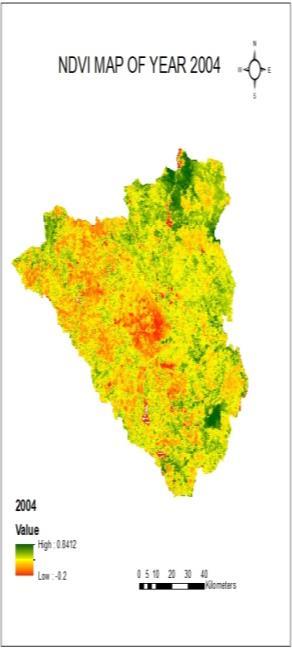
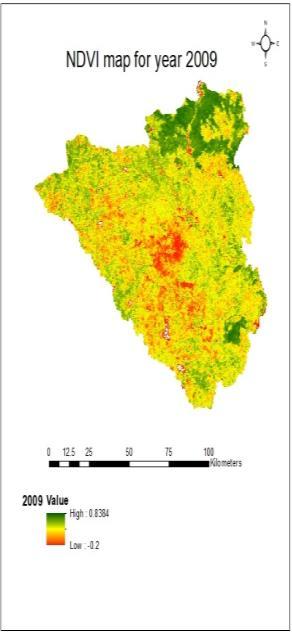
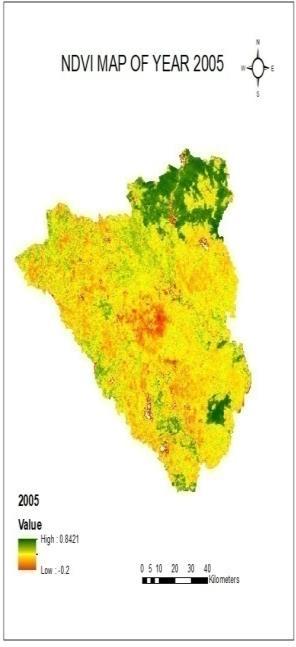
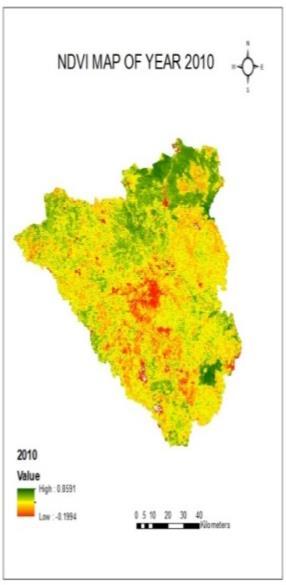
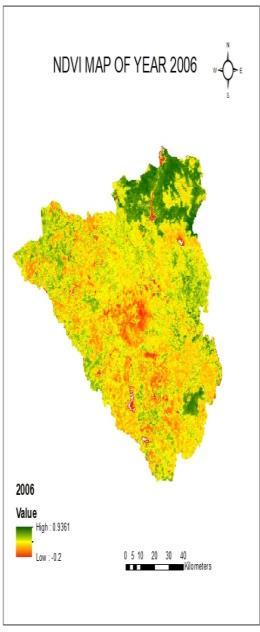
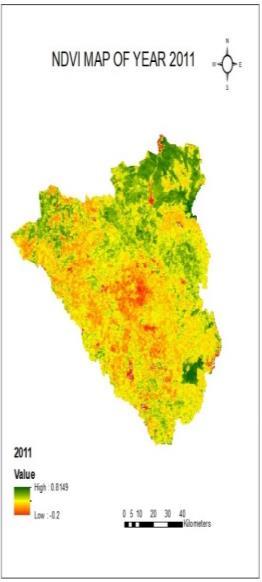
Figure2:ThespatialandtemporalpatternofNDVIvaluesofNagpurDistrictfromtheyear2000to2011
References:
1. AreolaM and Fasona.M, (2018), “Sensitivity of Vegetation to Annual Rainfall Variations over Nigeria.”,Remote SensingApplications:SocietyandEnvironment,S2352-9385,(17),30073-3.
2. Bhandari.A.K and Kumar.A, (2012), “Feature Extraction using Normalized Difference Vegetation Index (NDVI): a CaseStudyofJabalpurCity.”,ProcediaTechnology,6,612–621.
3. Bothale.R.VandKatpatal.Y.B,(2014), “Response ofRainfall andVegetationtoENSOEventsduring2001–2011in UpperWardhaWatershed,Maharashtra,India.”,JournalOfHydrologicEngineering,2014,19(3):583-592.
4. Bothale.R.VandKatpatal.Y.B,(2015),“TrendsandAnomaliesinExtremeClimateIndicesandInfluenceofElNi˜no andLaNi˜naoverPranhitaCatchmentinGodavariBasin,India.”,JournalOfHydrologicEngineering,2016,21(2): 05015023.
5. Gandhi.M.,Parthiban.S., et.al, (2015). “NDVI: Vegetation change detection using remote sensing and gis – A case studyofVelloreDistrict.”,ProcediaComputerScience,57,1199–1210.
6. Hilker.TandSellers.P,(2014). “VegetationdynamicsandrainfallsensitivityoftheAmazon.”,.PNAS,vol.111,no.45 ,November11,16043.
© 2024, IRJET | Impact Factor value: 8.226 | ISO 9001:2008 Certified Journal | Page1398
International Research Journal of Engineering and Technology (IRJET) e-ISSN:2395-0056
Volume: 11 Issue: 05 | May 2024 www.irjet.net p-ISSN:2395-0072
7. Jiao.N.Z,Chen.D.K ,et.al ,(2015). “Climate change and anthropogenic impacts on marine ecosystems and counter measuresinChina.”,AdvancesinClimateChangeResearch,6,118-125.
8. Kinthada.N.R, Gurram.M.K ,et.al ,(2014)“Land Use/Land Cover and NDVI Analysis for Monitoring the Health of Micro-watersheds of Sarada River Basin, Visakhapatnam District, India.”, Journal of Geology & Geosciences, 3: 146.doi:10.4172/2329-6755.1000146.
9. Kumara.Nand Tischbeinb.B,(2017). “ImpactofclimatechangeonwaterresourcesofupperKharuncatchmentin Chhattisgarh,India.”,JournalofHydrology:RegionalStudies,13,189–207.
10. Rishma.C and Katpatal.Y.B, (2016). “Footprints of El Ni ˜no Southern Oscillation on Rainfall and NDVI-Based VegetationParametersinRiverBasininCentralIndia.”,JournalofHydrologyEngineering,21(12):05016030.
11. Rishma.CandKatpatal.Y.B,(2016). “VariabilityinrainfallandvegetationdensityasaresponsetoENSOevents:A casestudyinVennariverbasinofcentralIndia.”,JournalofAgrometeorology18(2):300-305
12. Mazzarino.M and Finn.J.T , (2015). “An NDVI analysis of vegetation trends in an Andean watershed.”,Wetlands EcolManage,DOI10.1007/s11273-016-9492-0.
13. Yang.J and Gong.P , (2013). “The role of satellite remote sensing in climatechange studies.”,Nature Climate Change,Vol3.
14. Zaitunah.A,Ahmad.A.G,et.al,(2018). “Normalizeddifferencevegetationindex(ndvi)analysisforlandcovertypes usinglandsat8oliinbesitangwatershed,Indonesia.”,EarthandEnvironmentalScience,126,012112.
15. Gamon,J.A.,etal.(1995).“RelationshipsbetweenNDVI,canopystructure,and photosynthesisinthreeCalifornian vegetationtypes.”Ecol.Appl.,5(1),28–41.
16. Kawabata,A.,Ichii,K.andYamaguchi,Y.(2001). “Globalmonitoringofinterannualchangesinvegetationactivities usingNDVIanditsrelationshipstotemperatureandprecipitation.Inter.J.RemoteSens.,22(7),1377-1382.
17. Diwan, P. L. (2002), “Vagaries of monsoon: Water crisis and its management. New Delhi, India: Government of India”,PressInformationBureau.
18. PriatnaD,SantosaY,PrasetyoLBandKartonoAP.(2012),“Habitatselectionandactivitypatternofgapscollared SumateranTigersJurnalManajemenHutanTropika18(3)pp155-163.
19. Ansari,T.A.,YashwantB.KatpatalandA.D.Vasudeo.,(2016),“Integratedapproachofgeospatialvisualizationand modelingforgroundwatermanagementinhardrockterrainsinNagpurUrbanArea,India”.ArabJGeosci,9:325, DOI10.1007/s12517-016-2357-2