
2395-0056
Volume: 11 Issue: 01 | Jan 2024 www.irjet.net p-ISSN:2395-0072
2395-0056
Volume: 11 Issue: 01 | Jan 2024 www.irjet.net p-ISSN:2395-0072
Seema Thippeswamy
Seema Thippeswamy* Associate Professor, BMS College of Architecture, Bull Temple Road, Bengaluru 19 Bull Temple Road, Bengaluru 560019, Karnataka, India
Abstract - School environment, specifically the architectural environment, is important to the child’s development. (Dudek, 2000). A thorough planning in creating a conducive social environment for learning is important to produce students with good potential. Basically, imparting education is a mere tool for producing professional individuals rather than good individuals academically, socially, culturally, and professionally who are capable of any challenge. Even when concern is expressed for the quality of the design of school facilities other than non-classroom spaces are often the least considered or are perceived only as places of secondary importance with no direct impact on the principal goals of schools (Catling, 2005). The research focuses on the relationship between the semi open school environment and the student’s behavior of three secondary schools in Pune. The findings suggest a clear relation between the physical environment and the comfort to the student behavior. By this studytherelationship between the non-classroomareas like corridors, passages and courtyard spaces and the student comfort is understood well. Buildings are basically designed to keep the occupant comfortable although it is very subjective in nature, but the designed environment plays a role in occupant comfort. The variables or components which affect this designed environment are temperature, humidity, air velocity and daylight levels. The parameters used for the study are temperature, humidity, air velocity and lux levels and in an objective way the questionnaire survey is used. The learning environment as a physical environment expands from the classroom of a schoolbuildingtoincludetheoutdoorsandotherpurposeful learning places. The learning environment expands to cover both formal and informal learning places, and to integrate formal and informal learning. The design and planning of the school’s external environment should give more consideration on creating a conducive environment that could foster positive social behavior. The methodology for this study opts for qualitative and quantitative survey, wherein observation survey, measurements of parameters and questionnaire survey was undertaken. The analysis for the questionnaire survey was statistically analyzed to find outtheinferences
Key Words: Corridor, Courtyard, Daylight, School environment, Thermal comfort
A well-maintained and safe physical environment fosters students’ ability to learn, to show improved achievement scores, and to exhibit appropriate behavior. This study revealed that they did not open or close windows, or change desk positions of their own accord, but accepted their condition and the arrangement of their classroom. The study also showed that a high number of pupils reacted actively to discomfort; therefore being able to interact with their surroundings would enhance the wellbeing of both children and adults. (Guili, Carli, Martina , & Bella, December 2014) The study by (Pereira, Raimondo, Corgnati, & Manuel Gameiro da, June 2014) show us that Concerning indoor air quality, focusing on CO2 concentration levels, the perceived votes reveal students’ adaptation to the environment exposure. Another study by (Astolfi, Corgnati, & Verso, 2003) states about thermal comfort that slightly warm environments are preferred in comparison with environments corresponding to neutral thermal conditions and Visual comfort is to a large extent directly related to the quantity of light available inside the overall environment and in particular over task areas. The design and planning of the school’s external environment should give more consideration on creating a conducive environment that could foster positive social behavior. (ShuhanaShamsuddina,HanimBahauddin,&NorsiahAbd. Aziz,july2012)
An example of the change of emphasis is UNESCO’s definition of education for the twenty-first century through four pillars: learning to know; learning to do; learning to live together; and learning to be. This holistic approach underlines the close relationship between physical and intellectual well-being, and the close interplay of emotional and cognitive learning in making the best of the brain’s plasticity (see OECD 2007). According to Ash and Wells (2006), some researchers have recently begun applying learning theory based on classroomworktoinformalenvironments,andconversely research on participation in informal settings has advanced understanding of topical learning theories. The learning environment as a physical environment expands from classroom and school building to include the outdoors and other purposeful learning places, and to respond in a versatile way to the challenge of young
International Research Journal of Engineering and Technology (IRJET) e-ISSN:2395-0056
Volume: 11 Issue: 01 | Jan 2024 www.irjet.net p-ISSN:2395-0072
people’sphysicalwell-being.Thelearningenvironmentas aneducationalandculturalenvironmentexpandstocover bothformalandinformallearningplaces,andtointegrate formalandinformallearning.Thelearningenvironmentas a socio-emotional, fantasy-oriented and innovative environment expands schoolchildren’s minds to learn (cf. Claxton2007).
FollowingAwartanietal.(2008,p.60),physicalwell-being refers to ‘‘feeling comfortable with one’s body and physicalabilityandbeinginahealthyphysicalstateanda healthy physical environment’’. (Kangas, 9 Nov 2020) Different alternatives may be developed for children to enhancetheirenvironmental experience,toimprovetheir environmental consciousness, and to contribute to their learning through the information that they get from the environment. All these may also be evaluated in terms of differentdisciplines.Intermsofeducation,moreactivities basedonpracticeandobservationofpracticeresultsmust be included in the curricula, applied environmental education must be offered, outdoor classrooms must be brought into the agenda by creating suitable conditions, school gardens must be designed in such a way as to enable children to interact with the natural elements. (ACAR,2014)
Physicalenvironmentorarchitectureaffectslearning;this has been researched with a single variable – the environmental factors such as noise ,temperature air quality ,heating ,ventilation and lighting (Higgins, Elaine, Kate, Pam, & Caroline McCaughey, January 2005) there is also part of research focuses on significance of colour, interiors and physical environment, making learning environment conducive to learning (Dudek 2001, Nair 2007)researchers and planners have demonstrated that use of daylight also increases students outcome (Tina Haghighat and Aziz Bahauddin). Some of the most important building factors that influence learning are those that relate to control of the thermal environment, proper illumination, adequate space, availability of equipment and furnishings, especially in the subject area of science. (Earthman,,November1998)
Considering time spent ,school environment should provide opportunities for play and learning school is also a working place and learning place if seen from spatial intelligence perspective ,physical environment indicators do matter learning place wherever children encounter with space .materials ,finishes and flexibility in space need strategic planning .so it can be concluded that more attention should be given to physical environment this plays important role in developing years of child . (Chitale & Telang) Although solid proof remains a distant goal, a picture of the environment‘sroleintheeducationalprocessisgradually taking shape .it is a picture that is likely to please neither those who advocates minimally decorated, no nonsense classrooms, nor those who advocates minimally decorated,nononsenseclassrooms,northosewhocallfor
softer “more humane educational settings.” Carol Weinstein1979.
ANSI/ASHRAE Standard 55-2013 defines the range of indoor thermal environmental conditions acceptable to a majority of occupants. A method of describing thermal comfortwasdevelopedbyOleFangerandisreferredtoas Predicted Mean Vote (PMV) and Predicted Percentage of Dissatisfied(PPD).The PredictedMeanVote(PMV) refers to a thermal scale that runs from Cold (-3) to Hot (+3), originallydevelopedbyFangerandlateradoptedasanISO standard. The aim of the research is to evaluate the semi open spaces like corridors, passages and courtyard for comfort levels in school by understanding the comfort conditions of the semi open spaces and study the relation between the use and the comfort levels of semi open spaces.
The methodology followed is qualitative & quantitative. For this research, three private schools were selected as the site case studies located in 3 different locations of Pune first located in Narhe (Case I), second located in Narhe(CaseII)andthethirdlocatedinNandedcity(Case III). The selection of schools was carefully done to understandthelocationaswellasthestudentsitcatersto. All the three schools selected follow a Central Board of Secondaryeducationsystemandarecoeducation.
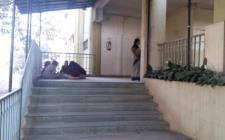
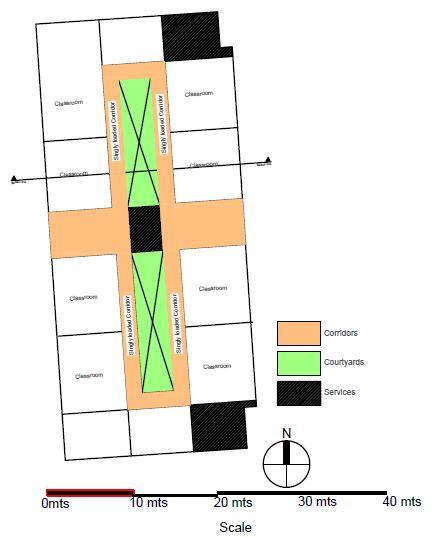
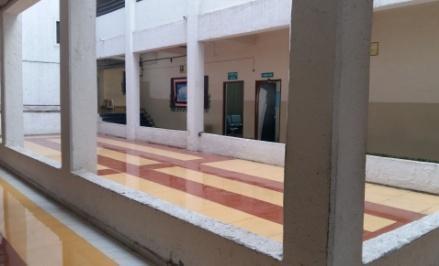
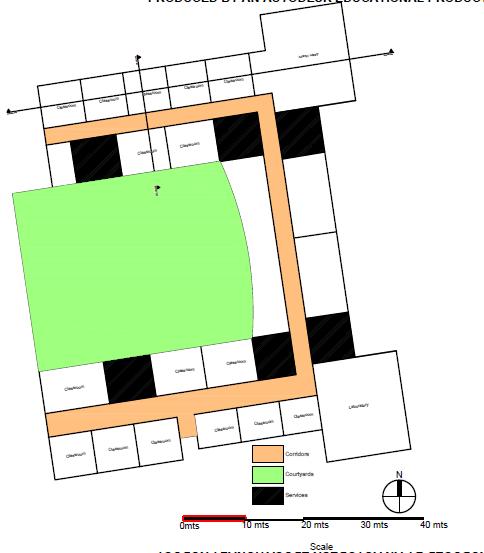
The schools were selected mainly because of their different design layout. The layout of School 1 has singly loadedcorridorsandcorridorshavingdirectaccesstothe outdoorspaces.School2hasaninward-lookingplan with an open courtyard in between with the singly loaded corridors overlooking the courtyard. School 3 is also an inward-looking plan bounded by the classroom spaces around with doubly loaded corridors with classroom spaces on either side. All three schools have semi-open areas like corridors and courtyard spaces used by the students. The study included the following firstly observationoftheschoolenvironmenttoidentifythesemi open spaces and understanding their usability proceeded by collecting Primary data through questionnaire, interview and measurements for temperature, humidity, air velocity for the semi open spaces. Finally subjective evaluation of Questionnaire and interview objective evaluationofthemeasurementdata.
The Research has adopted three techniques like observationalsurvey,thermalanddaylightmeasurements & questionnaire survey Students involved in the study were from standard fifth to tenth since they are mature enough to understand the questionnaire better as compared to lower classes as they are the ones who use thesespacesmorebecausetheyarefreetousethespaces
unlike the lower standards who are restricted to use the semiopenspaces.
The selection of classrooms to conduct the questionnaire survey was also done based on the orientation of the classroom and the corridors. Students from all forms of background were involved in the questionnaire. All Studentsofaparticularclasswereinvolvedinaclassfrom one division only fifth to tenth classes in each school. These respondents’ classrooms were also selected based on orientation. Classrooms oriented on North, East, West and South became the criteria for selection. The questionnaire format had closed ended questions with multiplechoicequestionswherethechoicewasrestricted to one answer only. Furthermore, a few questions had more than one option to be selected where the student couldchoosemorethanoneanswer.Intotal680students from 3 schools were involved in the survey out of which 450 were analyzed for the survey and the rest went as absent and incomplete. Chi square testwasconducted for thequestionnairesurvey.
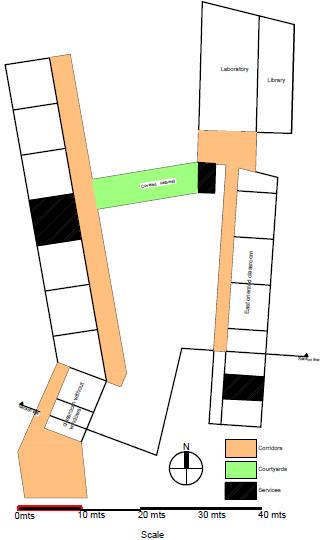
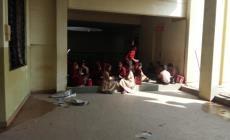
The observational survey in each case highlights the corridorandopenspacehighlighted with differentcolors. CaseIisalinearplanningandsetonacontouredsite.The corridorsaresinglyloadedhavingclassroomsononeside and open to the green area on the other side. Case II has inward looking plan where all the classroom corridors overlook the central small courtyard which is used as an assemblyplace.
International Research Journal of Engineering and Technology (IRJET) e-ISSN:2395-0056
Volume: 11 Issue: 01 | Jan 2024 www.irjet.net
Author

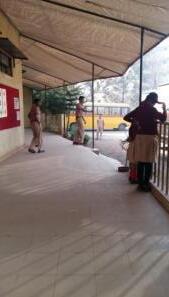
Corridor spaces used for interaction and navigation
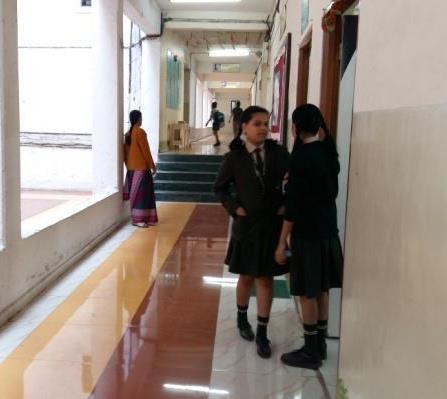
Corridors used as Interaction space & Small
assembly
p-ISSN:2395-0072

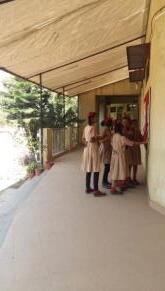
Nichescreatedin the corridor used for interaction
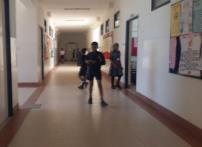

Corridors a for interaction and fornavigation
Courtyard small in size used only forassembly
Source:Author
Table -1: DaylightlevelsandthermalcomfortforCaseI. Source:Author
International Research Journal of Engineering and Technology (IRJET) e-ISSN:2395-0056 Volume: 11 Issue: 01 | Jan 2024 www.irjet.net p-ISSN:2395-0072
Source:Author
Source:Author
Author
Source:Author
Author
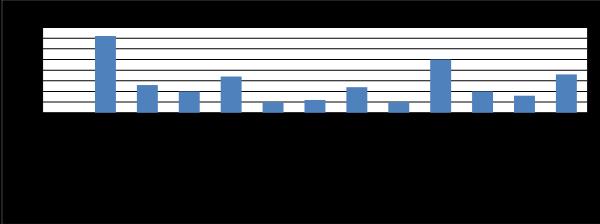
Table -7: DaylightlevelsandthermalcomfortforCaseIII. Source:Author
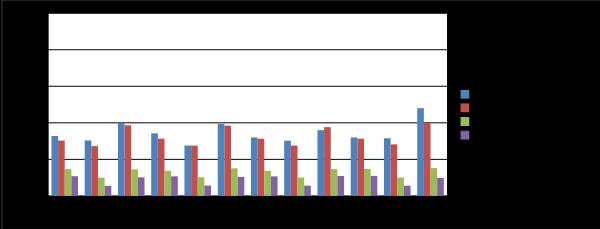
Table -8: ThermalcomforttablewithPMVvaluesforCase III.Source:Author
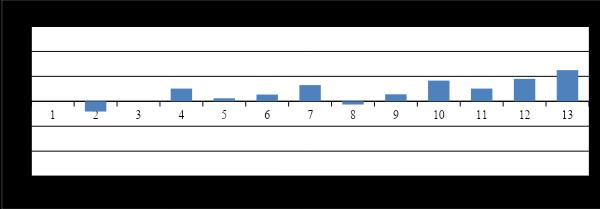
Table -9: ThermalcomforttablewithPPDvaluesforCase III.Source:Author

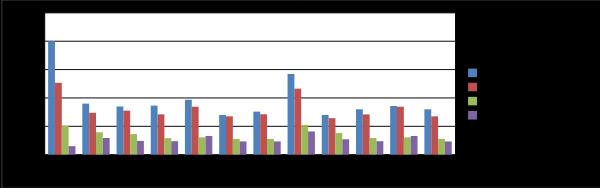
3.1 Findings from quantitative data
Table 1. shows the daylight levels in the corridor spaces when compared to the enclosed spaces. It shows a higher luxvaluesmakingitbrighterthantheclassrooms
Table2showsathermalcomfort(PMV)rangingbetween.7 to +.7 interpreting a sensation of slightly warm to slightlycoldasperASHRAEthermalcomfortscale.
Table 3 shows a PPD of maximum upto 18% where 5% PPD is the lowest percentage of dissatisfied practically achievable since providing an optimal thermal environmentforeverysinglepersonisnotpossible.
Table 4 shows the daylight levels in the corridor spaces when compared to the enclosed spaces. It shows a higher luxvaluesmakingitbrighterthantheclassrooms
Table5showsathermalcomfort(PMV)rangingbetween1.2 to +1 interpreting a sensation of slightly warm to slightlycoldasperASHRAEthermalcomfortscale.
Table 6 shows a PPD of maximum upto 35% where 5% PPD is the lowest percentage of dissatisfied practically
achievable since providing an optimal thermal environmentforeverysinglepersonisnotpossible
Table 7 shows the daylight levels in the corridor spaces when compared to the enclosed spaces. It shows a higher luxvaluesmakingitbrighterthantheclassrooms
Table8showsathermalcomfort(PMV)rangingbetween.4 to +1.2 interpreting a sensation of slightly warm to slightlycoldasperASHRAEthermalcomfortscale.
Table 9 shows a PPD of maximum upto 30% where 5% PPD is the lowest percentage of dissatisfied practically achievable since providing an optimal thermal environmentforeverysinglepersonisnotpossible
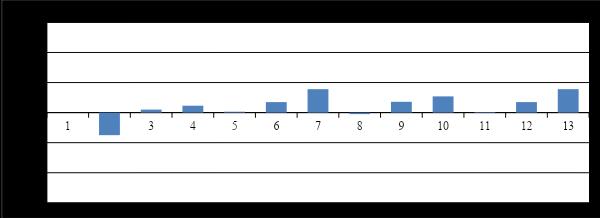
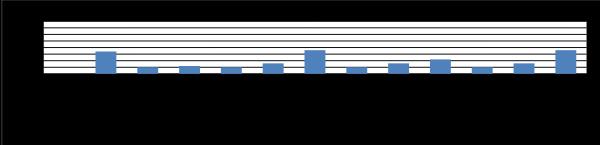
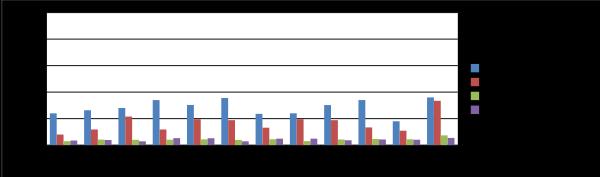
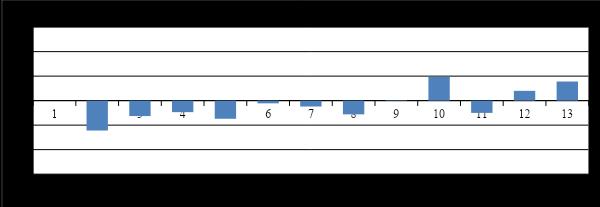
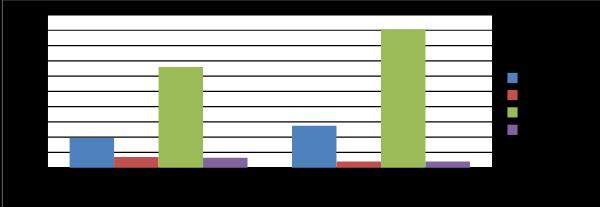
3.2 Inferences from the graphs:
Thedaylightgraphsforallthreeschoolsshowthatthelux valuesinthecorridoraremuchhigherthantheclassroom.
The thermal comfort (PMV) graphs show that the sensation level ranges between slightly cool and slightly warmtoexperienceneutralconditionmostofthetime
The PPD scale shows that a maximum of not more than 20% are dissatisfied wherein PPD(Predicted Percentage Dissatisfied)describes the percentage of occupants that aredissatisfiedwiththegiventhermalconditions.5%PPD is the lowest percentage of dissatisfied practically achievable since providing an optimal thermal environment for every single person is not possible. Source:https://www.educate-sustainability.eu/
4. Questionnaire Survey:
Thequestionnairesurveyincluded2parts
Part 1: This included the generic information about the name,age&gender
Part 2: This included multiple choice questions for respondents which followed a nominal scale about use of spaces.
Q2toQ5&Q9relatedtospendingtimeanduseofspaces
Q6,&Q7Aboutactivitydoneinthesespaces
Q8,Q10&Q11onthequalityofspaces.
2395-0072
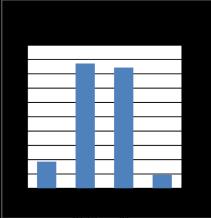
Table -10: Graphshowinggenericinformation..Source: Author


A statistical analysis of the questionnaire survey was conducted to have cross tabulation counts with two variables and a chi square test for the same was used for evaluation.
5.1 Cross tabulation counts in Questionnaire survey and Chi square test
Table -11: CrosstabulationcountGraphshowingclimate ofcourtyardinsummer&useofspaceinsummer
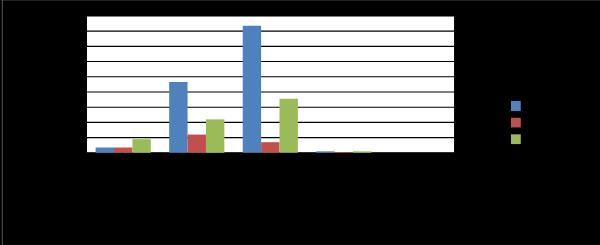
Table -12:.crosstabulationcountforClimateincourtyard insummeranduseofspaceinsummer
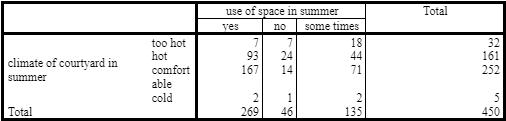
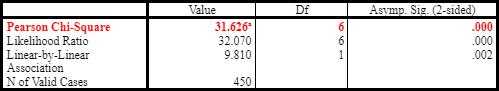
Table -13: Chi-SquareTestsresults4cells(33.3%)have expectedcountlessthan5.Theminimumexpectedcount is.51.
International Research Journal of Engineering and Technology (IRJET) e-ISSN:2395-0056
Volume: 11 Issue: 01 | Jan 2024 www.irjet.net p-ISSN:2395-0072
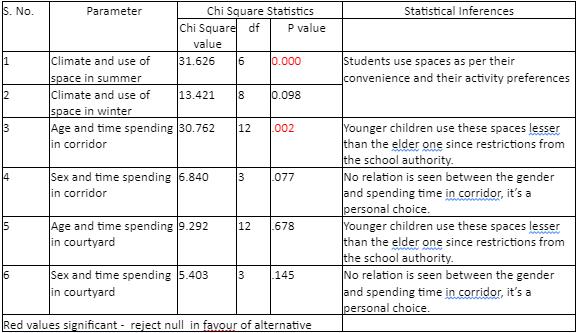
Since at df= 6 P value ( 0.000) is less than level of significance 0.05 / alpha value (0.05) at 5% level of significance there is sufficient grounds to not accept the nullhypothesis
Null hypothesis: Climate and use of space in summer are independentofeachother.
Alternative hypothesis: Use of space in summer depends onclimaticconditions.
-14:
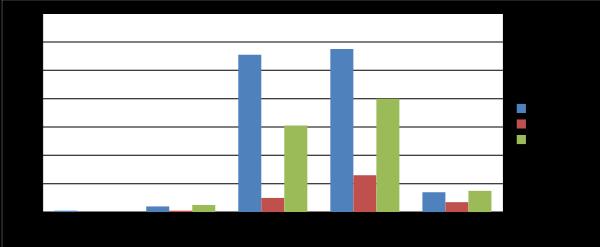
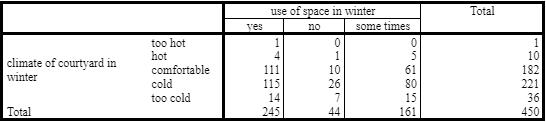
Table -16:.Chi-SquareTestsresults6cells(40.0%)have expectedcountlessthan5.Theminimumexpectedcount is.10.
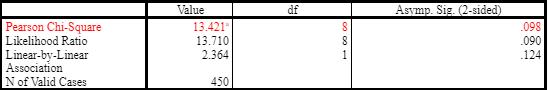
Since at df= 8 P value ( 0.098) is more than level of significance 0.05 / alpha value (0.05) at 5% level of significance there is sufficient grounds to accept the null hypothesis
Null hypothesis: Climate and use of space in winter are dependentoneachother.
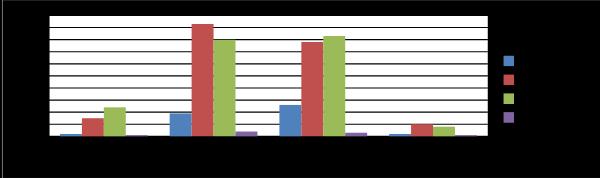
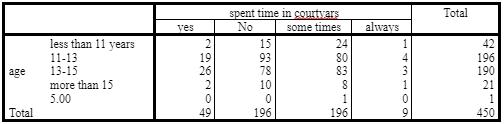
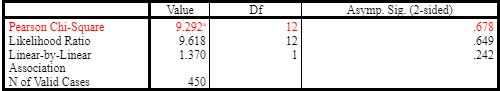
Table -17 Graphshowingage&spenttimeincorridor Crosstabulationcount
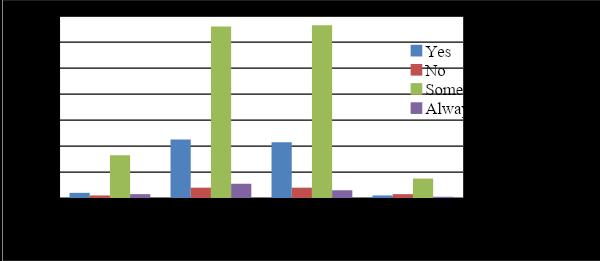
Table -18 Graphshowingage&spenttimeincorridor Crosstabulationcount
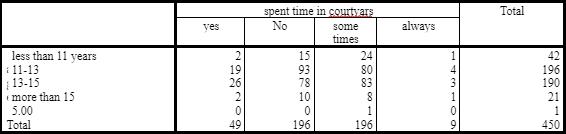
Table -19 Chi-SquareTestsresults10cells(50.0%)have expectedcountlessthan5.Theminimumexpectedcount is.02.
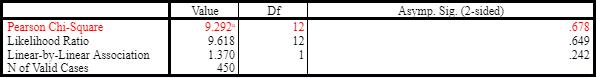
Since at df= 12 P value ( 0.678) is more than level of significance 0.05 / alpha value (0.05) at 5% level of significance there is sufficient grounds to accept the null hypothesis
Null hypothesis: Age and time spent in corridor are dependentofeachother,statingthatStudentsstudyingin higher standard spent more time when compared to youngerstudentsincorridorsandcourtyards
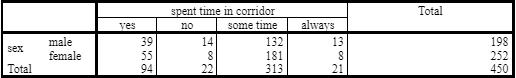
Table -20: Graphshowinggender&spenttimeincorridor Crosstabulationcount
International Research Journal of Engineering and Technology (IRJET) e-ISSN:2395-0056
Volume: 11 Issue: 01 | Jan 2024 www.irjet.net p-ISSN:2395-0072
-22:
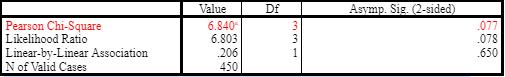
Since at df= 3 P value ( 0.077) is more than level of significance 0.05 / alpha value (0.05) at 5% level of significance there is sufficient grounds to accept the null hypothesis
Nullhypothesis:Genderandspendingtimeinthecorridor areindependentofeachother.
Table -23: GraphshowingAge&spenttimeinCourtyards
-24:
-25:
Since at df= 12 P value ( 0.678) is more than level of significance 0.05 / alpha value (0.05) at 5% level of
significance there is sufficient grounds to accept the null hypothesis
Null hypothesis: Age and spending time in courtyards are dependentoneachother,statingthatStudentsstudyingin higher standard spent more time when compared to youngerstudentsincorridorsandcourtyards
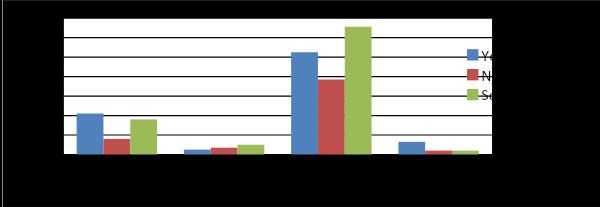
Table -26: GraphshowingGender&spenttimein CourtyardsCrosstabulationcount
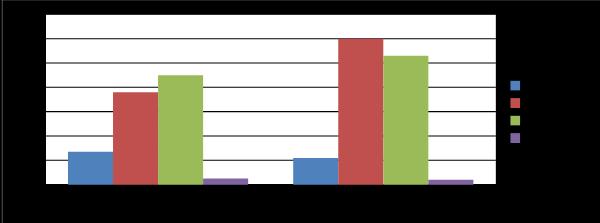
Table -27: Gender&spenttimeinCourtyardsCross tabulationcount
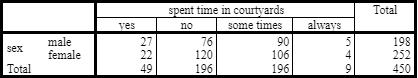
Table -28:Chi-SquareTestsresults.1cells(12.5%)have expectedcountlessthan5.Theminimumexpectedcount is3.96.
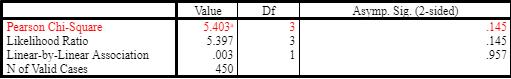
Since at df= 3 P value ( 0.145) is more than level of significance 0.05 / alpha value (0.05) at 5% level of significance there is sufficient grounds to accept the null hypothesis
Null hypothesis: gender and spending time in courtyards areindependentofeachother.
Table -29: GraphshowingspenttimeinCorridoranduse inmonsoonCrosstabulationcount
International Research Journal of Engineering and Technology (IRJET) e-ISSN:2395-0056
Volume: 11 Issue: 01 | Jan 2024 www.irjet.net p-ISSN:2395-0072
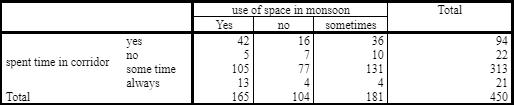
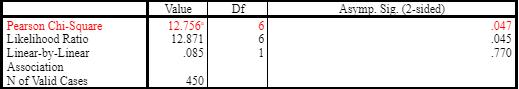
Since at df= 6 P value ( 0.047) is less than level of significance 0.05 / alpha value (0.05) at 5% level of significance there is sufficient grounds to reject the null hypothesis
Null hypothesis: Spending time in the corridor and use of spaceinmonsoonisindependentofeachother.
Alternative hypothesis: Students use the corridors in monsoon depending on the type of corridors and restrictions on use and how well they are protected from rain
Toconcludetheresearchshowscertainfindingslikeuseof corridors are dependent on a personal choice depending ontheactivity,timeandthemaintenanceofthespaces.As there are restrictions on use of spaces depending on age hence the corridors and courtyards are used more by the
older children. There is no evidence of gender priority in use of the spaces but generally used as the students wish touseitfortheirpersonalchoice.
Thethermalmeasurementsandquestionnairesurveylead tocertain findings whichstatethe behavior ofchildren to semi open areas of the school environment due to the comfort levels and light prevailing in the corridors and courtyards. The conclusion to this research states certain findingsfromthesurveyconductedonfieldandevaluating thesamefordifferentconditionsaswell.Thermalcomfort show that that the corridors space lie around neutral conditions&Daylightlevelsincorridorandcourtyardare morethanclassrooms,hencethestudentswouldpreferto spend time and have access to outdoor environment but duetorestrictionsonuseofspacesonlyduringbreaksand todifferentagegroupstheusedependsonagebutnotthe gender. Students studying in higher standard spent more time when compared to younger students. Use of space depends on the climatic condition and depends on what climate is prevailing. For summers it is for fresh air and during winter having access to sunlight and during monsoonsitisusedonlyifitisprotectedfromrainsandif notdirty.Ageandspendingtimeinthecorridor/courtyard are independent of each other. The activity mainly happeninginthecorridorsandcourtyardsareinteraction, navigation,andaccesstotheoutdoorenvironment.
The author would like to acknowledge the school managementandstudentswhotookpartinthisresearch.
A. Nabil, & J. Mardaljevic. (March 2005). Usefull Daylight Illuminance: A new paradygm for assessing daylight in buildings. Lighting Research and Technology·
ACAR, H. (2014). Learning Environments for Children in Outdoor Spaces. Procedia - Social and Behavioral Sciences.
Altuğ Kasalı, & Fehmi Doğan. (December 2010). Fifth, sixth-, and seventh- grade students’ use of nonclassroomspacesduringrecess:Thecaseofthree private schools in Izmir, Turkey. Journal of Environmentalpsychology.
Astolfi,A.,Corgnati,S.,&Verso,V.L.(2003). Environmental comfort in university classrooms – thermal, acoustic,visual.
CO-OPERATION, O. O. (2009). Creating Effective teaching and Learning Environments: First Results from TALIS. OECD.
Earthman,,G.(November1998).THEIMPACTOFSCHOOL BUILDING CONDITION AND STUDENT ACHIEVEMENT, AND BEHAVIOR. International Conference The Appraisal of Educational Investment. Luxembourg: European Investment Bank/ Organization for Economic Coordination andDevelopment.
Elpida Vangeloglou, & Helle Foldbjerg Rasmussen. (Oct 2015). Evaluation of daylight in buildings in the future. REHVAJournal.
Guili, V. D., Carli, M. D., Martina , C., & Bella, A. D. (December 2014). Overall Assessment of Indoor Conditions in a School Building:an Italin Case tudy. Internationsl Journal of Enviromental Research
Higgins, S. E., E. H., K. W., P. W., & Caroline McCaughey. (January 2005). The Impact of School nvironments:AliteratureReview. ResearchGate
Kangas,M.(9Nov2020).Finnishchildren'sschoolveiwon ideal school and learning environment. Learn Environmontel'sResearch
Kota, S., & J. S. (2009 ). Historical Survey of Daylighting Calculations Methods and Their Use in Energy. Ninth International Conference for Enhanced Building Operations, (pp. November 17 - 19, ). Austin,Texas,.
Mardaljevic, J. (April 2015). Climate-Based Daylight Modelling And Its Discontents. CIBSE Technical Symposium,(pp.16-17).London,UK.
Obaki, S. O. (2017). IMPACT OF CLASSROOM ENVIRONMENT ON CHILDREN’S SOCIAL BEHAVIOR. International Journal of Education and Practice
Pereira, L. D., Raimondo, D., Corgnati, S. P., & Manuel Gameiroda.(June2014).Assessmentofindoorair quality and thermal comfort in Portuguese secondary. BuildingandEnvironment
Peter Barrett, Alberto Treves,, Peter Barrett, Alberto Treves,, Tigran Shmis, , Diego Ambasz, , & and
Maria Ustinova. (2019 INTERNATIONAL DEVELOPMENT IN FOCUS). The Impact of School Infrastructure on Learning: A Synthesis of the Evidence. International Bank for Reconstruction andDevelopment/TheWorldBank.
Shuhana Shamsuddina,HanimBahauddin,&NorsiahAbd. Aziz. (july 2012). Relationship between the Outdoor Physical Environment and Students’ Social Behaviour in Urban Secondary School. SocialandBehavioralSciences.
Seema Thippeswamy is Associate Professor at BMS College of Architecture, Bengaluru. She has her bachelor’s inarchitectureandmaster’sinenvironmentalarchitecture activelyengagedasanacademician.