LIGHTWEIGHT INDOOR POSITIONING IN A REAL ENVIRONMENT BASED ON WIFI FINGERPRINTING TECHNIQUE AND M-WKNN ALGORITHM
Jean Ndoumbe1*, Soubiel-Noel Nkomo Biloo1 and Agnès Enangue11Laboratory of Energy, Materials, Modeling and Method (E3M), National Higher Polytechnic School of Douala, University Douala, Cameroon
Abstract - The aim of this work is to study a lightweight system for predicting indoor location in an ordinary dwelling using the fingerprinting technique and the MWKNN (Modified Weighted K-Nearest Neighbors) algorithm based on listening to the power levels of Wi-Fi terminals. To this end, an error reduction procedure has been developed and implemented in the M-WKNN algorithm. The residual calculation technique and sample weighting are used for this error reduction. In order to assess the performance of the proposed approach, a comparison is made with two traditional algorithms, KNN and WKNN. The results reported in this work evaluate the performance of the MWKNN algorithm at 92% with respect to the input data
Key Words: indoor localisation, fingerprinting technique, powerlevels,M-WKNNalgorithm,residualmethod.
1. INTRODUCTION
Geolocationisessentialtodayformanyoftheapplications embedded in electronic devices. In fact, the technological boom that the world has been experiencing for the last two decades or so means that we need to have a perfect command and understanding of the space around us. Geolocation has two main applications, depending on the environment:outdoorgeolocationandindoorgeolocation. Today, because of the ever-improving results of satellite systems [1-2] used or dedicated to positioning, the scientific community is focusing mainly on the indoor environment, especially as some studies show that the humanbeingspendmostofthetimeinenclosedspaces[34] (indoor environment). The Global Positioning System andothersatellitesystemscannolongerprovidethesame reliability here as they do outdoors. Firstly, it is difficult for waves to propagate and penetrate the indoor environment, and secondly, the multipath phenomenon that characterises this system in particular clouds the results and distorts them. Another factor is the reference frame, which can be physical, relative, absolute or symbolic [5-6]. To overcome these disadvantages, a number of indoor methods have been proposed, particularlythoseinvolvingfingerprinting.
To date, however, there is no standard method for either indoor or outdoor positioning [7-9]. In order to find the position of an RF device, different measurements can be used such as Received Signal Strength (RSS), Time Of
Arrival (TOA), Time Difference Of Arrival (TDOA), Frequency Difference Of Arrival (FDOA), Angle Of Arrival (AOA), Power Difference Of Arrival (PDOA), Frequency DifferenceofArrival(FDOA)andDifferentialDopplerRate (DDR). Depending on the degree of criticality of the information provided by the position of the object to be geolocated,thechoiceofonetechniqueoranotherisopen. In recent years, the aim has no longer been simply to geolocate an object or provide it with a means of navigation, but to find the best compromise between the complexity of implementing the hardware and software, thecostoftheprocessandtheresultsobtained,giventhat theresultsdependonalltheseparameters.
Several works studying different algorithms for indoor positioning have been done. Zhou et al. [10] proposed an RSS transform–based weighted k-nearest neighbor (WKNN) indoor positioning algorithm to improve the positioning accuracy and real-time performance of Wi-Fi fingerprint–based indoor positioning. From the results, the proposed approach achieved a localization error of 1.52 m. Hu et al. [11], studied a self-adaptive WKNN algorithm with a dynamic K for indoor positioning based onWi-Fi.In[12],theresearchleveragestheuseofa deep neural network-based ensemble classifier to perform indoor localization with heterogeneous devices. Among many indoor position calculation algorithms, those using machine learning are most studied such as deep learning and neural networks (DNN and MLNN) [12-14]. Works carriedoutinindoorpositioningsystem[14-16]generally deals with near-perfect environments, free of human traffic (empty corridors, houses with no furniture). With such perfect process, the results can easily be duplicated. However,theseresultsarefarfromreflectingtherealityof locatingortrackinganobject.Thepresenceofanobjectin thepathofthewaveamplifiesthemultipathphenomenon, reduces the power picked up and increases the propagation time [8]. The presence of a human body randomlydistortsthesignalbyreducingitsenergy[17].
This work is a contribution to the search for the best compromise in smartphone positioning in a real indoor domestic environment. The first objective is to propose a lightweight and most effective method, and the second is topresentthephenomenathatreducetheefficiencyofthe usedalgorithm,workinginrealindoorlocationconditions. This work is based on an existing technique; the

improvement comes from modifying of the data sampling procedure. Derived from the KNN algorithm for fingerprinting [12-13], the W-MKNN [14] have been choose in this work, which is itself derived from the WKNNalgorithm[15-16].Awareofthefactthatmultipath is present and causes the results obtained to drift, we set up an effective error reduction procedure using sample weighting,selectivesortingusingtheresidualmethod[8], andtheuseofradiodistance.Thebodyeffectisneglected because its consideration would have added complexity and therefore cost. Experiments carried out in a domestic indoor environment are compared with the KNN and WKNN algorithms. Later, some factors that considerably influenced the result of the algorithm (temperature and propagation inside materials) are highlighted. The Wi-Fi 802.11bstandardsignalwasused.
Theaimofthisworkistosimplifythepositioningprocess andminimisethehardwareused,whileguaranteeinggood results for domestic use of the positioning system. Experimental conditions for both the online and offline phases were identical (calculation of the residual, weighting of the samples, human presence during the surveys).
2. MATERIALS AND METHODS
2.1 The Indoor experimental environment
Thefirststepinsettingupanindoorpositioningsystemis to identify and analyze the appropriate environment in whichthesystemistobedeployed.Thisenvironmentmay be a household, as in the case of this work, a hospital, a supermarket, a covered stadium or an airport. The studyingenvironmentisabreeze-blockhouseof20mlong and 11 m wide, excluding the veranda. The four APs (AccessPoints)arefixedthroughoutthedatacollectionfor thedatabase.Fig-1showstheexperimentalenvironment.

axesofthehorizontal plane. Measurementsweretakenat aheightof1mfromtheground.ThevariousWi-FiAPsare placed at a height of 75 cm above the ground, so they are lowerthanthefingerprintcollectionpoints.Thiswasdone inordertobeascloseaspossibletothereal-lifesituation. The environment was characterized by the presence of sevenpeoplewhocontinuedtoactinanaturalway.
2.2 Error Reduction
Human influence on electromagnetic waves
Studies to date on the influence of the body on waves have been carried out to determine the general consequences of the presence of the body, but also of its orientationinonedirection(north,south,etc.).Authorsin [17]points out thatmore than70% ofthehuman body is made up of water and show that the operating frequency ofWi-Fi2.4GHzabsorbselectromagneticradiation.Thisis duetotheresonancecreatedwithwateratthisfrequency. It one can conclude that, given this composition of more than 70%, the impact of the presence of the body is not negligible. [18] shows that apart from multipath, which already causes the received value of a power level to oscillate around an average, the presence of a body increases the distribution of this power variation. The standarddeviationrisesfrom0.68dBmto3.00dBmwhen the user is close to the mobile receiving the signal. The averageofthesamplescollectedrisesfrom-70.4dBmto71.6 dBm, a difference of -1.2 dBm. In the present study, the"bodyeffect"phenomenonhasnotbeenconsideredin thiswork.
Measurement of Values by Average of Samples
The idea of sampling comes from Xiao-Min Yu who [19], with the help of an image, shows the various fluctuationsinthepowerlevelofthesignalreceivedatan identical position over an extremely short period of time. He records the power levels for one minute at a static position. Noting that the value was not stable for all the samples,hesuggestedtakingtheaverage.Inthiswork,the same logic to both the database records and the measurements taken in real-life situations during the onlinepositioningphaseis.Infact,basingourcalculations solely on the first value obtained could lead to errors which could have a devastating effect on the positions obtained. By using this procedure, we can at least guaranteethatthefluctuationsinthepowerleveloscillate around an average value. However, for our work we have chosentosamplethepowervariationsoveraperiodof30 secondseverythreeseconds.
Sorting using the residual method
Fig -1 : Indoordomesticexperimentalenvironment

The collection of footprints for the database was carried out using a mesh, with points 1.2 m apart along the two
After conducting a short experiment on signal power level fluctuation, R. Zhou [20] concluded that this fluctuation relationship is non-linear. So that, it is
impossible to predict these variations in power levels. It can be seen that this fluctuation can easily reach a 10 dB difference.
Over time, depending on variations in the environment, the climate and the nature of the transmitting and receiving equipment, the signal fluctuates unpredictably. To attenuate this fluctuation, which causes errors in position calculation, the absolute RSS difference (RSS-ABS-DIFF), which is around 10 dB, needs to be reduced. To do this, we propose a method of pre-processing the RSS database to eliminate large errors andabnormalentries.
Considering a measurement taken at a given position over a period of time and during this time �� measurementsareperformed.
The residual ���� is defined to measure the degree of deviation����(q) fromthemeanofthe��RSSdenoted������by :
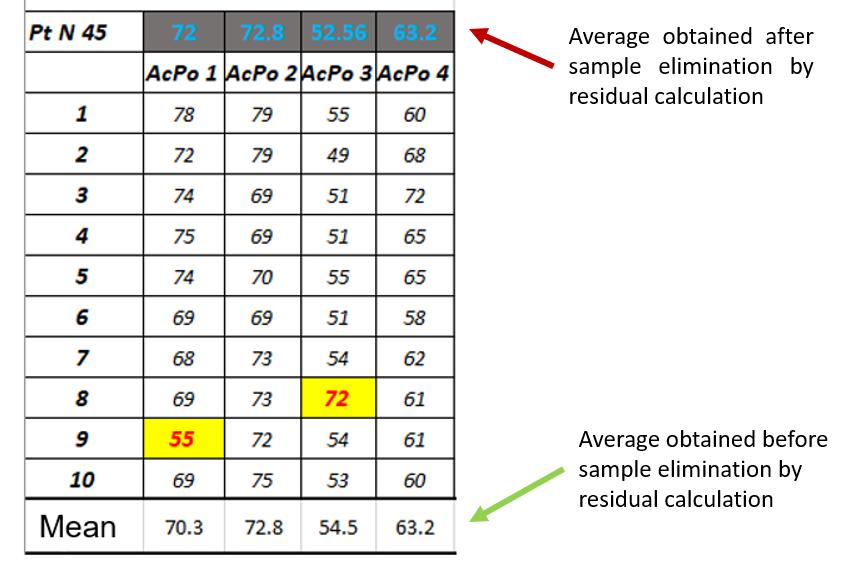
deviation using the residual method. It can be seen that the 55 dB and 72 dB samples have an influence on the mean deviation. Those samples have been eliminated fromthecalculations.
Database of positioning fingerprints

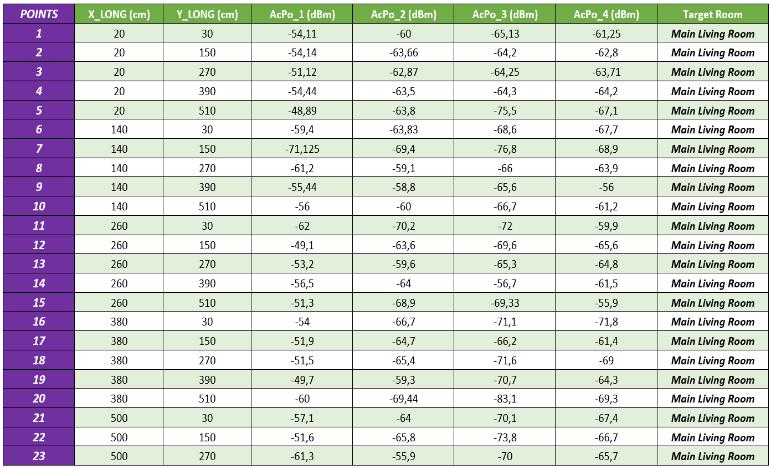
The fingerprinting stage consist of two operations, the data collection and the creation of the fingerprint database. The result of the fingerprinting operation, illustrated in table 2 below, is a dataset consisting of 138 points (or fingerprints). Each point, as shown in Fig. 1, is defined by its coordinates in the plane (X_LONG and Y_LONG), the identity of the item to which the point belongs,andthepowersofthefoursignalsreceivedatthis point. This dataset has been split in two to make it easier to handle: the first part contains the ID of the point, the target room column and the powers received, while the secondcontainstheIDandthecoordinatecolumns.
Thisallowstocalculatethesquarerootofthemeanofthe squaresoftheresidualspreviouslyobtained.
At this point, we apply the criterion of the centred reduced normal distribution, which consists of keeping only the values of ������(q) such that: |���� | > 3 to obtain a confidence interval of 99.7%. Once these values have been retained, it can then perform the average to obtain final results. Table -1 illustrates the calculation of the
Prediction and position calculation algorithm
The process used in this work consists of reducing noise and thus reducing the algorithm's error rate by calculating the residual. Most authors apply an asymmetric process. The operations applied to the data during the offline fingerprint collection phase are not applied to the data entered during the online phase. We therefore applied the same measures in this phase as in the offline phase. Prior to the online phase, we collected the RSS data that will be used to search for the nearest contacts by recording them over a period of 30 seconds every three seconds. We therefore obtained 40 RSS samplesperpoint(10 for each APs).Afterharvesting, we look for any significant discrepancies between the RSS data collected and then the residual is calculated. If a discrepancy is found, the value responsible for the discrepancyisremovedand theaverageoftheremaining valuesiscalculatedandusedtoestimatetheposition.The data can then be used in a MW-KNN algorithm to
estimates the position. The overall process of position fingerprintalgorithmlocationisgivenasfollow.
1- Definition and initialisation of the KNN Model model=KneighborsClassifier()
2- Hyper-parameters initialisation
N_neighbors=3 Metric=‘euclidean’
3- Model Training Model.fit(X_train,Y_train)
4- Initial Prediction
a-Argumentsinitialisation (AcPo_1,AcPo_2,AcPo_3,AcPo_4)
b-Prediction
N=model.predict(model, AcPo_1, AcPo_2, AcPo_3, AcPo_4)
5- Determination of K_nearest_neighbors (here 3) print(kneighbors(N))
3.2 Tests with KNN, WKNN and MW-KNN algorithm
6- Defining the MW-KNN prediction function : MW-KNN weighting forjinrangekm
P1j =Dataset[‘AcPo_1’,j]
P2j=Dataset[‘AcPo_2’,j]

P3j =Dataset[‘AcPo_3’,j]
P4j =Dataset[‘AcPo_4’,j]
W1 = 1/10(P1) ... W4 = 1/10(p4) (W is the weight assignedfortheweighting) (3)
7- Coordinate calculation
forjinrangeKm
x=(Wj *Dataset[‘X_LONG’,j])+x
X_Targert=x*(1/4)(sameprocedureto calcuteY_target)
(X_TargetandY_Target:abscissaandordinateofthepoint onthe movingbodythatwearetryingtolocate).
Implementation
The position calculation algorithm was implementedinPython
3. RESULTS AND DISCUSSIONS
3.1 Wifi terminal signal strength
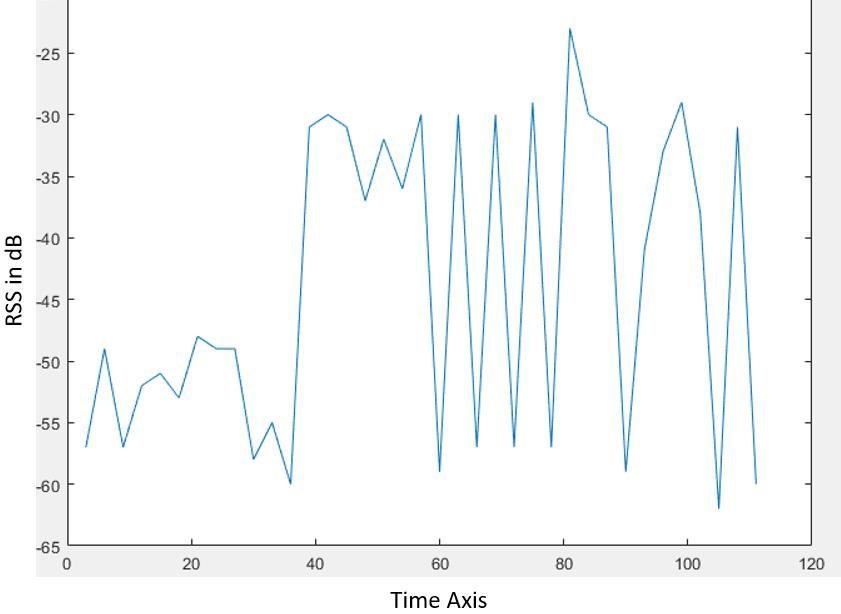
To start, analysis of available Wi-Fi signal was done The measured signal strength at 3 m from the access point (AP)isshowninFig-4.ithasbeenobservingthatthe WiFisignalemittedbytheAPswasveryunstable,evenwhen the receiving equipment is stabilised on a single position. One reason that comes to one’s mind is because of wall andotherobjectsobstructingthesignal Also,interference becauseofotherwirelessnetworksandthepoorqualityof APsdevice.
In order to verify the validity of the proposed algorithm, MW-KNN algorithm is compared to two traditional algorithms KNN and WKNN. Having selected random points in the experimental environment, the measurements have run from these points through the three machine learning algorithms. For this purpose, the measurementsusedweretakeninthesamewayasforthe offlinephase.
Once the results obtained, it can see that the proposed approach produce better results comparing to KNN and W_KNN algorithm. The MW-KNN algorithm and error reduction measures deliver an average improvement of 43%overKNNand15.35%overWKNN.Thebestresultof thetestscarriedoutgivesanimprovementof76.5%over KNNand58.5%overWKNN.

Fig -3 : Errorofdifferentalgorithmsintheexperimental environment KNN,WKNNandM-WKNN
3.3 Analysis and interpretation of errors
Quantitative data analysis
Figure4showsthevalidationandtrainingcurves as a function of the percentage of data used. Both curves show very rapid growth with the number of data. The
trainingcurveshowsanearlypeakataround27sampling point.
Impact of walls and openings on radio signals
In indoor environments, the presence of walls, floors, furnitureorpeoplemayhaveastrongimpactontheradio waves propagation. Previous works have shown that wallsabsorbhertzianwavesandthusreducethepowerof the propagating signal either by absorption, diffraction or reflection.Thelevelofabsorptiondependsnotonlyonthe frequency of the radiation but also on the material compositionofthewallorslabinquestion.
quantity
This number represents the number of dataset entries required for the algorithm to produce a training score of 82%. We can see that the curve decreases slightly and then rise at below 30 sampling point. The experiment indicates that the algorithm will learn better with a large amount of input data. By using 138 sampling points, we obtained an efficiency of 91.8% for our algorithm. The curve shows that for 63% of the points used for testing, thealgorithmisalready83%efficientforvalidation.

Impact of the temperature
Most of studies on temperature impact in positioning systemhavebeendoneinoutdoorsenvironment[21-22]. So fare, in this work, experiments are conducted in the proposed indoor environment to evaluate the impact of thetemperatureonthesignallevelemittedbyAPs.
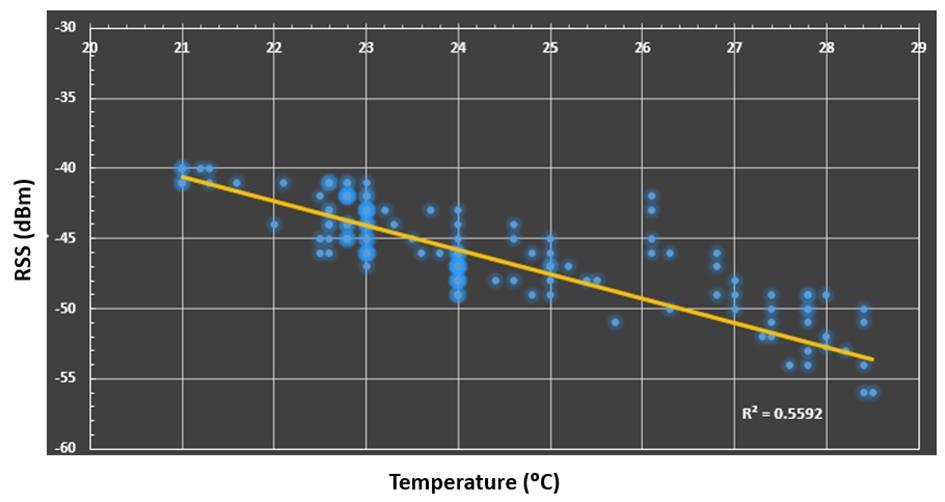

We therefore collected signal level values received at severaldifferenttimesofthedayand overseveraldays.A leastsquaresregressioncriteriontothesepoints Figure5 shows the effect of temperature on the signal power. In the scatterplot, we can observe a negative relationship exist between indoor temperature and captured signal level. The signal level decrease with the increasing of temperature.
To assess the impact of walls and other structures on the electromagneticwave,themulti-wallpropagationmodelis used [23]. This model takes into account all the walls and all the floors crossed by introducing transmission loss coefficients depending on the thickness and the nature of thematerial.Therefore,thereceivedpowerPL(indB)can beexpressedas:
∑ (4) with;
n:attenuationfactor
Lc:isaconstant
mj:numberofwallsoftypej
lj:lossfactorofwallsoftypej
Kf :numberofslabs
lf:slablossfactor
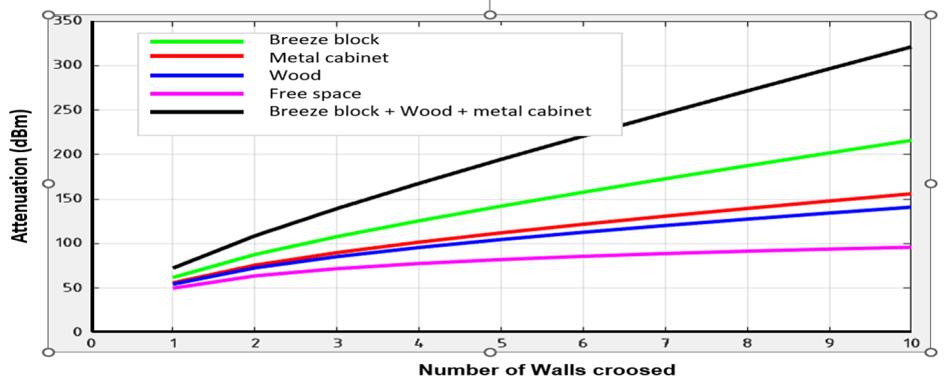
Figure 6 shows the number of walls crossed dependence of the electromagnetic wave attenuation of single-layer material aswell asofmulti-layerone calculatedusing the multi-wall model. The experiments show that free space reduces signal power less than the other materials presented in this study. For a signal passing through a breeze-block wall, a metal cupboard and a wooden door, the losses evaluated using the multi-wall propagation model are around 75dB. This value is already significant and is enough to destroy the quality of the signal and therefore the quality of the proposed algorithm. Finally, cement produces more losses than metal, which in turn produces more losses than wood. In terms of signal quality, it would therefore be preferable to use wood ratherthanmetalandtheconcrete
4. CONCLUSIONS
A Modified Weighted K-Nearest Neighbor (M-WKNN) algorithm to position determination based on listening to thepowerlevelsofWi-Fiterminalshavebeendiscussedin this paper. The work carried out throughout this study was conducted in a real indoor environment, and the experimental results indicated that the positioning performance of the proposed algorithm is considerably convenient for Wi-Fi based indoor positioning system for areas such as dwelling house or shopping malls than the traditional WKNN and KNN algorithm. Also, the approach consists of carrying out all the noise and error reduction operations upstream, which are usually only carried out whenthepositioniscalculated.Onthebasisofalmost138 points in the database and 4 access points, for the proposed approach, the average positioning error is 1.77 m,withamaximumof3.11mandaminimumof0.72m.
The work carried out shows that the temperature, the 'humanbody'factorandthepresenceofwallsandobjects have a major negative influence on the Aps signal. The resultsofthisstudythusofferasimpleandeffectivework supportforindoorlocalizationatalowercost.
REFERENCES
[1] P. Sirish Kumar and V.B.S. Srilatha Indira Dutt: “The global positioning system: popular accuracy measures, materials today: proceedings,” Volume 33, part7pages4797-48012020.
[2] Yingchun Wang and Yuan Li, “The positioning principle of global positioning system and its application prospects,”IOP Conf. Ser.: Earth Environ 2021.
[3] Nathalie VIGGIANI, “Le rapport indoor generation en pleinelumière,”2018.
[4] Schweizer, Christian & Edwards, Rufus & BayerOglesby,Lucy&Gauderman,William&Ilacqua,Vito& Jantunen, Matti & Lai, Hak-Kan & Nieuwenhuijsen, Mark & Künzli and Nino, “Indoor timemicroenvironment-activity patterns in seven regions of europe,” Journal of exposure science & environmentalepidemiology,2007.
[5] H. Liu, H. Darabi, P. Banerjee, and J. Liu, “Survey of wirelessindoor positioning techniquesandsystems,” IEEETransactionsonSystems,Man,andCybernetics, PartC(ApplicationsandReviews) 2007.
[6] FahadAlhomayaniandMohammadH.Mahoor,“Deep learning methods for fingerprint-based indoor positioning: A review,” journal of location based services,2022.
[7] Shixiong Xia, Yi Liu, Guan Yuan, Mingjun Zhu and Zhaohui Wang, “Indoor fingerprint positioning based
on wi-fi: an overview,” International Journal of GeoInformation,2017.

[8] Pasricha,“ overviewofindoornavigationtechniques,” ResearchGate,2020.
[9] N. Syazwani C.J., Nur Haliza Abdul Wahab, Noorhazirah Sunar, Sharifah H. S. Ariffin, Keng Yinn Wong and Yichiet Aun, “Indoor positioning system: a review,” (IJACSA) International Journal of Advanced Computer Science and Applications, Vol. 13, No. 6, 2022.
[10] Peng Dai,Yuan Yang, ManyiWang,andRuqiangYan, “Combination of DNN and improved KNN for indoor location fingerprinting,” Wireless Communications & MobileComputing,2019.
[11] Huan Dai , Wen-hao Ying and Jiang Xu: “Multi-layer neural network for received signal strength-based indoorlocalisation,”IETCommunications,2016.
[12] Lovon-MelgarejoJ.,Castillo-Cara,Orozco-Barbosaand García-Varea I, “Supervised learning algorithms for indoor localization fingerprinting using BLE4.0 beacons,” In proceedings of the 2017 IEEE Latin American Conference on Computational Intelligence (LA-CCI),Arequipa.
[13] Jongtaek Oh and Jisu Kim,“Adaptative k-nearest neighbor algorithm for wifi fingerprint positioning,” ResearchGate2018.
[14] Gausemer, Pushel, Franckowiak and Habolyan, “ImprovedRSSI based euclidean distance positioning algorithm of large and dynamic WLAN environnemnt,” International Journal Of Computing 2010.
[15] Rong Zhou Yexi Yang and Puchun Chen “An RSS Transform Based WKNN for Indoor Positioning,” Sensors2021.
[16] Wen Liu, Xiao Fu, Zhongliang Deng, Lianming Xu, Jichao Jiao, “Smallest enclosing circle-based fingerprint clustering and Modified-WKNN matching algorithm for indoor positioning,” School of ElectronicEngineeringBeijingUniversityofPostsand Telecommunications,2016.
[17] Garcia-Villalonga, Sergio and Pérez-Navarro, “Influence of human absorption of wi-fi signal in indoor positioning with wi-fi fingerprinting,” IEEE Xplore,2015.
[18] Kamol Kaemarungsi and Prashant Krishnamurthy, “Properties of indoor received signal strengh for WLAN location fingerprinting,” Telecommunications Program, School of Information Sciences, University ofPittsburgh.ResearchGate,2004.
[19] Xiao-min Yu, Hui-qiang Wang and Jin-qiu Wu, “A method of fingerprint indoor localization based on received signal strength difference by using
compressive sensing,” EURASIP Journal on Wireless CommunicationsandNetworking2020.
[20] Prince Chigozie Iwuji1 and Donatus Enang Bassey, “Investigation of the effect of atmospheric temperature on signal strength generated by FM transmitter in Imo state, Nigeria,” International Journal of Science and Research (IJSR) ISSN (Online): 2319-7064IndexCopernicusValue,2016.
[21] Jari Luomala and Ismo Hakala, “Effects of temperatureandhumidityonradiosignalstrengthin outdoor wireless sensor networks,” University of Jyvaskyla,Kokkola.UniversityConsortiumChydenius, Proceedings of the Federated Conference on ComputerScienceandInformationSystems2015.
[22] Tahat Ashraf, Kaddoum Georges, Yousefi Siamak, ValaeeShahrokh andGagnonFrançois,“A lookatthe recent wireless positioning techniques with a focus on algorithms for moving receivers,” IEEE Xplore, 2016.
[23] DuJ.,Yuan,C.,Yue,M.andMaT.,“Anovellocalization algorithm based on RSSI and multilateration for indoorenvironments,”Electronics2022.

[24] Nelson Shawa, Tarek El Saltib, Joseph Chun-Chung Cheungc and Ed Sykesb, “A new set of wi-fi dynamic line-based localization algorithms for indoor environments,”The18thInternationalConferenceon Mobile Systems and Pervasive Computing (MobiSPC) August9-12-2021.
[25] Apidet Booranawong, Peeradon Thammachote, Yoschanin Sasiwat, Jutamanee Auysakul, Kiattisak Sengchuai, Dujdow Buranapanichkit, Sawit Tanthanuch, Nattha Jindapetch and Hiroshi Saito, “Real-time tracking of a moving target in an indoor corridor of the hospital building using RSSI signals received from two reference nodes,” Medical and BiologicalEngineeringandComputing,2022
