International Research Journal of Engineering and Technology (IRJET)


International Research Journal of Engineering and Technology (IRJET)

1Assistant Professor for the CSE Department, ACE Engineering College, Hyderabad
2 Research Scholar for Jamia Millia Islamia Central University, New Delhi
3Assistant Professor for the CSE Department, ACE Engineering College, Hyderabad ***
Abstract: - Electroencephalography (EEG) is a noninvasive technique used to measure and record the electrical activity of the brain. It plays a crucial role in various medical and research applications, including brain-computer interfaces, neurological disorder diagnosis, and cognitive state monitoring. In recent years, deep learning has emerged as a powerful tool for extracting meaningful patterns from EEG signals, leading to significant advancements in EEG signal classification tasks. This research focuses on the application of deep neural networks (DNNs) for EEG signal classification. The primary objective is to develop a robust and accurate classification model capable of identifying distinct brain states or patterns associated with specific mental activities or neurological conditions. To achieve this, we propose a multi-layered deep neural network architecture, leveraging convolutional layers to automatically learn spatial features and recurrent layers to capture temporal dependencies in the EEG data. Neural networks find utility in a several uses because the combination of classification being available in deep learning approaches. This study employs SVM to categorize EEG signals. recording of the brain's electricalimpulsesknownasanelectroencephalogram (EEG)canbeusedtodiagnosemanymedicaldisorders. Parts of the brain are affected by partial epilepsy, and the EEG recorded from those areas is known as FocalEEG, whereas the EEG recorded from another area is referred to along with Non-Focal EEG. When a patient has drug-resistant epilepsy, the Focal EEG identification helps the doctors locate the epileptogenic focus and, as a result, recommend surgical removal of those brain regions. In this, we have suggested a methodology for categorizing nonfocalandfocalEEG.Recentyearshaveseenagrowthin theutilization of a brain-computer interface has made it potential to investigate the brain's control mechanism using EEG signal. An effective focus based on a classification technique Recurrence plot CNN are suggested the address to issue of EEG signal categorization. To increase the signal intensity during the workout interval, EEG signals are first pre-
processed. To build the feature mode of recurrence plot, Features in the time- and frequency-domains are extracted,respectively.
Keyword: EEG, Recurrence Plot, Support Vector Machine(SVM),NeuralNetwork(NN).
EEGsignal whichisused to detect brainrelateddisease.A cheapinstrumentforanalyzingthe brainactivitycaptured with some electrodes on the scalp is the EEG signal. Neurology specialists examine the signal visually to ascertain the beginning of epilepsy. Nonetheless, properly analyzing EEG signals is laborious, time - consuming, frequentlyresultsinincorrectalarmsdetectionofepilepsy. To overcome the problem, epilepsy can be automatically detected using EEG signals considered. In cases of conditions,apersonwithepilepsymayexperiencesudden seizures that cause his muscles to twitch and even cause him to lose consciousness. EEG is a monitoring of "electrical"activity in the brain made from the scalp. The frequencies that were captured demonstrate the "electrical"behaviorofthebrain.
A person with epilepsy suffers from sudden seizures that causeconvulsionsintheirmusclesand,insomecases,even cause them to lose consciousness. 50 million individuals worldwide,or1%ofthepopulation,sufferfromepilepsy.A person with this disease is not well regarded in society, eventothepointwheremarriagesareforbidden.Although thesicknessitselfdoesnot causea harmful state,a loss of consciousnesscanbehazardousifthepersonisdrivingor swimming.
The electroencephalogram (EEG) is frequently used to examine different aspects of brain function. One such condition where EEG is used for clinical analysis is epilepsy.Someepilepticsdeveloptreatmentresistanceand require surgical excision of the brain regions responsible for the condition to regain health. The epileptogenic foci arethoseareasofthebrainthatresultinepilepticseizures. The frequency of these operations has successfully
eliminated or greatly decreased the incidence of epileptic seizuresinthepatients.Thepreciselocationofthearea of the brain that is causing the epileptic seizures must thereforebedetermined.
Currently, the physician uses a clinical method that is subjective to manually locate the epileptogenic foci. This form of medication is used to manage partial epilepsy, oftenknownaspartialseizures.Whenonlyasmallportion ofthebrainisafflictedby epilepsy whereastherestof the nervous system is working normally, partial seizures take place. In this case, the term "focal EEG" refers to the EEG thatiscapturedfromtheregionsofthebrainin whichthe initial "ictal EEG"abnormalities are identified. “Non-focal EEG”, on the other hand, is an EEG that is captured from brainregionsthatwasnotactivewhenseizurefirststarted. AnEEGisprimarilyusedtoidentifyandresearchepilepsy, a disorder that results in recurrent seizures. An EEG will assist your doctor in determining what kind of epilepsy you have, any potential causes of your seizures, and the bestcourseoftreatmentforyou.

sequences are to one another. European distance, Manhattan distance, DTW, etc., are examples of common measurement techniques. These conventional similarity measurement techniquesstruggletodemonstratethebest identificationperformancewhentheSNRislowbecauseof the significant noise interference and mismatched feature lengths.
To deal with the problem of reliable matches of complicated sequences with various length, an RP approach is put forth RP, a “nonlinear dynamic analysis method”, may reflect the characteristic architecture, matching criteria of time - series data. It can offer information and predictability based on past assumptions anddisclosetheinternalstructureoftimeseries.Sincethe EEG signal is a time -series signal, better study may be doneusing recursive graphs.Using the function below, we transform to the recurrence plotting model for simple viewingoftheEEGdataanalyzed:
Five people with temporal lobe epilepsy were used to collecttheEEGdata.Theacquisitionissamplingat512Hz. 7500 focal and non-focal EEG signal pairings are included in the dataset. There are 10, 240 samples per signal. The first50pairingsofdatawereusedinthisworktoevaluate the algorithm. We merged that combinations of Focal and Nonfocal signalsproducethe101signalsin both group the“FocalandNonfocal”groups.Thatsignalcombinations between the “focal and non-focal” sites serve as an illustration.
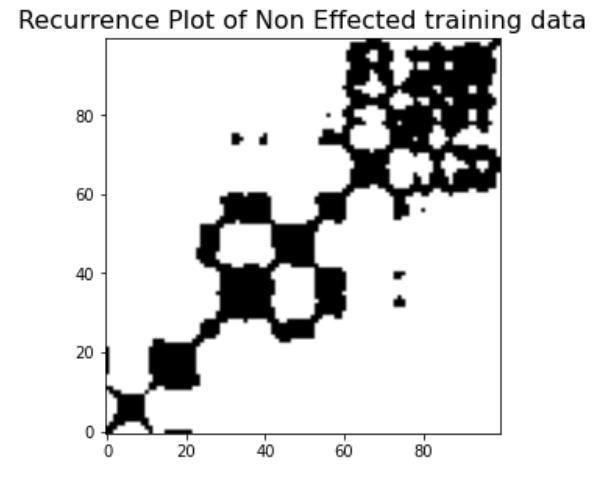
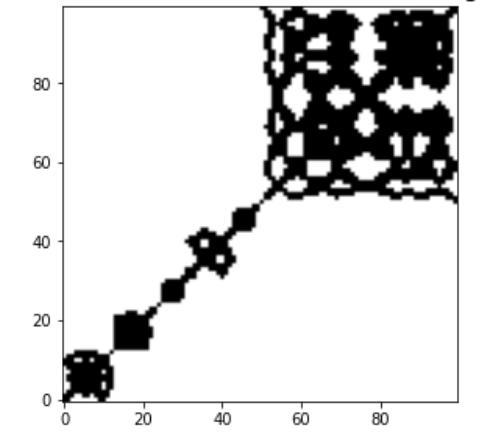
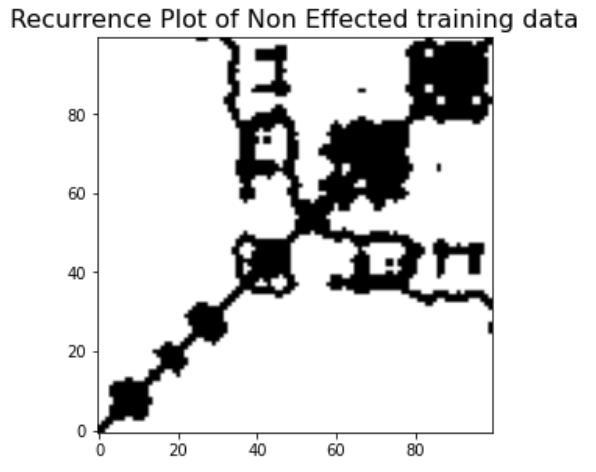
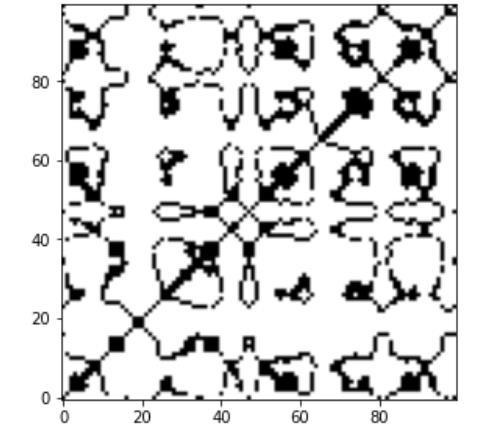
Convertthedatainrow-by-rowformandafterthatconvert thedataintoimageusingrecurrenceplot.
Asophisticated wayfor analyzing irregular data isthe use of RP. It is a representation (or graphs) of a matrix form, where the matrix's components stand in for a dynamics program's states' recurrence intervals. Literally, the RP denotes all occurrences in which the “phase space trajectoryofthedynamical system” passesovernearlythe sameregionofthedimensionalspace.
We must employ the similarity distance measuring approach in order to gauge how similar the signal
where M = number of states seen during feature training, ||.|| = Euclidean norm, ��(����) = “value of the feature sequence observed at the point of the ik sequence and is thecrucialgap.
��(����,����)=1,if the value of an n-dimensional feature sequencesis so very close to where the ���� and ����patterns are spatially located; else, 0 is displayed. Black and white dotsareusedintheRPimagetorepresentthegraph'stime series.
D.Convolutionalneuralnetwork:
The convolutional layer, which makes up the majority of thecomputationinaCNN,isitscoreaspect.Inputs,afilter, and a set of points are among the things it requires. Make the assumption is the inputs consist of a color photo with 3-D pixels. It follows the inputs will have aspects- width, height, depth which are comparable to RGB in a picture. The featuresdetector is also called kernels or filters. Convolutiondescribesthisprocess.
A section of the image is represented by a 2-Darray of weight acting as the featuresdetector. Normally a 3x3 matrix,theinputsizealsoreferstothesizeofthereceptive field but can differ in size. The dot product between it inputfeaturesandthefilteriscalculatedafterthefilterhas been appliedtoa sectionof theimage. Thisdotproduct is
then supplied to the output vector. The filter shifts by a stride and repeats the process when the kernel has gone throughtheentireimage.Thelastofthedotproductsfrom the input and filter is a feature map, activating map, or convolutionlayerfeature.
E.RESNET-50:ResNet-50isthedesignationofaCNNwith 50layers.A pre -trained model ofthe networksthat have beentrainedonmorethananImageNetdatasetispresent intheImageNetdatabase.Anumberofanimals,amouse,a keyboard, and a pen are among the 1000 different object classesthatthe“pre-trainedmodels”networkcanclassify imagesinto.
F. Classification: Algorithms for supervised classification include SVM. If there are more features, there may be an overfittingissuewiththeamountofinputchannelsaswell. This issue in supervised learning will be resolved by regularization in the feature selection process for the classificationmodel.
even when there are many elements and little training data. SVM can provide greater classification accuracy by using factors like output structure and spatial contiguity. For SVM, the boosting, AdaBoost, and Wang's boost algorithms perform well and enable better learning of the unbalanced data. SVM performance can be enhanced by employing O(n3) time complexity improvements. The grouping of observing places, however, are ignored. To create a better ensemble classifier, new drawbacks can be included by selecting a classifier with a sign basis and distance-based features. Multi-criteria inventory problem classification is aided by algorithms that have been increasedandtweakedforSVM.Forlearningandanalyzing imbalance data, SVM serves as a basis classifier. The classifier effectively uses kernel function. Two SVM variants, Wang boosted and modified boosted, are availabletofurtherenhanceSVMperformance.
The experiment is evaluated using a number of metrics including accuracy, confusion matrix, precision, recall, and f1score.
Accuracy-Theratioofthenumberofaccuratepredictions to all the data set's inputs is known as accuracy. It is writtenas:
Accuracy=(TP+TN)/(TP+FP+FN+TN)
TP (True positive): A True Positive isthe outcome where themodelcorrectlypredictsthepositiveclass.
FP(FalsePositive): A False Positive is the outcome where themodelincorrectlypredictsthepositiveclass.
FN (False Negative): And afalse negativeis an outcome wherethemodelincorrectlypredictsthenegativeclass.
TN (True Negative): A true negative is an outcome where themodelcorrectlypredictsthenegativeclass.


SVMClassification:SVMareusedtodataforregressionand classification. It is a supervised learning technique that dataintotwogroups.Therightkernelfunctionselectionis essential for SVM classifier success. There are numerous traditional kernel techniques, including perceptron, linear, RBF, and polynomial. Low universal testing error is produced by the regulation, the kernel parameters (C, c), andtheiroptimalcombination(GTE).SVMperformsbetter
i. Precision: By dividing the genuine positives by any positivepredictions,precisionisdetermined.
Precision = TruePositive (TruePositive + FalsePositive)
ii. Recall: By dividing the real positives by anything else that should have been projected as positive, recall (also knownastheTruePositiveRate)isobtained.

Recall= TruePositive
TruePositive +TalseNegative
iii. F1 score: The F1 score is the harmonic mean of Precision,Recall.Onemightconsiderthetruebenefitsand drawbacksofthis.
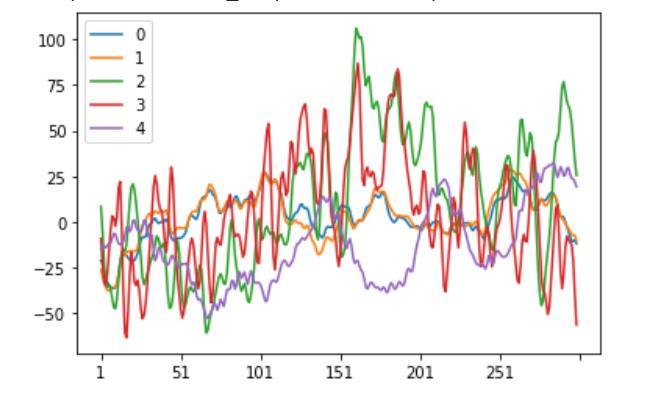
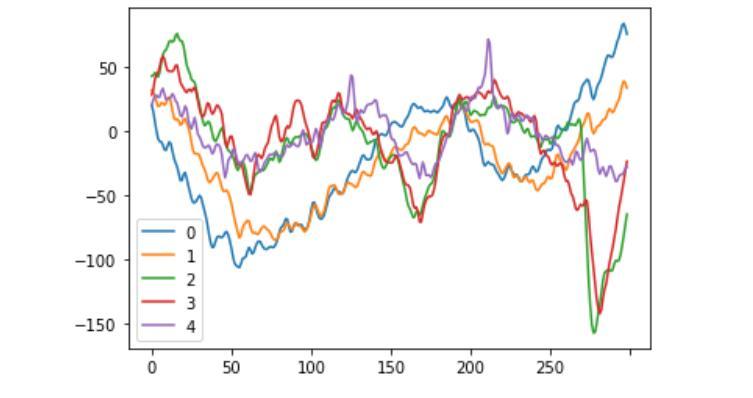
Ihaveplottedthenonfocalsiezuresignalof5people.
B.ImageafterRecurrenceplot
i.Focalpersonimage
iv. Confusion matrix: The prediction results of a classification task are summarized in such a confusion matrix. The confusion matrix shows how your classification method produces guesses even while it is confused.Itprovidesyouwithinformationonthetypes of errors being produced, which is more essential than just the faults your classifier is making. This breakdown gets around the drawback of relying solely on classification accuracy.

A.PlotEEGsignal
i.Focalsignal:
signal
Ihaveplottedthefocalseizureof5people.
ii.Nonfocalsignal:
non-focalsignal
Ihaveconvertedthefocalpersonsignaldataintotheimage form.
ii.Nonfocalpersonimage:
I have converted the non-focal person signal data into the imageform.
iii.ConfusionMatrix:
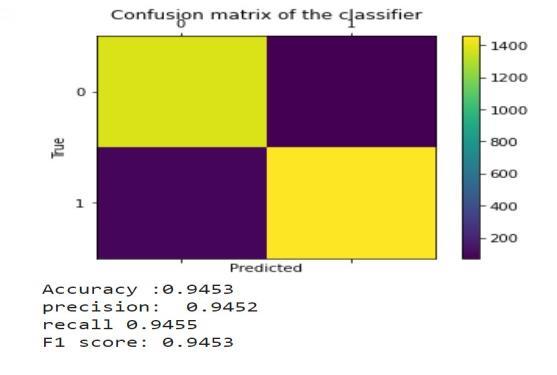
A performance indicator for a deep learning classification taskwheretheoutputcouldincludetwoormoreclassesis the confusion matrix. There are four possible anticipated andactualvaluecombinationsinthetable.
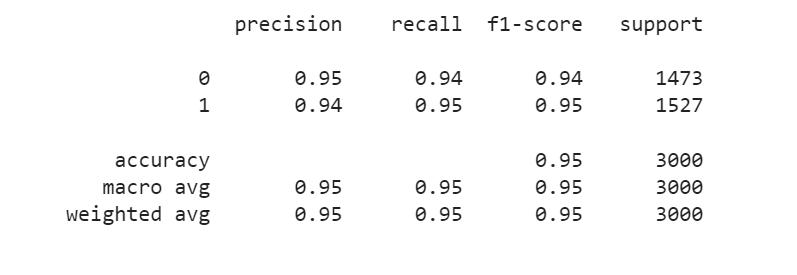
IntheabovefigureshowntheresultofPurposedModel.
SVM(SupportVectorMachine):Itisasupervisedclassifier that creates a high-dimensional hyperplane for dividing thatcanbeusedforclassification.Thehyperplanewiththe greatest distance to the closest data point for training any classachievesadecentseparation.
In the above table gives the accuracy achieved using differentlearningalgorithms.Itcanbeseenfromtheabove table the proposed model outperforms and gives the highest accuracy among all the existing learning algorithms.

In this study, we examined deep learning and machine learning techniques for classifying EEG signals. Python is used to implement traditional SVM and logistic regression methodsinkeras,coupledwithasimpleneuralnetwork,to evaluate performance. For higher performance of 95% percent accuracy in EEG classification, SVM and enhanced NN are recommended. The innovation that assists in obtainingsuperiortheearlylayersoftheupgradedNNuse descent activation function with radial basis function, whichimprovesprecision,accuracy,recalls,andF1scorein contrast to conventional approaches. To evaluate the performance, simulations are run utilizing a range of optimizationmethodsandactivationalgorithms.
ToenhanceclassificationaccuracyofEEGsignals,theCNN approach of Recurrence plot is presented. Feature extraction generates multi-feature fusing networks and a Recurrence plotassessment. Thesuggested procedurecan reliably distinguish Moving left and right, according to experiments.Itcouldthereforebeusedin“brain-computer
interface”technology.Formanyyears,wehavebeentrying to start putting together pathological, clinical aspects of “EEG signal” information. Because it is now insufficient information to conduct research, additional investigations will be conducted using a combination of imaging and pathologicalandclinicalcharacteristics.
[1] Nagabushanam, P., Thomas George, S., & Radha, S. (2020).EEGsignalclassificationusingLSTMandimproved neural network algorithms.Soft Computing,24(13), 998110003.
[2] Sunaryono, D., Sarno, R., & Siswantoro, J. (2021). Gradient boosting machines fusion for automatic epilepsy detection from EEG signals based on wavelet features.Journal of King Saud University-Computer and InformationSciences.
[3] Meng, X., Qiu, S., Wan, S., Cheng, K., & Cui, L. (2021). A motor imagery EEG signal classification algorithm based on recurrence plot convolution neural network.Pattern RecognitionLetters, 146,134-141.
[4] Cordova, F. M., Cifuentes, H. F., Díaz, H. A., Yanine, F., & Pereira, R. (2022). Design of an EEG analytical methodologyfortheanalysisandinterpretationofcerebral connectivity signals.Procedia Computer Science,199, 1401-1408.
[5]Geng,X.,Li,D.,Chen,H.,Yu,P.,Yan,H.,&Yue,M.(2022). An improved feature extraction algorithms of EEG signals based on motor imagery brain-computer interface. AlexandriaEngineeringJournal, 61(6), 48074820.
[6]Bairagi,R.N.,Maniruzzaman,M.,Pervin,S.,&Sarker,A. (2021).EpilepticseizureidentificationinEEGsignalsusing DWT, ANN and sequential window algorithm.Soft ComputingLetters,3,100026.
[7] Sudalaimani, C., Sivakumaran, N., Elizabeth, T. T., & Rominus, V. S. (2019). Automated detection of the preseizure state in EEG signal using neural networks. biocybernetics and biomedical engineering, 39(1),160-175.
[8] Sacca, V., Campolo, M., Mirarchi, D., Gambardella, A., Veltri, P., & Morabito, F. C. (2018). On the classification of EEG signal by using an SVM based algorithm. InMultidisciplinary approaches to neural computing(pp. 271-278).Springer,Cham.
[9] Aboalayon KAI, Faezipour M, Almuhammadi WS, Moslehpour S (2016) Sleep stage classification using EEG signal analysis: a comprehensive survey and new investigation.Entropy18:272.
[10]AcharyaUR,OhSL,HagiwaraY,TanJH,AdeliH,Subha DP (2018) Automated EEG-based screening of depression usingdeepconvolutionalneuralnetwork.ComputMethods ProgramBiomed161:103–113
[11] Afrakhteh S, Mosavi MR, Khishe M, Ayatollahi A (2018) Accurate classification of EEG signals using neural networks trained by hybrid population-physic-based algorithm.IntJAutomComput.
[12] Antoniades A, Spyrou L, Martin-Lopez D, Valentin A, Alarcon G, Sanei S, Took CC (2017) Detection of interictal discharges with convolutional neural networks using discreteorderedmultichannelintracranialEEG.IEEETrans NeuralSystRehabilitEng25(12):1534–4320

[13] Arunkumar N, Mohammed MA, Mostafa SA, Ibrahim DA, Rodrigues JJ, de Albuquerque HCV (2018) Fully automatic model-based segmentation and classification approach for MRI brain tumor using artificial neural networks.ConcurrComputPractExp.
[14] Ieracitano C, Mammone N, Bramanti A, Hussain A, Morabito FC (2018) A convolutional neural network approach for classification of dementia stages based on 2D-spectral representation of EEG recordings. Neurocomputing323:96–107
[15]IturrateI,ChavarriagaR,PereiraM,ZhangH,CorbetT, Leeb R, del Milla´n JR (2018) Human EEG reveals distinct neural correlates of power and precision grasping types. NeuroImage181:635–644