Thin Layer Drying Characteristics of Basil (Ocimum Gratissimum L.) Leaves
Jayeshkumar H. Tarsariya1 , Dr. F.M. Sahu2, Dixitkumar Y. Mistry3 , Viral A. Bhoya4 .1,,4 M.Tech Scholar, Processing & Food Engineering Department, CAET, Navsari Agricultural University, Navsari, Gujarat-396450, India

2Assistant Professor, Centre of Excellence on Post-Harvest Technology, Navsari Agricultural University, Navsari, Gujarat-396450, India.
3Assistant Professor, Agricultural Engineering Department, Parul University, Vadodara, Gujarat-391760, India ***
Abstract Fresh basil leaves were manual nibbing leaves from stem and root, washed, cleaned and 45cm×30cm stainless steel perforated trays size. In this technique, samples were subjected to tray drying at different temperature ranges (45, 50 & 55°C) with different loading density (2.5, 3.0 & 3.5 kg/m2). Based on the result observed, it can be concludedthat, increased in temperature and decreased loading density, which increased drying rate and decreased the drying time. The whole drying took place in falling rate period only, due to uniform moisture diffusion from the basil leaves as where dried with temperature of 50°C for 2.5 kg/m2 loading density as a best treatment combination to produce best quality dehydrated basil leaves. In which the average initial moisture content was found 461.80 (%db) and average final moisture content found 3.88 (%db). Midilli model was found to describe the drying behaviour of basil leaves most precisely (highest R2 = 0.9993; least RMSE = 0.0125). The effective moisture diffusivity values ranges from 5.0 × 10⁻⁹ m2/s to 3.64 × 10⁻⁷ m2/s and activation energy values ranges from 44.98 kJ/mol to 42.63 kJ/mol. The nutritional analysis of the fresh basil leaves in terms of moisture content, protein content, ash content, carbohydrate content and coliform count was found 82.26%, 6.93%, 2.78%, 6.83%, nil (CFU/g) with respectively. The nutritional analysis of the dried basil leaves in terms of protein content, ash content, carbohydrate content, coliform count and rehydration ratio was found 6.73%, 13.20 %, 7.27 %, nil (CFU/g) and 5.89 with respectively. During storage study the sensory evaluation was done in3 months, the highest overall acceptability was founds to be 7.9. The basil leaves dried with temperature of 50°C for 2.5 kg/m2 loading density produce best quality dehydrated basil leaves.
(Key words: Drying kinetics, activation energy, effective moisture diffusivity, drying, moisture ratio, drying time, rehydrationratio,proteincontent,carbohydratecontent,ash content,coliformcount,models,basilleaves,traydryer,
1. INTRODUCTION
Ocimum gratissimum isasmallerectplumbplantwith manybranchesusuallynotmorethan1mto2mhighwitha taprootandmanyadventitioussiderootlets.Theleavesare
6.3 cm to 12.5 cm long, elliptic - lanceolate, acute, coarse lycrenateser- rate,pubescentonsides,glanddotted, base cuneatepetiolesare2.5cmto6.3cmlong,slender,moreor lesspubescent[1].
Drying is one of the oldest methods for agricultural food preservation and it represents a very important aspect in agricultural food processing. The main aim of drying products is to allow longer periods of storage, minimize packagingrequirementsandreduceshippingweights[2].
Thin layer equations describe the drying phenomena in a united way, regardless of the controlling mechanism.Theyhavebeenusedtoestimatedryingtimeof several products and to generalize drying curves. In the development of thin layer drying models for agricultural products,generallythemoisturecontentofthematerialat any time after it has been subjected to a constant relative humidity and temperature conditions is measured and correlatedtothedryingparameters[3-4].
Althoughscentedleavesaredroughttolerance,itis notavailableineverycommunityandscare,mostlyinthe dryseason[5].Thesecandeteriorateveryeasilytherefore drying becomes an option for both storage and transportation. Many drying studies have been done in Ocimum sanctum butfewdryingstudiesareconductedon Ocimum gratissimum. Therefore,thepresentstudyistaken up to obtain the effect of drying temperature on drying characteristics and kinetics of basil leaves of Ocimum gratissimum forvalueadditionwiththefollowingobjectives.
1. Toinvestigatetheinfluenceofdifferentdryingair temperature and tray load on drying kinetics of basilleaves.
2. To evaluate a suitable thin layer drying model to describethedryingbehaviorofbasilleaves.
3. To evaluate the quality characteristics of dehydratedbasilleavesduringstorage.
2. MATERIALS AND METHODS
2.1 Sample Preparation
Washed basil leaves were weighed in digital weighingbalance(Denver,Capacity:610g,leastcount:0.01 g) according to the loadaing density of 2.5, 3.0, 3.5 Kg/m2 andplacedinaperforatedstainlesssteeltraysof0.135m2 areagivingasamplesizeof500geachtreatmentbyusing anothertraysofsamearea.
2.2 Washing
Thefreshbasilleaveswasprocuredfromkitchengardenin Dediapadaandthoroughlycleanedbeforemanualnibbing. The roots and stem were removed and basil leaves were separatedandcleanedincoldwatertoremovesoilanddust particlesifanyattachedtoit.
2.3 Drying in tray dryer
Todeterminethedryingkinetics,basilleavesweredriedon perforated trays in tray dryer (cabinet type, Aksher Electronics,India)at45ºC,50ºCand55±1ºC.Basilleaves were spread uniformly in 45 cm × 30cm stainless steel perforated trays which were placed inside the dryer with threereplication.Thedryingtemperaturerangedfrom4555ºC with an increment of 5 ºC. Weight of samples was recorded with an interval of 5 min for first 30 min of observationandintervalincreasedto15minand30minin laterstagesofdryingtodeterminethemoisturecontentat differentdryingtimes.Thedryingwascarrieduptoasafe moisturelevelof4-6%.
2.4 Moisture content
Moisturecontentoffreshbasilleaveswasdeterminedusing methodasdescribedin[6].
2.5 Drying rate
Thedryingrateduringtheexperimentswascalculatedusing thefollowingformula
Rateofdrying= (1)
Where,
Mt =Moisturecontentatinstantoftime,t.
Mt+dt= Moisture content at time after a successive interval of,dt.
The overall drying rate was calculated as the ratio of differenceofinitialandfinalmoisturecontent(M0−Mf)and totaldryingtime(tT).Theoveralldryingratewascalculated asfollows.
Overalldryingrate= (2)
2.6 Mathematical modeling of drying kinetics
Experimentalmoisturecontentdataofbasil leavesduring traydryingwereconvertedtomoisturerationusingeq(3):

MR= (3)
Where,
MR=themoistureratio(dimensionless)
M0 =theinitialmoisturecontent
Mt =themoisturecontentattimet
Me =theequilibriummoisturecontent
Theeq.(3)canfurthersimplifiedto asthevalues of Me is relatively small compared to M0 and Mt for long dryingtime,hencetheerrorinvolvedinthesimplificationby assumingthatMe isequaltozeroisnegligible. Allmoisture contentsaredenotedindrybasis(kgwater/kgdrymatter).
Themoistureratiocurvecanbetterexplainthedrying behavior than that of the moisture content curve, as the initialwasoneineachexperimentaldatairrespectiveofthe initialmoisturecontentifvaries.Theexperimentaldataof these moisture ratios versus drying time were fitted to drying models to describe the drying behavior of basil leaves.Thefollowingsemi-empiricalmodelsweretestedto describethedryingbehaviorofbasilleaves.
1).HendersonandPabismodel;
2.7 Effective moisture diffusivity
Fick’s second law of diffusion equation, symbolized as a mass-diffusionequationfordryingofagriculturalproducts inafallingrateperiod,isshowninthefollowingequ.
Byusingappropriateinitialandboundaryconditions,Crank (1975)gavetheanalyticalsolutionsforvariousgeometries andthesolutionforslabobjectwithconstantdiffusivityis givenas:
MR= (9)
Where, Deff is the effective diffusivity (m2/s); L is the thicknessofsamples(m);tisthedryingtime(s)andnisa positiveinteger,theEq.(9)canbesimplifiedbytakingthe firsttermofEq.(9):
2.9 Rehydration ratio
Driedbasilleaveswererehydratedbyimmersingin warm water (about 60ºC) and cooled down up to room temperature.About5gofdriedbasilleavessampleswere observedthatsamplestakealmostequaltime(720minat 2.5kg/m2,780minat3.0kg/m2 and840minat3.5kg/m2 (100ml)dippedinwaterfor20min.andthenitwasfiltered through filter paper. The rehydrated basil leaves samples werethenweighed.Therehydrationratiowascalculatedas follows.[6].
Rehydrationratio= (17)
Eq.(6)isevaluatednumericallyforFouriernumber, F0=Deff ×t/L2,fordiffusionandcanberewrittenas:
Where, =therehydratedweight,g =thedehydratedweight,g
2.10 Statistical analysis of drying kinetics
Thus: (13)
TheeffectivemoisturediffusivitywascalculatedusingEq. (15)as:
Curveexpert(Trialversion1.4)software(Microsoft Corporation, Mississippi, USA) was used to fit the mathematical models to experimental data. Two comparativeindiceswereusedasgoodnessandtoselectthe bestmodelsuchas:(1)CoefficientofDetermination(R2)and (2)theRootMeanSquareError(RMSE).
Theeffectivemoisturediffusivity( )wasestimatedby substitutingthepositivevaluesof( )thandthedryingtime along with the thickness of sample (L) for each corresponding moisture contents under different drying conditions.Theaveragemoisturediffusioncoefficientswere typicallydeterminedbyplottingexperimentaldryingdatain terms of ln(MR) versus drying time (t), because the plot givesastraightlinewithaslopeas
2.8 Activation energy
Simal et al.,(1996)reportedtheeffectivediffusivity canberelatedwithtemperaturebyArrheniusequation: (15)
Where,D0=theconstantinArrheniusequationin (m2/s); Ea = activation energy (kJ/mol); R = universal gas constant (8.314 J/mol.K); and T is the temperature in ºC. Equation(15)canberearrangedintheformof: (16)
Theactivationenergycanbecalculatedbyplottingacurve betweenln(Deff)versus1/(T+273.15).
Theseindicesareasfollows: R
Where,
=experimentalmoistureratioofith data

=predictedmoistureratioofith data
N=numberofobservations
The model is said to be good if R2 value ishigh and RMSE valueislow.
2.11Quality Analysis
For quality analysis after drying and storage studies followingmethodswereadopted.ProteincontentbyLowry’s method (1951); Total Ash Content, Total Carbohydrate Content, Microbiological parameter – Coliform count (CFU/g)andSensoryevaluationby[6].
3. RESULTS AND DISCUSSION
3.1 Effect on moisture content
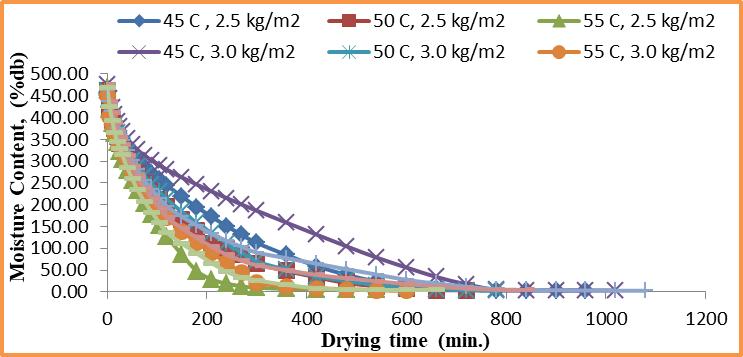
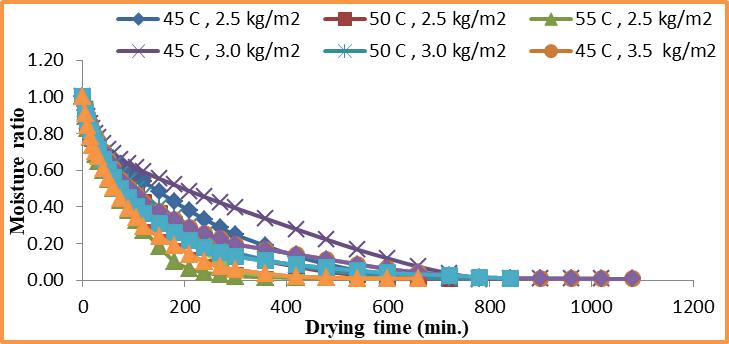
Thedryingtimerangedfrom540min,(2.5kg/m2 andat temperature of 55 °C) to 1080 min, (3.5 kg/m2 and at temperature of 45 °C), being generally lower at higher drying temperatures. It was observed that drying time increaseswithloadingdensityataparticulartemperature (960minat2.5kg/m2,1020minat3.0kg/m2and1080min at3.5kg/m2 for45°Cinsamples).Again,itwasfor50°Cin samples).Thefinalmoisturecontentvariedfrom4to6(% db).
3.2 Effect on drying time
FromtheFig.1itcanbeseenthattheminimumvalue for dryingtimewasnotedtobe540minutesforthetreatment T3.Themaximumvalueofdryingtimewasnotedtobe1080 minutesforthetreatmentT7. Thisresultindicatedthatthe decrease in drying rate with drying time was remarkable duringtheperiodoftraydryingandthenslowlydecreased with time. Effectively the drying rate of basil leaves decreased considerably by tray drying during first five minutes.
3.4 Validation of semi-empirical mathematical models for drying kinetics.

Drying curves of moisture ratio vs. drying time reflectingdifferenttemperaturelevelsfor2.5kg/m2loading density theeffectoftemperatureandsamplethicknessareshownin Fig.5.Fromthefiguresitcanbeseenthatdryingtimewas inverselyproportionaltotemperatureandloadingdensity.
Themoistureratiovs.dryingtimecurvecanbetterexplaina dryingbehaviourthanmoisturecontentvs.drying
Chart.
3.3 Effect on drying rate
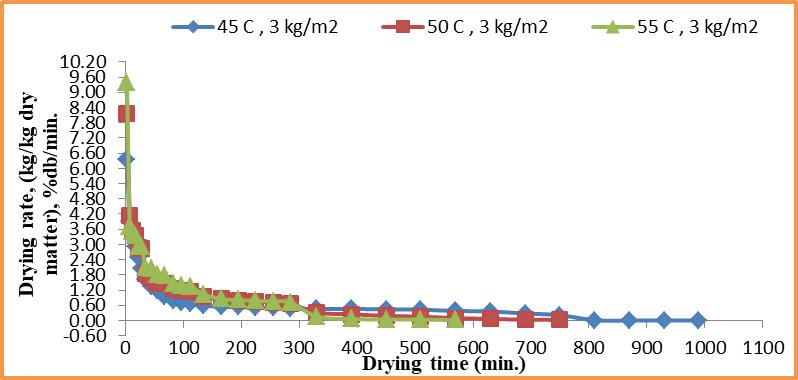
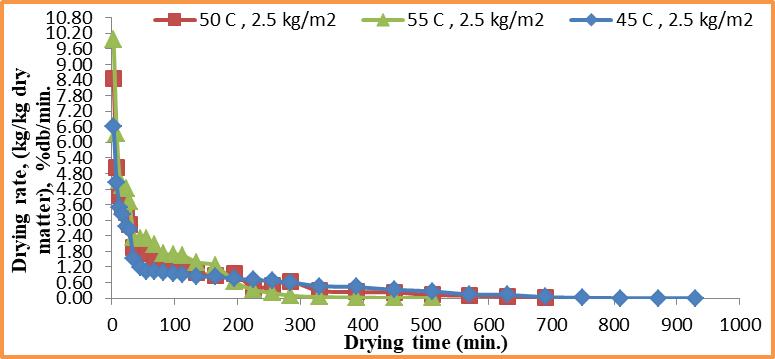
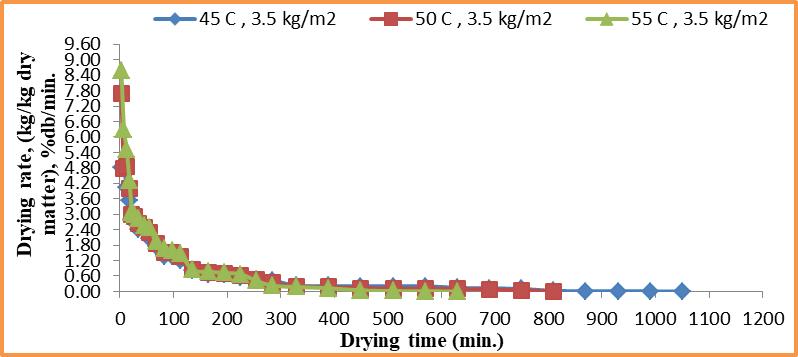
Therelationshipsbetweendryingrateandmoisture content(%db)withtherespectivedryingtemperaturesand loadingdensitiesareshowninchart2to4.Fromtheprocess tooklongertimeascomparetootherdryingtemperature.At temperature(45ºC)increasedandloadingdensity(2.5,3.0 and3.5kg/m2)resultedindecreaseddryingrates0.470(% db/min.), 0.461 (% db/min.) and 0.424 (% db/min.), respectively.Attemperature(50ºC)increasedandloading density(2.5,3.0and3.5kg/m2)resultedindecreaseddrying rateof0.636(%db/min.),0.589(%db/min.)and0.559(% db/min.),respectively.Attemperature(55ºC)andloading density (2.5, 3.0 and 3.5 kg/m2) the drying rate was decreased0.858(%db/min.),0.744(%db/min.)and0.702 (%db/min.),respectively.
Chart. 2 Variationofdryingratewithdryingtimeat differenttemperaturelevelsfor2.5kg/m2loadingdensity Variationofdryingratewithdryingtimeattimecurveas the initial value was one in each experimental data irrespectiveoftheinitialmoisturecontent.Todescribethe effectoftemperatureandloadingdensityondryingkinetics ofbasilleaves,foursemi-empiricalthinlayerdryingmodels such as Henderson and Pabis model, Logarithmic model, Page’s model and Midilli model were used. The moisture ratio and drying time data were fitted to this four drying models.
Allfourmodelswereadequatetodescribethethinlayer dryingcharacteristicsofbasilleavessincethatthehighest valueofR2andthelowestvalueofRMSEwereobtainedwith Midillimodelforallthetreatmentsofdrying treatmentsof drying experiment. All four models were adequate to describethetraydryingcharacteristicsofbasilleavessince lowestR2 valueandhighestRMSEwere foundtobe0.9993 and0.0125respectively,(treatmentT2,midillimodel)thatis adequacyofR2>90%isfulfilledbyallmodels.
Chart. 3 Variationofdryingratewithdryingtimeat differenttemperaturelevelsfor3.0kg/m2loadingdensity
The experimental moisture ratio and predicted moisture ratio vs. drying time curve fitting for treatment T2 in differentmodelsareshowninChart6toChart9.
The highest value of R2 (0.9993) and lowest value of RMSE(0.0125)observedfortreatmentT2withMidillimodel. Therefore,itcouldbeconcludedthatthoughallfourmodels suitably describe the drying behaviour of basil leaves but basedonthehighestR2valueandlowestRMSEvalue,Midilli modelwasselectedasthebestmodelforpredictionofthe drying kineticofbasilleaves.
The effective moisture diffusivity increased with increaseintemperatureandloadingdensity.However,the moisture diffusivity further was higher at any level of moisturecontentathighertemperaturelevel,resultinginto shorterdryingtime.

3.5Effect
Variationineffectivemoisturediffusivityofbasilleaves withmoisturecontentatdifferenttemperatureandloading density is shown in Table 1. Effective moisture diffusivity valuesofbasilleavesundervariousdryingconditionswere estimated in the range of 5.0×10⁻⁹ to 3.64×10⁻⁷ m2/s. The lowestvalueofeffectivemoisturediffusivitywasobservedin treatmentT2 (5.0×10⁻⁹ m2/s),followedbythetreatmentof T1 (3.75×10⁻⁹m2/s).
3.6Effect on activation energy
Variationinactivationenergyofbasilleaveswith moisturecontentatdifferenttemperatureandloading densityisshowninTable1.Thehighestactivationenergy
whichwasminimum.Similardecreasingtrendwasobserved atallthelevelsofstoragedurations.
3.8Effect of temperature (T) and loading density (L) on carbohydrate content
The data recorded on carbohydrate content as influenced by tray drying treatments was graphically illustratedinChart.11Carbohydratecontent(%)levelsof driedbasilleavesshowedincreasingtrendwithdecreasing temperatureandloadingdensity.Thedecreasingtrendalso foundduringstorageperiodof3months.Initially(0months) themaximumcarbohydratecontent(7.32%)wasrecorded inT2 treatmentandwasatparwithT3 (7.31%).However, the carbohydrate content (7.19%) was recorded in treatmentT9,whichminimum.Similardecreasingtrendwas alsoobservedatallthelevelsofstoragedurations.
wasobservedunderthetreatmentT6wasnotedtobe44.71 kJ/mol, followed by the treatment of T2 with activation energy of 43.98 kJ/mol. The lowest value of activation energyamongthetreatmentswasnotedtobe42.63kJ/mol forthetreatmentT5

3.7 Effect of temperature (T) and loading density (L) on protein content
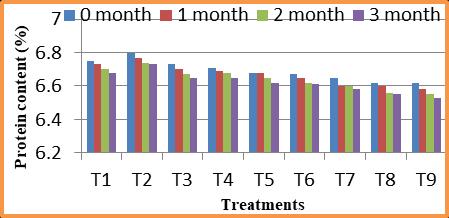
Thedatarecordedonproteincontentasinfluencedby traydryingtreatmentswasgraphicallyillustratedinChart. 10.Thedatapertainingtoproteincontent%levelsofdried basil leaves showed decreasing trend with increasing temperatureandloadingdensity.Thedecreasingtrendalso foundduringstorageperiodof3months.Initially(0months) themaximumproteincontent(6.80%)wasrecordedinT2 treatment and was at par with T1 (6.75%). However, the protein content (6.61%) was recorded in treatment T9,
Chart. 12 Effectoftemperatureandloadingdensityon ashcontent(%)ofdehydratedbasilleavesduringstorage
3.9
Thedatarecordedonashcontentasinfluencedbytray dryingtreatmentswasgraphicallyillustratedinChart.12. Ash content (%) levels of dried basil leaves showed increasing trend with increasing temperature and loading density.Initiallythemaximumashcontent(13.86%)found inT4whichwasatparwithtreatmentT3(13.76%).However, the lowest ash content was recorded in treatment T7 (13.01%).
3.10 Effect of temperature (T) and loading density (L) on coliform count (CFU/g)
The dehydrated sample obtained by different loading density of 2.5, 3.0 and 3.5 kg/m2 at different temperatures.Itisclearthatloadingdensityanddifferent temperaturedidnotaffectmuchtoocoliformcount(CFU/g).
3.11 Effect of temperature (T) and loading density (L) on
Thedatarecordedonrehydrationratioasinfluenced by tray drying treatments was graphically illustrated in Chart.13.Thedatapertainingtorehydrationratioofdried basil leaves showed an increasing trend with increasing temperatureandloadingdensity.Butitshowedadecreasing trendduringstorageperiod.Initially(0months)maximum rehydrationratiowasrecordedinT2(6.21)treatmentwhich wasfollowedbyT6(6.02).However,thelowestrehydration ratiowasrecordedintreatmentT5(5.45).Similardecreasing trendwasobservedatallthelevelsofstorageintervals.
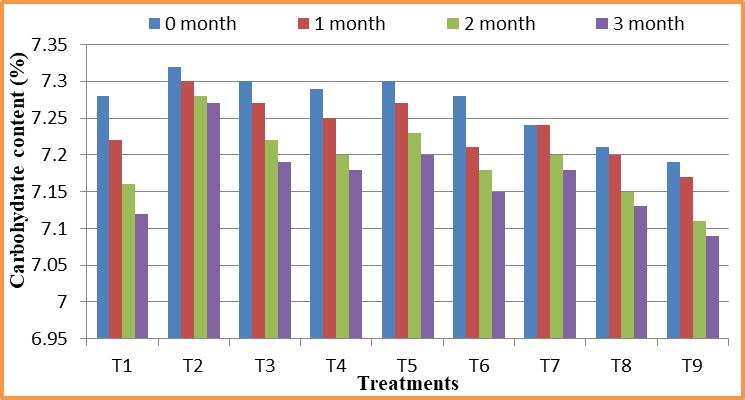
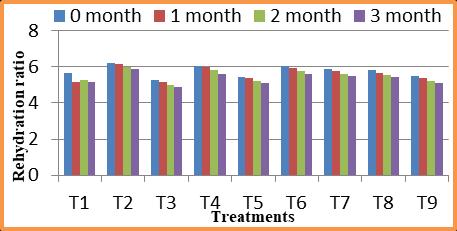
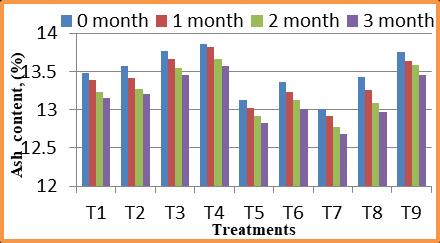
Chart. 13 Effectoftemperatureandloadingdensityon rehydrationratioofdehydratedbasilleavesduring storage
3.12 Organoleptic quality
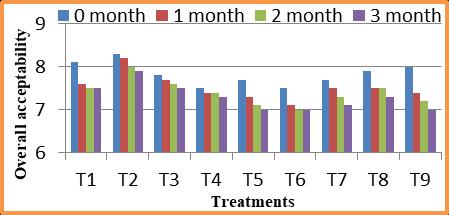
Organoleptic quality like colour, taste, flavour and overall acceptability of dehydrated as well as rehydrated basilleaves,wasevaluatedbypanelofjudgesduring1to3 months of storage at 1 months interval during the experiment.Theoverallacceptabilityscore(outof9points) ofdehydratedaswellasrehydratedbasilleavesfoundbest oncolour,tasteandflavourbyvarioustreatmentsduringthe storageperiodarefurnishedindepictedinChart.14.Panels ofjudgespreferredthecolour,tasteandflavourscore(7.9) ofdehydratedaswellasrehydratedbasilleavesintreatment T2.

Chart. 14 Effectoftemperatureandloadingdensityon overallacceptabilityofdehydratedbasilleavesduring storage
4. CONCLUSION
On the basis of experimental results and data analysis followingconclusioncouldbedrawn.
1. As the temperature increased and decreased loading density, increased the drying rate and decreasedthedryingtime.
2. The whole drying process fresh basil leaves took place in falling rate period only and the average dryingrateincreasedwithincreasedtemperature andloadingdensity.
3. Midillimodelwasfoundbestfitteddryingmodelto describethedryingbehavioursofbasilleavesmost preciselyasR2valuewashighest(0.9993)aswellas leastRMSE(0.0125)ascompared tootherdrying models.
4. Effectivediffusivity(5.0×10⁻⁹ m2/sto3.64×10-7 m2/s) increased with increasing temperature and loading density while activation energy (44.71 kJ/molto42.63kJ/mol)decreasedwithincreasing temperatureandloadingdensity.
5. Product quality in term of protein content, carbohydrate content, ash content and coliform countwasfoundtobeacceptableinalltraydrying inwhichT2treatmentat50°Candloadingdensityat 2.5kg/m2wasfoundsbetterresultssuchas6.73%, 7.27%,13.20%andNilat3monthsstorageperiods.
6. Basilleavesdriedwithattemperatureof50°Cfor 2.5 kg/m2 loading density produce best quality dehydrated basil leaves. The highest overall acceptabilitywasfoundstobe7.9.
ACKNOWLEDGMENT
The authors are thankful to the Navsari Agricultural University,Navsari,Gujarat,Indiaforprovidingallnecessary facilities.
REFERENCES
[1] Kadam,D.M.,Goyal,R.K.,andGupta,M.K.(2011), Mathematical modeling of convective thin layer drying of basil leaves. Journal of Medicinal Plants Research, 5(19):4721-4730.
[2] Ertekin,C.andYaldiz,O.(2004),Dryingofeggplant andselectionofasuitablethinlayerdryingmodels. J. Food Eng.,63:349-359.
[3] Midilli, A., Kucuk, H., and Yapar, Z. (2002), A new modelforsinglelayerdrying. Drying Technol., 20(7): 1503-1513.
[4] Togrul,I.T.,andPehlivan,D.(2002),Mathematical modellingofsolardryingofapricotsinthinlayers. J. Food Eng., 55:209-216.

[5] AOAC, (1990), Official methods of Analysis. Association of Official Analytical Chemist, Washington,DC,USA.
[6] Ranganna, S. B. (2001), Handbook of Analysis and Quality Control for Fruit and Vegetable Products. Tata McGraw-Hill Education Private limited, New Delhi.
BIOGRAPHIES
Mr. Jayeshkumar H. Tarsariya, He has receivedhisB.Tech(Agril.Engg.)FromCollege of Agricultural Engineering & Technology, Navsari, Gujarat in 2017 and M. Tech (Processing and Food Engineering) from Navsari Agricultural University in 2019. CurrentlyWorkingR&D,QA&QCOfficer(Tapi FruitProcessingLimited,Pipodara,Surat).He has published 1 research papers in national journalandconferencesandpresentedposters and got laurel. He has an experience of Document control for ISO 22000: 2018 and Qualitymanagement,InProcess,FinalProduct TestingandMicrotesting,ProductionPlanning, Incoming Raw materials, Ingredients and packagingmaterialinspection,CompleteMass Balance and Product Traceability, Lead to performHACCPfacilityactivitycoordinationon a regular basis, Internal Auditor and GMP Report, New Product Development, Housekeeping team leader, FSMS team member.FSSAIrulesandregulations.


