Comparative study of traffic signals with and without signal coordination of various intersection
Virangana Humne1 , Aditya Pathare21Research Scholar, School of Engineering & Technology Saikheda, 480337, Madhya Pradesh, India

2Assistant Professor, Department of Civil Engineering, G H Raisoni University, Saikheda, Madhya Pradesh, India
Abstract - This study focuses on quantifying the congestion at intersection. For obtained congestionthis studyupdates the signal timing in order to exalt the intersection capacity, abate delays and enhance comprehensive efficiency of traffic. As signal coordination is the most effective method to pass maximum number of vehicles from any route. The previous signal coordination was done by thumb rule or theoretical manner. For more realistic performance of traffic signals microscopic, time and behavior-basedsoftware shouldbe used to coordinate the signals.
Key Words: SignalOptimization,bandwidth,TRANSYT7F, VISSIMSCAPI
1.INTRODUCTION
Mobility of people and goods from their point of origin to theirpointofdestinationiswhatismeantbytransportation. Duetothemassive populationexpansionincitiesandthe riseinautomobileownership,urbanmobilityisbecoming morecomplicatedeveryday.Increasedvehiculardensityon urbanroadsnecessitateseffectivetrafficcontrolmeasures, especiallyatintersectionswhereheterogeneityandturning movements lead to problems with time pollution, traffic jams,mobilitydelays,andenvironmentalpollution,among other things, when operating and maintaining each individualvehicle'scostsaretakenintoaccount.Increased fuelconsumptionisaresultofthetimepollutioncausedby the enormous expansion in the number ofvehicles on the road. (1,2)
Signalsareonewayoftrafficregulationprovisionofitdeals withlegwisetrafficmovement.Trafficsignalwithprevailing conditions helps to control the network in practical and economical way. Traffic flow at signalized intersections is filteredbyfixedtimesignalsystem(haltingavehicleduring red phase) leaving delay in travel time. Coordination of signals is the most practical solution to solve all the problems with signalized crossings within an urban road network.Themaingoalofsignalcoordinationistomaximize vehicleflowacrossjunctionsinapredictableamountoftime with a minimum amount of stops and accidents while maintaining a high level of speed. It abates alteration of speedwithfurnishinganunruffledmaneuveringoftraffic, resulting in intensify the capacity, diminution in fuel
consumption along with pollution, this tumbles out comprehensiveoperationandmaintenancecost. (1,2,3)
InIndia,trafficisheterogeneousformandduringpeakhours approachestointersectionsaredense,soitisherculeanto manurewithnoeffort.AmetropolitancitylikeMumbaihas many heavy traffic corridors leaving dilemma during maneuvering. The local administration and government body had made efforts to mitigate the congestion by enhancing urban transport system. The base line of this study is to linking of signals with abating travel time, to quantifythedelayaswellasfuelconsumptionwithrespect tothevolume.Extensiveresearchworkhadbeencarriedout to quantify the congestion at intersection for obtained congestionthisstudyupdatesthesignaltiminginorderto exalt the intersection capacity, abate delays, enhance comprehensiveefficiencyoftraffic. (3)
2. LITERATURE REVIEW
Arash M. Roshandeh, (2014), proposed a strategy for minimizingoverallvehicleandpedestriandelayseachcycle byadjustinggreensplitsforeachsignalisedintersectionin theurbanstreetnetworkwithoutalteringthecurrentcycle lengthandsignalcoordination. (4)
ZichuanLi(2011),hadworkedonModellingArterialSignal optimisation and provided an arterial signal optimisation model that could take junction lane group queue blockage into account when conditions were oversaturated. The suggestedmodelusesthecelltransmissionideatocapture trafficdynamics. (5)
Diao Pengdi, (2012), Considered to be the bottleneck for transportationcapacity,intersectionsarealsofrequentlythe sceneofaccidentsandtrafficcongestion.Engineeringstudy on traffic control was heavily focused on the scientific managementandcontroloftheintersection. (6)
Aleksandar Z, (2008had proposed microsimulation techniques that mimic the random character of traffic to model it.Avarietyoftrafficdemandandcontrol scenarios were examined. Their findings demonstrated that when macroscopicallyimprovedsignaltimingswereputthrougha thoroughreviewusingmicrosimulation (7,8)
XianfengYang,(2014),studiedthetheoryofintervalanalysis and developed a set of demand intervals to depict the variations in demand. An optimisation approach based on demandintervalpatternswassuggested. (9)
MahmoodMahmoodiNesheli,(2009),thisstudyestablishes the traffic signal coordination layout for four adjacent crossings that are separated by 780 meters. Using a video camera, data on vehicle movement was gathered during morningandeveningrushhourswhentrafficwasheavy.An evaluationsimulationmodelcalledTRANSYT7Fwasusedto assessthepotentialcoordinationofsignalizedjunctions.The findingsdemonstratethataftercoordination,delays,travel times,andqueuesarereduced. (10)
RuiYue,GuangchuanYang(2022),Anellipticalapproachis presentedinthisstudytobalancethecontroldelaysbetween amajorstreetandaminorstreet.Theprocessistousetheeservice strategy in the small street's signal controller in additiontooptimizingthebigstreet'ssplits.Resultsindicate that the coordination effect on the major street may be obtainedandprotectedwithanacceptabledelaytosmaller streettrafficwhenadequatesplitsareused. (11)
JiaoYao,QingyunTang(2021),Thetraditionalfundamental green wave bandwidth model was adjusted by the researchers in this study so that a separate turning green wave band was made available for the flow of traffic from sub-arterialsmergingintoanarterialandthatthisvariable green wave band could be more adaptable to support the commutingtraffic.Amulti-routesignalcoordinationcontrol model was developed with this as the goal function; this modelisamixedintegerlinearprogrammingproblemwith theoverallidealcoordinationrateofinbound,outbound,and turningmovement. (12)

ChangjiangZheng,GenghuaMa(2012),Inordertoaddress the issue with pedestrian Mid-Block Street Crossings, this article investigates the signal coordination control mechanism between Mid-Block Street Crossing and Intersections.Thestudysuggestsusingthegraph"distanceflowrate-time"asatoolforcreatingacoordinationcontrol systemmodelthatisforvarioustrafficcontrolconditions.(13)
YanLi,LijieYu,SiranTao,andKuanminChen(2013),Amultiobjectivecoordinationapproachfortrafficsignalcontrolis suggested in order to increase the effectiveness of traffic signal management at solitary intersections under oversaturated conditions. The traffic signal control's optimization goals under oversaturated conditions are throughput maximum and minimum average queue ratio. Theconvergenceandoptimizationfindingswereassessedin asimulationenvironmentusingVISSIMSCAPIundervaried trafficcircumstances.Thesimulationresultsshowedthatthe suggestedalgorithm'ssignaltimingschemeisquiteeffective incontrollingtrafficatovercrowdedintersections. (14)
LinDuandYunZhang(2014),Inthisresearch,adissipativebased control technique for online traffic signalization is proposedbytreatingtheintersectionasapositiveswitched system.AnLPproblem-baseddesignapproachisproposed that satisfies the positivity, dissipative, and control requirements.Wenowhaveafreshperspectiveonsimulating junctionsthankstothepositiveswitchedsystemapproach; ourupcomingworkwillinvolvebringingothercutting-edge control schemes from the positive switched system to the intersectionsystem. (15)
Li Wang, Xiao-ming Liu, Zhi-jian Wang (2013), For the purpose of optimising the control structure of the traffic system,thenetworkanalysisapproachwasusedinthesetwo areas. Simulation results demonstrate that the suggested network analysis approach can significantly enhance the effectivenessoftheoperationofthetrafficcontrolsystem.(16)
Xiaojian Hu, Jian Lu (2014), The long green and long red (LGLR) traffic signal coordination approach is the one the studysuggestsforcoordinatinglocaltrafficsignals.Thegoal ofthestrategyistomaximizetheeffectivenessoftrafficflows at signalized intersections in the congested HGRN while controlling the formation and dispersal of lineups. The simulationisruntocomparethemodel'sperformancetothat ofothermodels,anditisclearthattheLGLRmodelperforms betteroverallandintermsofdelay,numberofstops,queue length,andperformanceinthesaturatedHGRN. (17)
3. DESIGN AND IMPLEMENTATION
Speedistheprimefactorforthedesignofanycontrolsystem in transportation as relates to safety, comfort, time, convenience,andeconomy.Itismoreimportanttodetermine the speed distribution of traffic flow maneuvering in a particularstream. The spotspeed study wasperformedto evaluatethepercentilesspeedofvehicles.
ThepercentilespeeddistributionbeforeKalaNagarJunction isshownfollowingfigures.
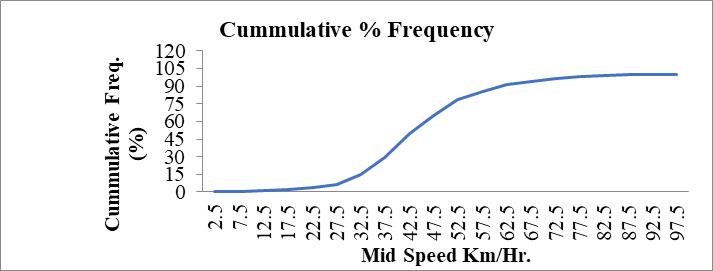
From above relationship the percentile speed and maximumfrequencyisevaluatedasfollows:-
15thPercentilespeed–32.5Km/hr


85thPercentilespeed-57.5Km/hr
MaximumFrequencyofvehicle–19.83%
3.1 Design of signal
All the signals are designed based on field data and using Webster’smethod.Allthesignalsaredesignedasfixedtime signals.Oneofthesupremefactorsfordesignofsignalisto determinethecycletime.
Table 1.SamplecalculationforsignaldesignatKalaNagar Junction:
WestBound EastBound
0.256+0.297=0.553
ThecyclelengthofsignalasperWebster’sFormula:(sec)
L=Totallosttimeineachcycle(sec).
Co=Optimalcyclelength(sec).
Y=Volumetosaturationflowratioforcriticalbound.
Whileconsideringpedestrianflow,andconsideringhigher valuewecanadoptcyclelengthas 76 sec.
Greenphaseateachbound:-
SaturationFlow(s)=525xlanewidth(veh/hr)
SaturationflowatN-Sbound:=4200veh/hr (1)
SaturationflowatE-Wbound:=6300veh/hr (2)
Ratioofvolumetosaturationflowvariousbounds:-
NorthBound
SouthBound
Table 3.Detailsofdesignofsignalsofallsignals:-
2)TimerequiredforVehicleleavingformKalaNagarand arrivesatBharatNagaris T1= =187sec
27-20=7secVehiclesleavingafter7secgetstoppedat Bharat Nagar. So, the residual time added to offset to increasethethroughbandwidth.Thenewoffset=62+7= 69sec.
Vehiclewillenter3secafterstartingofgreentime.
3)TimerequiredforVehicleleavingformKalaNagarand arrivesatDiamondMarketis T2=
3.2 Signal Coordination
Basedonthefieldobserveddataandsignaldesigndetails,the coordination of signals is performed theoretically. Route:FromKalaNagartoMTNLSq.BKC
Consideringaveragespotspeed=42.5kmph Table 4. Phasetime,OffsetandDistances
Vehicles will reach the beginningofgreentimeinnext cycle.
4) Time required for Vehicle leaving form Kala Nagar andarrivesatMTNLsquareBKCis T2=

1) Time required for Vehicle leaving form Kala Nagarand arriveatFamilyCourtSq.is
T0= =135sec
Vehicleswillreachthebeginningofgreentimeinnext cycle.
Vehicles will reach the beginningofgreentimeinnext cycle.
4. RESULTS
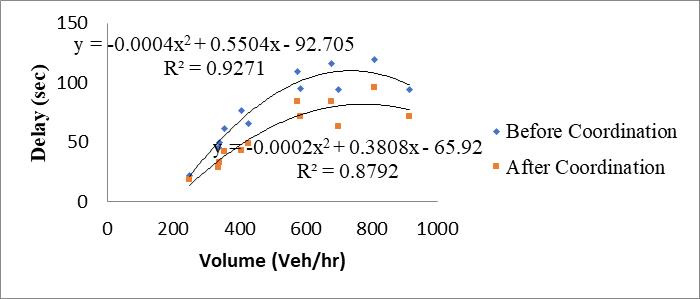
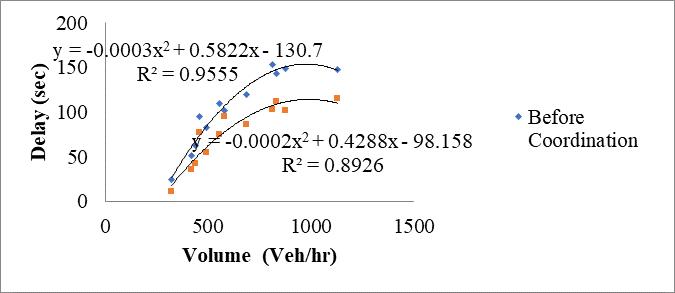
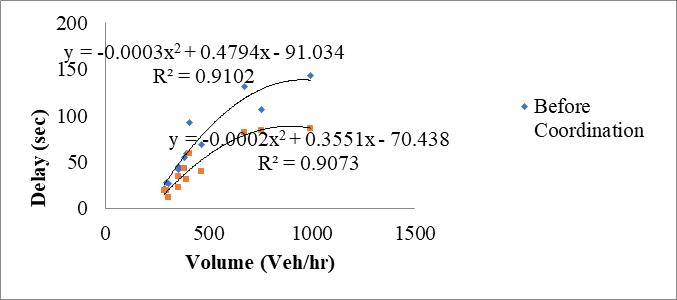
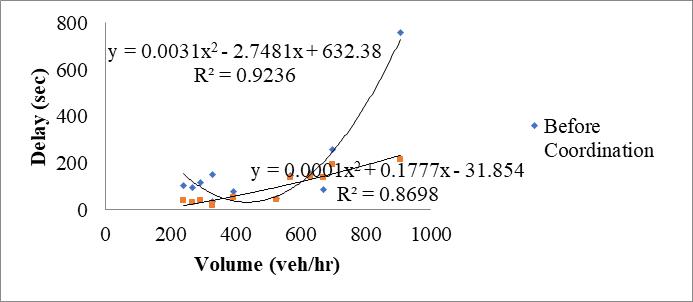
The comparison of various parameters with and without coordination is shown in this chapter. The results are evaluatedafterthesimulationofthenetworkinVissim.
Thegraphicalrepresentationofresultsisshownasfollows.
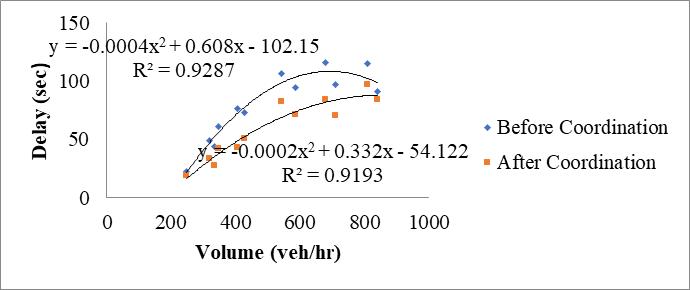
i.Comparisonofdelaybeforeandaftersignalcoordinationat eachsquareisshowninthefollowingchart
4.1

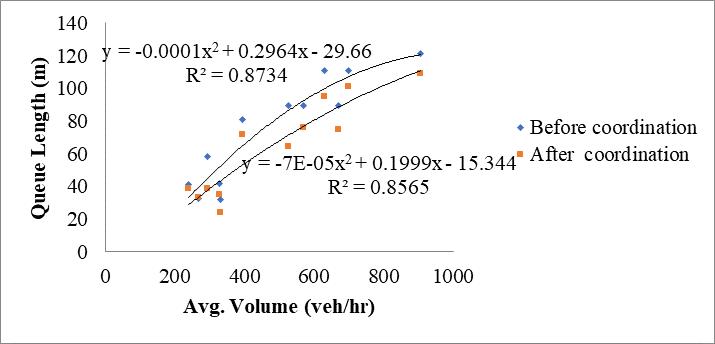
Thequeuelengthisestimatedconsideringtheaverage volumeoftrafficateveryboundateachintersection.
4.2.
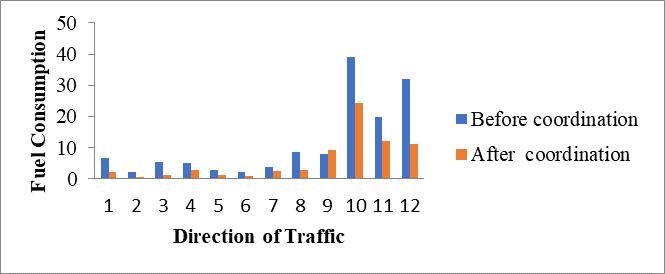
Fuelconsumptionisevaluatedfromdifferentdirectionsof traffic flow. The comparison of average fuel consumption before and after signal coordination is shown in the followingcharts.
4.3 Emissions
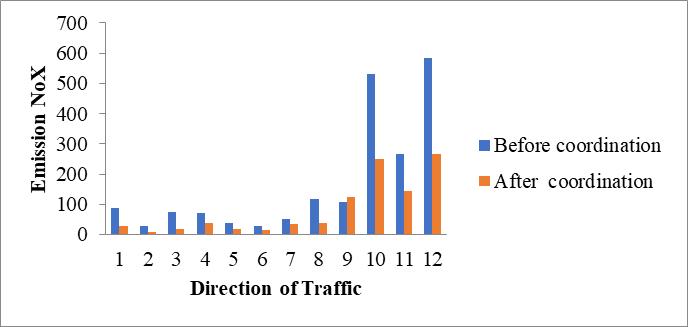
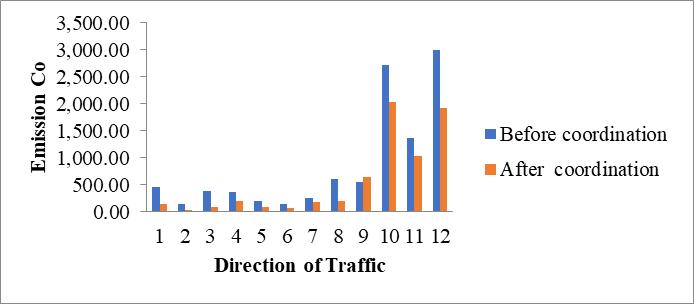
Average emissions of CO and NoX are evaluated from different directions of the traffic flow. The comparison of emissions before and after coordination is shown in the followingchart
Fuelusageisdown27%,andemissionsofNoXand COaredown28%and27%,respectively.Thisisa key element in lowering both environmental pollutionandfuelcosts.
Itcanbededucedfromgraphsoffuelconsumption and emissions that the East-West bound has a greaterimpactthantheSouth-Northbound.
Results in the simulation run demonstrate that signal coordination plays a cardinal role in abating congestion, reductionintraveltime,andfuelconsumption.Routeswith coordinatedsignalschangethespeedofvehicles.
REFERENCES
[1] Kadiyali L. R. (2011). “Traffic Engineering and Transportation Planning.” Khanna Publishers, New Delhi,India.
[2] Ch.Ravi Sekhar et.al, (2013), “Estimation of Delay and Fuel Loss during Idling of Vehicles at Signalised IntersectioninAhmedabad”Elsevier Procedia-Social andBehavioralSciences104(2013)1178–118.
[3] TomV.Mathew,andK. V.Krishna Rao(May8,2008), “IntroductiontoTransportationEngineering”,Chapter 33-TrafficStreamModel,NPTEL.
[4] Arash M. Roshandeh et.al, (2014), “New Methodology for Intersection Signal Timing Optimization to Simultaneously Minimize Vehicle and Pedestrian Delays”JournalofTransportationEngineering,©ASCE, ISSN0733-947X/04014009(10).
[5] Zichuan Li, ASCE (2011), “Modelling Arterial Signal Optimization with Enhanced Cell Transmission Formulations”.JournalofTransportationengg.ASCE,
5. CONCLUSION
Signal coordination is evaluated for all five intersections betweenKalaNagarandMTNLSq.BKCusingasignaltiming approachbasedondataanalysisforselectedroutes.
32%reductioninvehiculardelayisobservedwhen comparing the findings before and after coordination.Thedelayineast-westboundismore ascomparedtoboundsouth-north.
There is a 17% drop in the length of the queue, whichresultsinshortervehicletraveltimes.
Theamountoftimeavehicletakestogoforwardin thequeueiscutby17%.
[6] Diao Pengdi et.al, (2012) “Traffic Signal Coordinated ControlOptimization:ACaseStudy”IEEE,2012.

[7] Aleksandar Z et.al, ASCE (2008) “Assessment of the Suitability of Micro simulation as a Tool for the EvaluationofMacroscopicallyOptimizedTrafficSignal Timings”ASCE J.Transp.Eng.2008.134:59-67.
[8] Aleksandar Stevanovic et.al, ELSEVIER(2015), “Multicriteriaoptimizationoftrafficsignals:Mobility,safety, andenvironment”ELSEVIERTransportationResearch partC55(2015)46-68
[9] XianfengYanget.al,ASCE(2014)“IntervalOptimization for Signal Timings with Time-Dependent Uncertain Arrivals” JournalofComputinginCivilEngineering,© ASCE,ISSN0887-3801/04014057(8)
[10] Mahmood mahmoodi nesheli, othman che puan and arash Moradkhani roshandeh et al, (2009) “ OptimizationofTrafficSignalCoordinationSystemon Congestion:ACaseStudy”.
[11] Rui Yue, Guangchuan Yang (2022), “Effects of ImplementingNightOperationSignalCoordinationon Arterials”.

[12] Jiao Yao, Qingyun Tang (2021), “A Multiroute Signal ControlModelconsideringCoordinationRateofGreen Bandwidth”.
[13] Changjiang Zheng, Genghua Ma (2012), “A Signal Coordination Control Based on Traversing Empty betweenMid-BlockStreetCrossingandIntersection.”
[14] YanLi,LijieYu,SiranTao,andKuanminChen(2013), “Multi-ObjectiveOptimizationofTraffic Signal Timing forOversaturatedIntersection”.
[15] Lin Du and Yun Zhang (2014), “Positive Switched System Approach to Traffic Signal Control for OversaturatedIntersection”.
[16] Li Wang, Xiao-ming Liu, Zhi-jianWang (2013), “Urban Traffic Signal System Control Structural Optimization BasedonNetworkAnalysis”.
[17] Xiaojian Hu, Jian Lu (2014), “Traffic Signal Synchronization in the Saturated High-Density Grid RoadNetwork.”
