Threads of Stability: Harnessing Polypropylene's Grip on Red Soil
Bidyut Bikash Hazarika1, Pragyan Kalita21Department of Civil Engineering, Royal Global University, Guwahati

2 Department of Civil Engineering, National Institute of Technology, Silchar ***
Abstract - This study investigates the soil stabilization of red soil using polypropylene fibers. The specific gravity, Atterberg limits, and particle size distribution of the soil were determined. The Proctor compaction test was conducted to establish the maximum dry density and optimum moisture content. Reinforced soil samples were prepared with varying fiber contents. Shear strength tests, including direct shear and unconfined compression, were performed to assess soil stability. The study was conducted using soil samples from the Garchuk area of Guwahati city. The results provide valuable insights into the behavior of red soil stabilized with polypropylene fibers, contributing to practical engineering applications. This research addresses a knowledge gap and offers guidance for sustainable and effectivesoilstabilizationtechniques.
Key Words: Soil stabilization, Red soil, Polypropylene fibers,Shearstrength,Compactiontest.
1.INTRODUCTION
Red soil, characterized by its distinct reddish color and high clay content, poses significant challenges for construction and engineering projects due to its inherent instability and poor load-bearing capacity. The instability ofredsoilcanresultinunevensettlements,excessivesoil erosion, and compromised structural integrity, leading to significant economic losses and safety concerns. To mitigate these challenges, various soil stabilization techniques have been employed, among which the incorporation of polypropylene fibers has emerged as a promisingsolution.
Polypropylene,aversatilethermoplasticpolymer,exhibits exceptional mechanical properties, including high tensile strength, low density, and resistance to chemical degradation. These properties make it an attractive material for enhancing the engineering characteristics of redsoil.Byintroducingpolypropylenefibersintoredsoil, it is possible to improve its stability, increase its loadbearing capacity, and reduce the potential for settlement anderosion.
Inaresearchconductedby Yi et al. (2006) aseriesoftests were performed on clayey soil specimens treated with varying percentages of polypropylene fiber (0.05%, 0.15%,0.25% by weight of the parent soil)and lime(2%, 5%, 8% by weight of the parent soil). Unconfined compression, direct shear, and swelling and shrinkage
testswerecarriedouttoassesstheengineeringproperties of the treated soil. The results indicated that the addition of polypropylene fiber increased the strength, toughness, and shrinkage potential of the soil. However, it led to a reductionintheswellingpotential.Basedonthescanning electron microscopy (SEM) analysis, it was found that the presence of fiber contributed to physical interaction between fiber and soil, highlighting the fiber's contributiontothesoil'sproperties.
Another study conducted by Nangia et al. (2015) investigated the behavior of polypropylene fiberreinforcedsoilsamplescollectedfromfivelocationsalong the Yamuna river bank in Delhi. Various percentages of polypropylene fiber (ranging from 0% to 2.5% of the dry weightofsoilsamples)wereaddedtothesoil.Unconfined compressive strength and direct shear tests were performed to evaluate the strength characteristics and stress-strain behavior of the reinforced soil samples. The study revealed that the addition of fibers enhanced the shear strength of the soil, particularly in well-graded samples. Moreover, the shear strength increased with higherpercentagesoffibers.Additionally,itwasobserved that fine soils exhibited increased optimum moisture content due to the increased surface area resulting from fiberaddition.
Sandysoils,characterized bytheir low cohesion and poor load-bearing capacity, often require stabilization techniquestoimprovetheirengineeringproperties. Attom et al. (2010) conducted a study on sandy soil stabilization using polypropylene fibers. They examined two types of fibers, one flexible with a flat profile and the other relatively stiffer with a crimped profile, at varying aspect ratios.Theresultsindicatedthatincreasingthecontent of flexibleflatprofilefibersimprovedshearstrength,angleof internal friction, and ductility of the sandy soil. Higher aspect ratios of these fibers further enhanced shear strength. The crimped profile fibers primarily increased shear strength under high normal load conditions. Moreover, increasing the percentages of both fiber types increased the angle of internal friction. These findings contribute to understanding the role of polypropylene fiber types and aspect ratios in enhancing shear strength parametersofsandysoil.
Studies consistently demonstrate that the inclusion of polypropylene fibers improves the UCS of soil. The fibers contribute to enhanced interlocking and cohesion within
the soil matrix, resulting in increased strength. A study conducted by Soğancı et al. (2015) in the Konya region investigated the swelling characteristics of expansive soil and the effects of polypropylene fiber inclusion on these properties.Itwasdeterminedthatthesoilintheareahad a propensity for swelling, requiring proper granular equipment to be inserted by excavating the ground to a depth of 50-60 cm. Laboratory tests were conducted to examinetheimpactofpolypropylenefiberontheswelling behavior of the soil. The test results revealed that the inclusion of fiber reduced the swell percentage of the expansivesoil.Additionally,asthefibercontentincreased, theunconfinedcompressivestrengthofthesoilincreased. However, the optimum moisture content did not exhibit significant changes with the addition of polypropylene fiber, while the maximum dry density decreased in compaction tests. The incorporation of fiber in both unreinforced and reinforced soil led to an increase in the unconfinedcompressivestrengthoftheexpansivesoil.
In an experimental study conducted by Malekzadeh et al. (2012)theeffectofpolypropylenefiberonthemechanical behavior of expansive soils was investigated. The study consisted of two phases: the first phase examined the impact of fiber inclusion on maximum dry density and optimum moisture content through dynamic compaction tests. The second phase focused on the unconfined compression, tensile strength, and swell behavior of unreinforced and reinforced soil samples. The findings showedthattheadditionofpolypropylenefibereffectively reduced one-dimensional swell and increased unconfined compressive strength and tensile strength. A 1% fiber content yielded the highest cohesion and tensile strength values. Another review by Ayyappan,et al. (2010) highlighted thepositiveinfluenceof randomly distributed polypropylene fibers on soil-fly ash mixtures. Fiber inclusion significantly improved the unconfined compressive strength, with an optimal dosage of 1% by dry weight of soil-fly ash. Longer fibers contributed more tostrainenergyabsorptioncapacity,withafiberlengthof 12mm producing the best results. Overall, both studies emphasized the effectiveness of polypropylene fiber reinforcement in enhancing the physical and mechanical properties of soils, particularly in mitigating the swelling behaviorandincreasingstrengthparameters.
This study aims to contribute to the advancement of soil stabilization techniques by investigating the efficacy of polypropylene fibers in improving the engineering propertiesofredsoil.Theresultsofthisresearchwill not only enhance our understanding of the behavior of stabilized red soil but also provide practical guidance for engineers and construction professionals seeking sustainable and effective solutions for projects involving redsoil.
2. MATERIALS AND METHODS
The experimental work consisted of several steps to investigate the soil stabilization of red soil using polypropylene fibers. The first step involved determining the specific gravity of the representative soil sample collected from the Garchuk hillside area of Guwahati city using the pycnometer method. This method involved fillinga pycnometerwithdistilledwaterandrecordingits weight. Then, a known weight of the soil sample was added to the pycnometer, and the weight was recorded again. Next, the soil's index properties, specifically the Atterberg limits, were determined. The liquid limit of the soil was measured using Casagrande's apparatus. Soil samples with moisture contents close to their liquid limit were taken and placed in the apparatus. The soil was gradually divided into two halves by a grooving tool, and the number of blows required for the soil to close the groove was recorded. This provided the moisture content representingtheliquidlimitofthesoil.
The plastic limit of the soil was determined by rolling the soilsampleona flatglassplateuntil its diameter reached approximately 3 mm. The moisture content at this stage representedtheplasticlimitofthesoil.
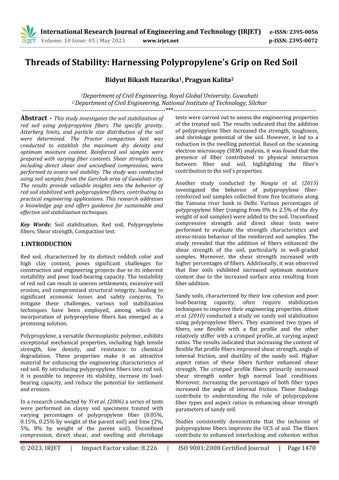
To assess the particle size distribution, a sieve analysis was conducted. The soil sample was dried and passed through a series of standard sieves with different mesh sizes.Theretainedsoilmassoneachsievewasmeasured, andthepercentageofsoilpassingthrougheachsievewas calculated.Thisdatawasthenusedtoplottheparticlesize distributioncurve.
The maximum dry density and corresponding optimum moisturecontent(OMC)ofthesoilweredeterminedusing the Proctor compaction test. Various moisture contents were selected, and soil samples were compacted in a standard Proctor mold with a specified number of blows. The dry density of each compacted sample was determined,andthemoisturecontentassociated withthe maximumdrydensitywasconsideredtheOMC.
To prepare the reinforced soil samples, polypropylene (PP) fibers were mixed with the soil. Different fiber contents of 0%, 0.1%, 0.2%, and 0.3% were adopted for the study. For samples without fiber reinforcement, the air-dried soil was mixed with water based on the OMC of the soil. For samples with fiber reinforcement, the requiredamountoffiberswasaddedincrementallytothe air-dried soil and mixed thoroughly. Once a homogenous mixture was achieved, the required amount of water was addedtoobtainthedesiredmoisturecontent.
Shear strength tests were conducted to evaluate the effectivenessofthesoilstabilization.Thedirectsheartest (DST)wasperformedtodeterminethecohesionandangle of internal friction of the soil. The soil samples prepared
with different fiber contents were subjected to shearing under known normal stresses and shear displacements. The shear stress and shear displacements were recorded during the test, and the shear strength parameters were calculated.
Additionally, the unconfined compression test (UCS) was carried out to determine the unconfined compressive strength of the soil samples. Cylindrical soil samples preparedwithdifferentfibercontentswereloadedaxially until failure. The load and deformation data were recorded, allowing for the calculation of the unconfined compressivestrength.
3. RESULTS AND DISCUSSIONS
3.1 Index Properties
3.1.1 Specific Gravity
Table 3.1: ObservationsforSpecificGravity
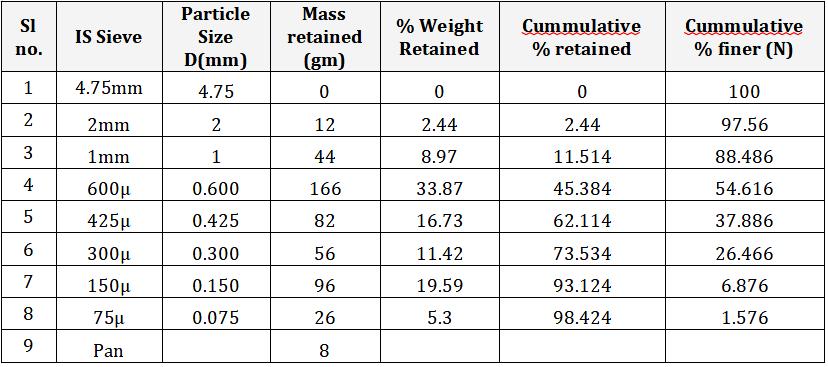
Chart 3.1: LiquidLimitChart
Liquidlimitasobtainedfromcurve=38.5 (Correspondingto25blows)
3.1.3 Plastic Limit
Table 3.3:ObservationsforPlasticLimit
3.1.2 Liquid Limit
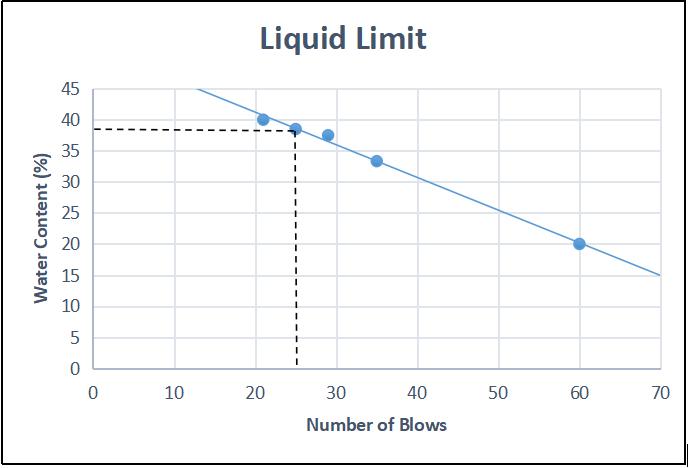
Table 3.2: ObservationsforLiquidLimit
3.2
UniformityCoefficient,Cu = = = 9
CurvatureCoefficient,Cc = = = 2

Fromthecurveitisevidentthat, OptimumMoistureContent(OMC)=19% Maximum
(MDD)=15.3KN/m3
3.4 Direct Shear Test
Table 3.6: ObservationsforDirectShearTest
i)
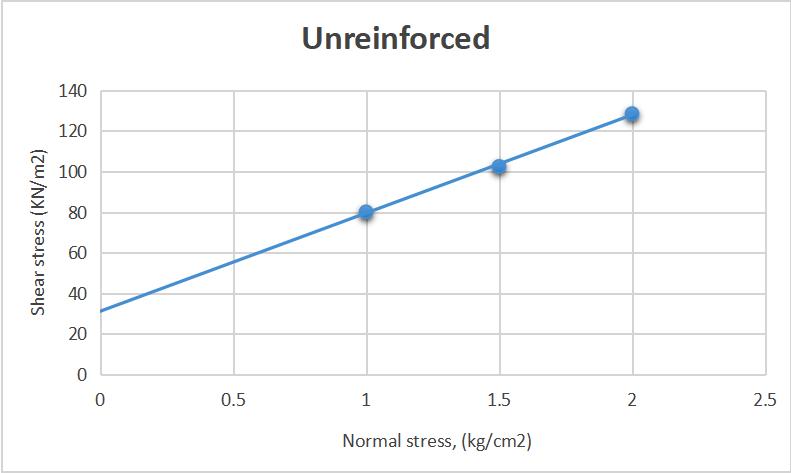
Chart 3.4: NormalstressvsShearstress
Computationfromcurve:
Cohesion(C)=0.325kg/cm2
Angleofinternalfriction(Ø)=26°33’
ii) Reinforcement = 0.1%
Table 3.8: Observationsfor0.1%reinforcement
iii) Reinforcement = 0.2%
Table 3.9: Observationsfor0.2%reinforcement
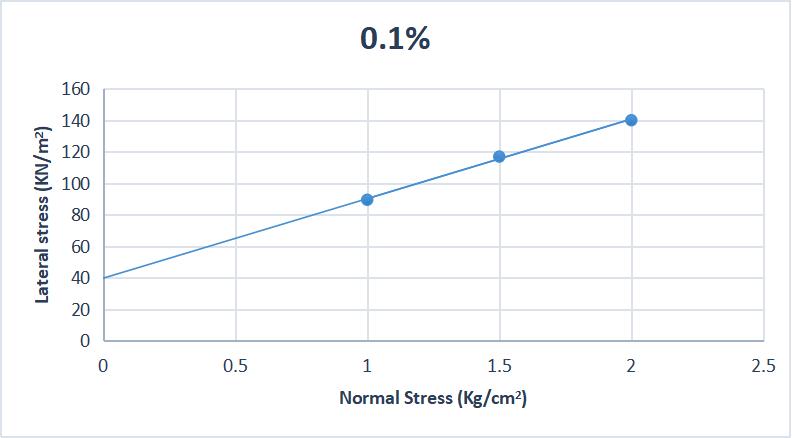
Curve 3.5: NormalstressvsShearstressforsoilwith 0.1%fibercontent
Computationfromcurve:
Cohesion(C)=0.375kg/cm2 =37.5KN/m2
Angleofinternalfriction(Ø)=30°57’
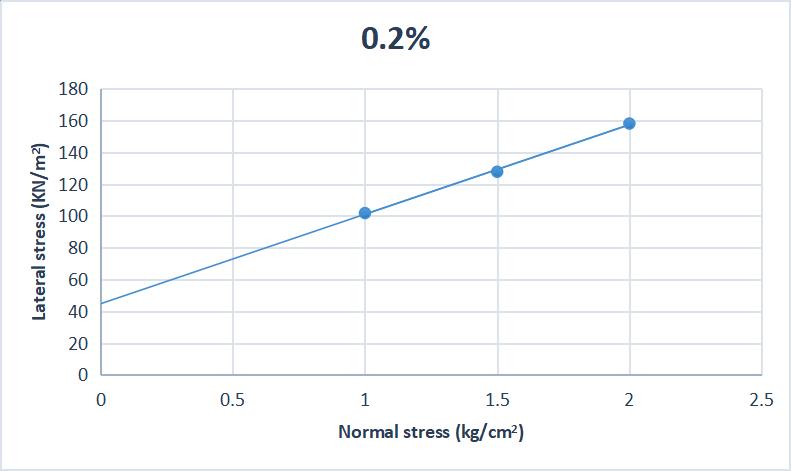
Curve 3.6: NormalstressvsShearstressforsoilwith 0.2% fibercontent
Computationfromcurve:
Cohesion(C)=0.44kg/m2 =44KN/m2
Angleofinternalfriction(Ø)=33°1’
iv) Reinforcement = 0.3%
Table
Observationsfor0.2%reinforcement
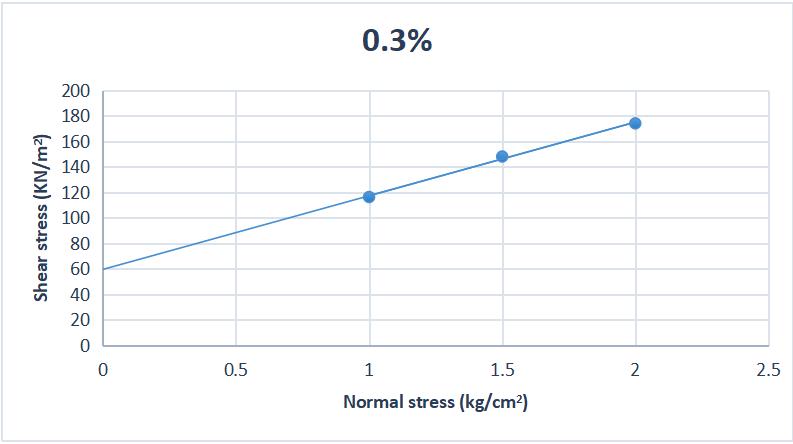
Curve 3.7: NormalstressvsShearstressforsoilwith 0.3%fibercontent
Computationfromcurve:
Cohesion(C)=0.575kg/m2 =57.5KN/m2
Angleofinternalfriction(Ø)=34°59’
3.5 Unconfined Compression Strength Test
i) Unreinforced
Table 3.11: Observationsforunreinforcedsoil
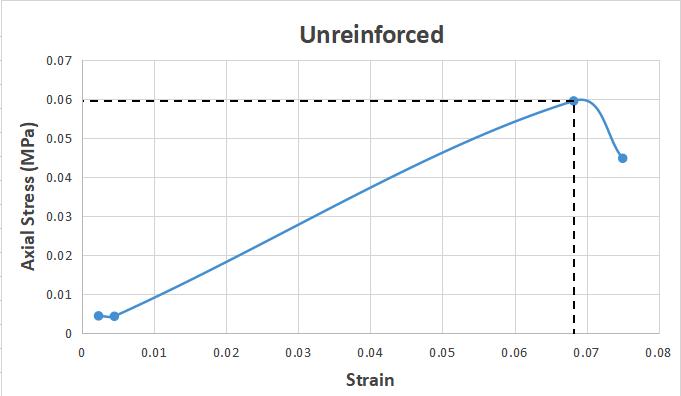
Asobtainedfromcurve: UCS=0.05957MPa
ii) Reinforcement = 0.1%
Table 3.12: Observationsfor0.1%reinforcedsoil
Chart 3.8: StressvsStraincurveforUnreinforcedsoil
Chart 3.9: StressvsStraincurveforsoilwith0.1%fiber content
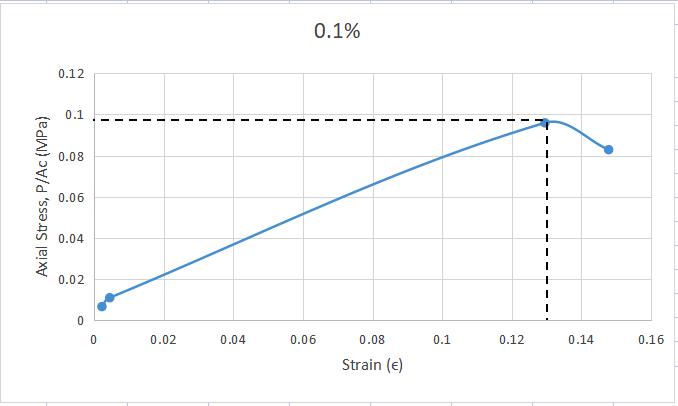
Asobtainedfromcurve: UCS=0.09595MPa
iii) Reinforcement = 0.2%
Table 3.13: Observationsfor0.2%reinforcedsoil
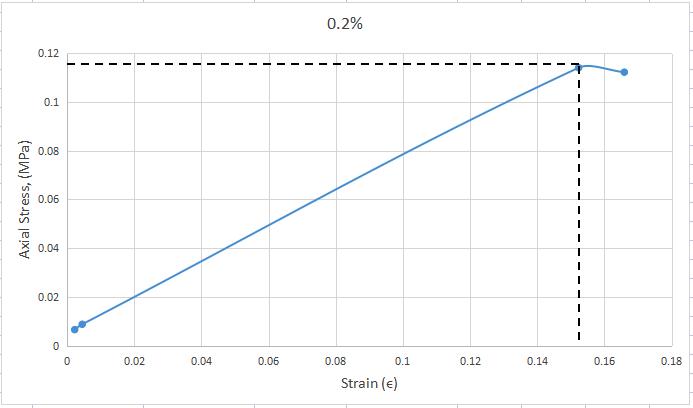
Chart 3.10: StressvsStraincurveforsoilwith0.2%fiber content
Asobtainedfromcurve: UCS=0.1140MPa
iv) Reinforcement = 0.3%
Table 3.14: Observationsfor0.3%reinforcedsoil
3.6 Discussions
The relationship between shear strength parameters and fibercontent:
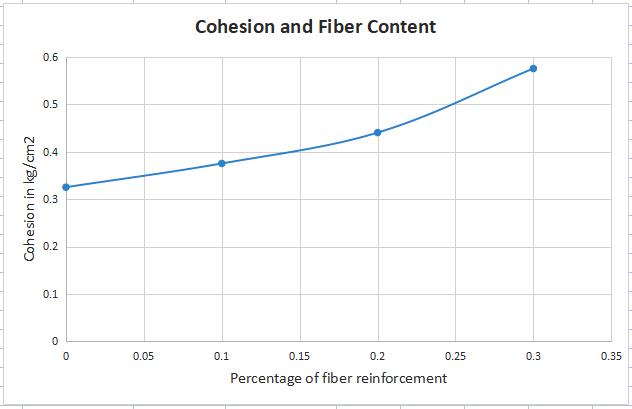
(a)Cohesionandfibercontent
Chart 3.12: Relationshipbetweencohesionandfiber content
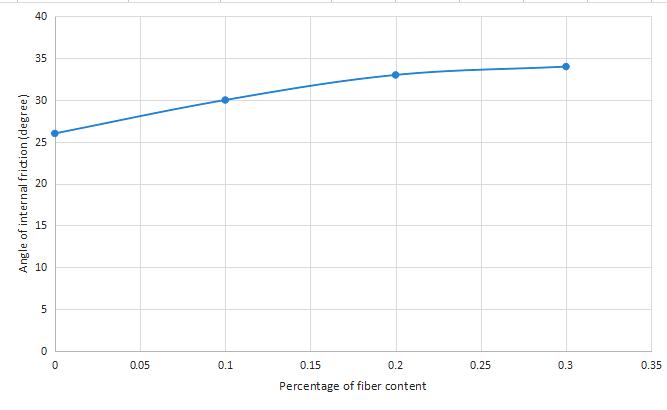
(b)Angleofinternalfrictionandfibercontent
Chart 3.13: Relationshipbetweenangleofinternal friction andfibercontent
(c) UCS and fiber content
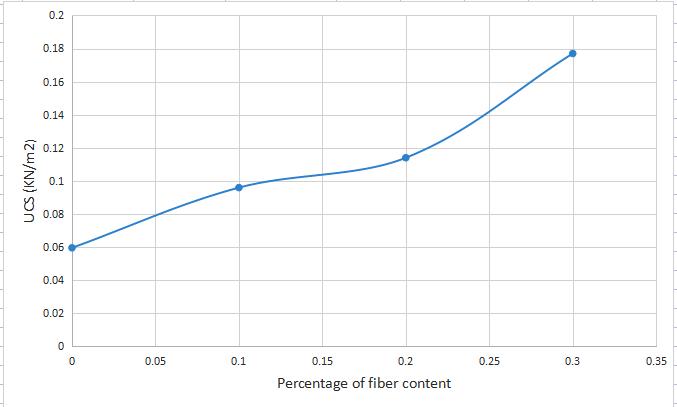
Chart 3.11: StressvsStraincurveforsoilwith0.3%fiber content
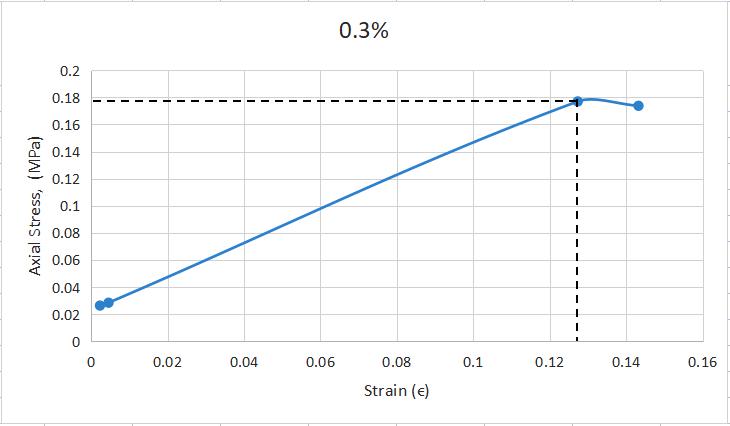
Asobtainedfromcurve: UCS=0.177MPa
Chart 3.14: RelationshipbetweenUCSandfibercontent
3.6.1 Interference from direct shear Test
Cohesionvalueincreasesfrom0.325kg/cm2 to0.575 kg/cm2 byafactorof1.76times.
Theangleofinternalfrictionincreasesfrom26°33’to 34°59’byafactorof1.32times.
3.6.2 Interference from Unconfined Compression Test
UCS value increases from 0.05957 MPa to 0.177MPa byafactorof2.97times.
4. CONCLUSIONS
In conclusion, based on the experimental study conducted,several keyfindingshave emerged.Firstly,the direct shear test results revealed that the inclusion of polypropylene fibers at 0.1%, 0.2%, and 0.3% concentrations led to an increase in cohesion by 1.15 times,1.17times,and1.3times,respectively.Theinternal angle of friction (Ø) also increased by factors of 1.16, 1.067, and 1.059 for the corresponding fiber concentrations. Notably, the values of cohesion and angle of internal friction increased significantly, suggesting the effectivenessofpolypropylenefiberreinforcementforthis typeofsoil.
Secondly,theunconfinedcompressionstrength(UCS)test demonstrated a substantial enhancement in the values of unconfined compressive strength. The results indicated a netincreasebyafactorof2.97,rangingfrom0.05957MPa to 0.177 MPa. This further supports the recommendation of using polypropylene fibers for reinforcing this type of soil.
Overall, the study concludes that fiber-reinforced soil can serve as a beneficial ground improvement technique, particularlyinengineeringprojectsinvolvingweaksoils.It can serve as a viable alternative to deep or raft foundations, effectively reducing costs and energy requirements. The findings of this research contribute to the understanding of soil stabilization methods and provide practical insights for engineers and construction professionalsinvolvedinprojectsdealingwithsimilarsoil conditions.
REFERENCES
[1]. Mousa, A., & Tamimi, K. A. (2010). “Effects of Polypropylene Fibers on the Shear Strength of Sandy Soil”.InternationalJournalofGeosciences,44-50.
[2]. Tang, C., Shi, B., Gao, W., Chen, F., & Cai, Y. (2007). “Strength and mechanical behavior of short polypropylene fiber reinforced and cement stabilized
clayeysoil”.Geotextilesand Geomembranes,25,194202.
[3]. Cai, Y., Shi, B., Ng, W. W., & Tang, C. (2006). Effect of polypropylene fiber and lime admixture on engineering properties of clayey soil. Engineering Geology,87,230-240.
[4]. Consoli, N. C., Prietto, P. D. M., & Ulbrich, L. A. (1999). The behavior of a fiber reinforced cemented soil. GroundImprovement,3(1),21-30.
[5]. Malekzadeh, M., & Bilsel, H. (2012). Effect of Polypropylene Fiber on Mechanical Behavior of Expansive Soils. European Journal of Civil Engineering.
[6]. Nangia, A., Nigam, S., Kumar, D., & Tiwari, S. (2015). “Effect of Polypropylene Fiber on the Strength Characteristics of the Soils along the Yamuna River Bank in Delhi City”, International Journal of EngineeringandTechnicalResearch.
[7]. Ayyappan, S., Hemalatha, K., & Sundaram, M. (2010). “Investigation of Engineering Behavior of Soil, Polypropylene Fibers and Fly Ash Mixtures for Road Construction”, International Journal of Environmental ScienceandDevelopment.
[8]. Punmia, B. C. (2007). Soil Mechanics & Foundations. LaxmiPublications.
[9]. Naeini, S. A., & Sadjadi, S. M. (2008). “Effect of Waste Polymer Materials on Shear Strength of Unsaturated Clays”. Electronic Journal of Geotechnical Engineering, 13,1-12.
[10]. Sofanci, A. S. (2015). “The Effect of Polypropylene Fiber in the Stabilization of Expansive Soils”, International Journal of Environmental, Chemical, Ecological, Geological and Geophysical Engineering, Vol:9,No:8