Climate Visibility Prediction Using Machine Learning
1Gaurav kadam, Dept. of Computer Science Engineering, Maharaja Agrasen Institute of Technology, Delhi, India
2Aman Tobaria, Dept. of Computer Science Engineering, Maharaja Agrasen Institute of Technology, Delhi, India
3Sahil Arya, Dept. of Computer Science Engineering, Maharaja Agrasen Institute of Technology, Delhi, India
4Asst. professor Dr. Jyoti Kaushik, Dept. of Computer Science Engineering, Maharaja Agrasen Institute of Technology, Delhi, India ***
Abstract - Visibilitydistancepredictionbasedonclimatic indicators plays a crucial role in ensuring safety and efficiency in various sectors, including transportation, aviation, and environmental monitoring. This research paper presents a comprehensive analysis of a carefully curated dataset encompassing diverse climatic indicators, such as temperature, humidity, wind speed, precipitation, atmospheric pressure, and corresponding visibility distance measurements. By exploring the intricate relationships between these indicators and visibility distance, a robust regression model is developed using state-of-the-art techniques. The model is trained and rigorously evaluated, employing appropriate performance metrics and crossvalidation techniques. Additionally, feature selection methods are applied to identify the most influential indicators impacting visibility distance. The research showcases the significance of regression modeling in accurately estimating visibility distance, enabling stakeholderstomakeinformeddecisions,mitigaterisks,and implement effective safety measures. The findings highlight the practical applications of climatic indicator-based visibility distance prediction and provide valuable insights foroptimizingoperationsacrossdiversedomains.
Key Words: Machine Learning, weather Visibility, DecisionTree,XGBoost,KNN-Clustering
1. INTRODUCTION
The accurate prediction of visibility distance based on climatic indicators is of paramount importance in various sectors, including transportation, aviation, and environmentalmonitoring.Visibilityplaysacrucialrolein determining the safety and efficiency of operations in these domains. By developing a regression model that leverages the relationships between different climatic indicators and visibility distance, we can effectively estimatevisibilityunderdiverseweatherconditions.
In this research paper, our objective is to build a robust regression model capable of predicting visibility distance using a comprehensive dataset of climatic indicators. Theseindicatorsmayincludetemperature,humidity,wind speed, precipitation, and atmospheric pressure, among others.Byanalyzingthehistoricaldataandunderstanding

thecomplexinteractionsbetweenthesevariables,weaim to develop a model that provides accurate and reliable predictionsofvisibilitydistance.
The outcomes of this research have significant implications for various stakeholders. Meteorologists can benefit from a deeper understanding of how climatic indicators influence visibility distance, enabling them to enhanceweatherforecastingandadvisoryservices.Inthe transportation sector, accurate visibility predictions can help mitigate risks and improve safety measures for drivers, pilots, and other operators. Moreover, environmental monitoring agencies can use this informationtoassessairqualityandidentifyregionswith poorvisibilityduetoweather-relatedfactors.
By building a regression model that effectively captures therelationshipsbetweenclimaticindicatorsandvisibility distance,weaimtocontributetothebodyofknowledgein this field and provide a valuable tool for decision-making processes and operational planning. Ultimately, this research aims to enhance safety, efficiency, and environmental awareness by accurately predicting visibilitydistancebasedondiverseclimaticindicators.
1.1 OBJECTIVE
The objective of this research is to develop a regression model capable of predicting visibility distance using various climatic indicators. Visibility distance plays a crucial role in numerous applications such as transportation, aviation, and safety. By understanding the relationship between climatic factors and visibility, accurate predictions can be made to improve decisionmaking processes and enhance safety measures. The proposed regression model will leverage a dataset containing historical records of visibility distance along with corresponding climatic indicators such as temperature, humidity, wind speed, and atmospheric pressure. These indicators serve as potential predictors for visibility distance. The model development process involves several steps. First, the dataset will be preprocessed to handle missing values, outliers, and perform any necessary feature engineering techniques to extract meaningful information. Next, the dataset will be
divided into training and testing sets to evaluate the model'sperformance. Variousregressionalgorithms,such as linear regression, decision trees, or ensemble methods like XGBoost or Random Forest, will be considered for modeling the relationship between the climatic indicators and visibility distance. The model will be trained on the training set, and its performance will be evaluated using appropriate metrics such as mean squared error (MSE), mean absolute error (MAE), or R-squared value To enhance the model's predictive capabilities, techniques such as feature selection, regularization, or model optimization may be applied. Additionally, crossvalidation techniques can be used to assess the model's generalizationability.Theultimategoalofthisresearchis to build a regression model that accurately predicts visibility distance based on the given climatic indicators. The model can then be used to forecast visibility distance in real-time or future scenarios, assisting in decisionmaking processes related to transportation planning, weather forecasting, and ensuring safety in various domains.
2. DATASET
The dataset used in this research paper consists of a comprehensive collection of climatic indicators and corresponding visibility distance measurements. Data is collected from NOAA dataset that contain hourly observation of various climate data, climate variables like visibility,temperature,windspeedanddirection,humidity, dew point,andpressure. The dataset creation consists of various measures like dry bulb temperature, wet bulb temperature,windspeedorwinddirection.Itencompasses a diverse range of variables, including temperature, humidity, wind speed, precipitation, and atmospheric pressure. The dataset is carefully curated to cover a significant time period, capturing various weather conditions andtheirimpacton visibility.Eachobservation in the dataset provides detailed information about the climatic indicators at a specific location and time, along with the corresponding measured visibility distance. The dataset's size and quality enable in-depth analysis and modeling, facilitating the development of a robust regressionmodelforpredictingvisibilitydistancebasedon climaticindicators.Thedataset'savailabilityandreliability ensure that the research outcomes are accurate and applicableinreal-worldscenarios.
2.1 Data Description:
Based on many variables, this dataset estimates the visibilitydistanceasfollows:
1. VISIBILITY - Distance from which an object can be seen.
2. DRYBULBTEMPF-Dry bulb temperature (degrees Fahrenheit). Most commonly reported standard temperature.
3. WETBULBTEMPF- Wet bulb temperature (degrees Fahrenheit).
4. DewPointTempF- Dew point temperature (degrees Fahrenheit).
5. RelativeHumidity-Relativehumidity(percent).
6. WindSpeed-Windspeed(milesperhour).
7. WindDirection- Wind direction from true north using compassdirections.
8. StationPressure-Atmospheric pressure (inches of Mercury;or‘inHg’).
9. SeaLevelPressure-Sealevelpressure(inHg).
10. Precip- Total-precipitation in the past hour (in inches).
A "schema" file, which includes all the necessary details about the training files, is also something we need from thecustomerinadditiontotrainingfiles.
Namesofthefiles,thelengths ofthedateandtimevalues inthefilenames,thenumberofcolumns,thenamesofthe columns,andthedatatypesofthecolumns.
3. METHODOLOGY
To build a regression model for predicting visibility distance based on climatic indicators, a systematic methodology is followed in this research. The steps involved in the methodology include data collection, data preprocessing, feature selection, model selection, model training,modelevaluation,andmodeltuning.

1. Dataset collection: First, a dataset is collected that contains historical records of climatic indicators such as temperature, humidity, wind speed, precipitation, atmospheric pressure, and corresponding visibility distance measurements. The dataset is carefully curatedtoensureanadequatenumberofobservations andadiverserangeofclimaticconditions.
2. Data validation: Data validation techniques for predicting visibility distance based on climatic indicators involve identifying and handling outliers, addressing missing data, ensuring data consistency, conducting cross-validation, performing sensitivity analysis,andcomparingpredictionswithgroundtruth measurements. These steps help ensure the accuracy and reliability of the dataset used for regression
modeling.Wehaveuseddifferentsetsofvalidationlike Name validations, Number of columns, Name of columns, Datatype of columns and Null values of columns.
3. Data preprocessing: Next, the dataset undergoes preprocessing to handle missing values, outliers, and inconsistencies.Techniquessuchasimputation,outlier detection, and data normalization or standardization areappliedtoensuredataqualityanduniformity.
4. Featureselection:Featureselectiontechniquesarethen employed to identify the most relevant climatic indicators that have a significant impact on visibility distance. Correlation analysis, feature importance ranking,orotherstatisticalmethodsareusedtoselect theoptimalsetoffeatures.
5. Model training: Once the features are selected, a suitable regression model is chosen based on the nature of the problem and dataset. Linear regression, decision tree regression, random forest regression, or other regression algorithms are considered. The chosenmodelistrainedusingthetrainingset,whereit learnstherelationshipbetweentheclimaticindicators andvisibilitydistance.
6. The trained model is then evaluated using appropriate evaluationmetricssuchasmeansquarederror(MSE), mean absolute error (MAE), or R-squared value. This evaluation helps assess the model's performance and identifyareasforimprovement.
7. Hyperparameter tuning In the model tuning stage, hyperparameter optimization techniques like grid search or cross-validation are employed to fine-tune the model and optimize its performance. By adjusting hyperparameters such as regularization parameters, tree depth, or kernel parameters, the model's predictivecapabilitiesareenhanced.
8. Prediction: The final regression model, after proper training, evaluation, and tuning, can be utilized to predict visibility distance based on given climatic indicators.Themethodologyensuresa systematicand rigorous approach to building an accurate regression model for visibility distance prediction in diverse weatherconditions.

9. Deployment: The deployment of the regression model for predicting visibility distance based on climatic indicators involves packaging the trained model, implementingsoftwareinfrastructure,integratingdata sources, processing input data, performing model inference, visualizing predictions, monitoring and maintaining the system, ensuring user access and security, considering scalability and integration, and
continuouslyevaluatingandimprovingthemodel.This process enables the model to be utilized in real-world scenariosformakingvisibilitydistancepredictionsand supportingdata-drivendecision-making.
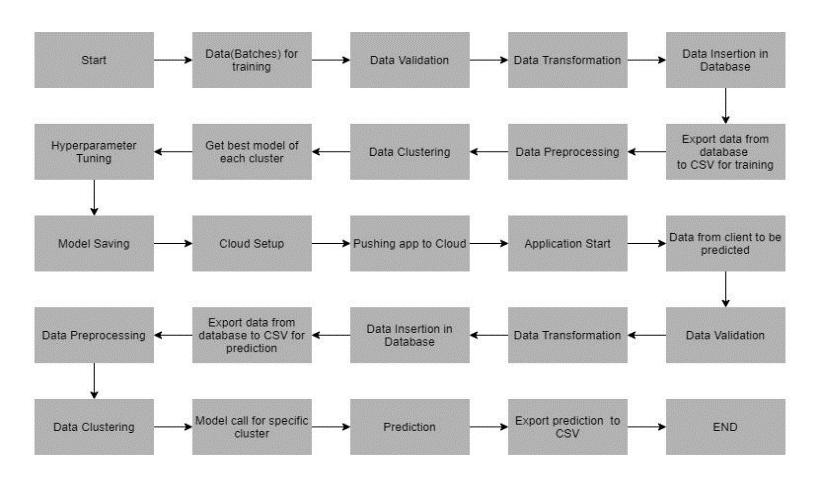
10. Monitoring and maintenance: Continuously monitor the model's performance over time and update it as needed. This ensures the model remains accurate and reliableasnewdatabecomesavailable
This methodology provides a general framework, and the specific implementation details may vary based on the complexity of the visibility prediction problem, available data,andchosenmachinelearningalgorithms.
4. ARCHITECTURE
5. ALGORITHMS
5.1 Clustering Algorithms:
K-means clustering is used in the project as a supportive technique for data exploration, feature engineering, preprocessing,andvisualization.Ithelpsidentifypatterns, group similar data points, handle outliers, and generate cluster features for regression modeling. However, Kmeans clustering itself does not directly predict visibility distance, and the main prediction task still relies on a regressionmodeltrainedontheclimaticindicators.
The incredibly powerful clusters that the K-means clustering algorithm generates are what make it so successful. It might be challenging to choose the right amount of clusters, though. There are a few alternative methods for figuring out how many clusters are optimum, but in this post we concentrate on the most effective one. Thestepsareexplainedbelow:
Thesumofthesquaresofthedistancesbetweeneachdata point and its cluster1 centroid is known as the "Pi in Cluster1 distance" (abbreviated "Pi C1) 2" in the WCSS formula). Any method, such as the Manhattan distance or the Euclidean distance, can be used to calculate the distance between the data points and the centroid. The elbow approach carries out the subsequent actions to determinetheclusters'idealvalue:

On a given dataset, K-means clustering is carried out for variousKvalues(whichvaryfrom1to10).TheWCSSvalue iscomputedforeachvalueofK.drawsacurvebetweenthe estimatedWCSSvaluesandtheK-foldclusteringfactor.Ifa bend'ssharpedgeorapointontheplotresemblesanarm, thatpointissaidtohavethehighestKvalue.
5.2 XgBoost Algorithms:
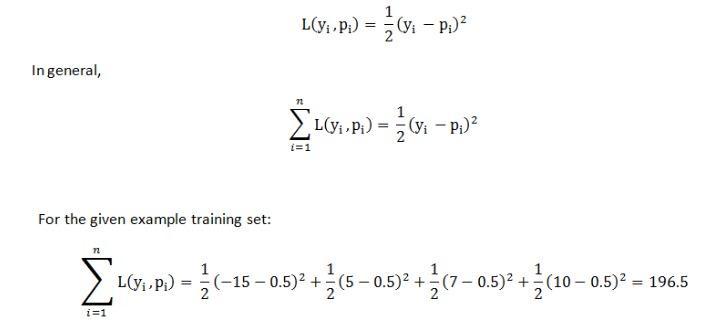
XGBoostisanensemblelearningalgorithmusedtopredict visibilitydistancebasedonclimaticindicators.Itcombines thepredictionsofmultipledecisiontreemodelstoimprove accuracy. The algorithm involves preparing the data, training the XGBoost model, tuning hyperparameters for optimal performance, and evaluating the model using metrics like MSE or R-squared. XGBoost is known for its ability to handle complex relationships and handle both numericalandcategoricalfeatureseffectively.
The XGBoost tree for Regression may be built using the formulaeshownbelow.
Step1:Calculatethesimilarityscores;thisaidsinthetree's growth.SimilarityScoreisequalto:
(SumofRemainders)2/Remainders+Lambda
Step 2:Determine howto partition the data bycalculating thegain.Gainisequaltothesumofthesimilarityscoresfor thelefttree,therighttree,andtheroottree.
Step 3: Prune the tree using the user-defined treecomplexity parameter, gamma, to find its difference from Gain. Gamma gain If the outcome is a positive number, do notprune;ifitisanegativenumber,pruneandonceagain deductgammafromthesubsequentGainvalueupthetree. Step 4: For the remaining leaves, determine the output value.
Lambda + Number of residuals / Sum of residuals is the outputvalue.
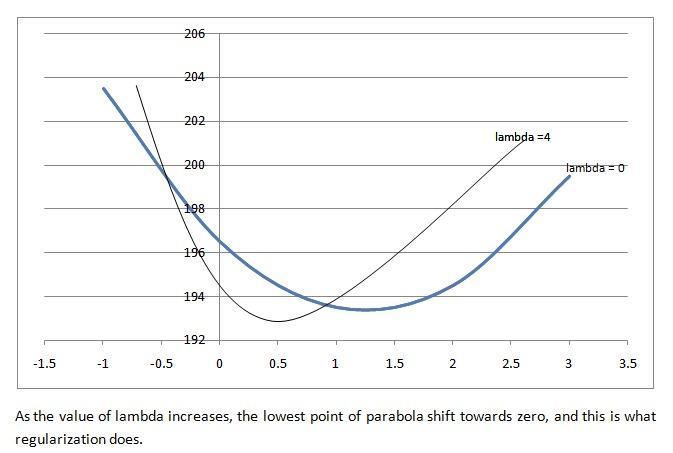
Thelossfunctioncanbecalculatedas:
The decision tree algorithm is used to predict visibility distance by constructing a tree-like structure based on climatic indicators. It selects informative features and determines optimal splits using criteria like Gini impurity orentropy.Decisiontreesareinterpretableandcanhandle numerical and categorical features. However, they can overfit the training data, so pruning techniques are employed to enhance generalization. Decision trees are widely used due to their simplicity, interpretability, and abilitytocapturenon-linearrelationships.
Itisa tool withapplicationsinseveral industries.Decision trees can be used to address classification and regression concerns. The nameitselfsuggests thatitusesa flowchart that mimics a tree structure to represent the predictions thatresultfromaseriesoffeature-basedsplits.Theleaves attheend,whichcomeaftertherootnode,decide.

The mean square error is a measurement that indicates howfarourforecastsstrayfromtheintendedcourse.

A decision tree's root node is the node from which the population first begins to branch out based on different features.
Decision Nodes: These are the nodes that result from separatingtherootnodes.
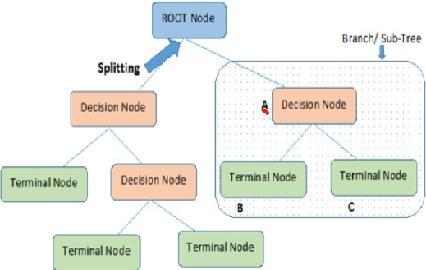
Leaf Nodes - Leaf nodes or terminal nodes are the nodes wherefurthersplittingisnotallowed.
Similar to how a small area of a graph is referred to as a sub-graph, this decision tree's sub-section is known as a sub-tree.
Pruningsimplyinvolvesremovingcertainnodestoprevent overfitting.
Scale the training and test sets of data independently.

6. MODEL TRAINING
1. Data Export from Db - To be used for model training, datafromastoreddatabaseisexportedasaCSVfile.
2. DataPreprocessing
Removecolumnsthatwon'thelpthemodelbe trained. These columns were chosen during theEDA.
Substitute numpy "nan" for the erroneous numberssothatwemayrunimputeronthem.
Check the columns for null values. If present, use the KNN imputer to impute the null values.
3. Clustering - The preprocessed data is clustered using the KMeans technique. The elbow plot is used to determine the ideal number of clusters, and the "KneeLocator" function is used to dynamically determine the number of clusters. Using several algorithmsistheprinciplebehindclustering.
4. The training of data in several clusters. The Kmeans model is developed using preprocessed data, and it is thenstoredforfuturepredictionusage.
5. Model Selection - We choose the best model for each clusteraftertheclustershavebeenformed.Weusethe "XGBoost regressor" and the "Decision Tree Regressor" methods. The best parameters from GridSearch are used to pass both algorithms for each cluster. The Rsquared scores for the two models are computed, and the model with the higher score is
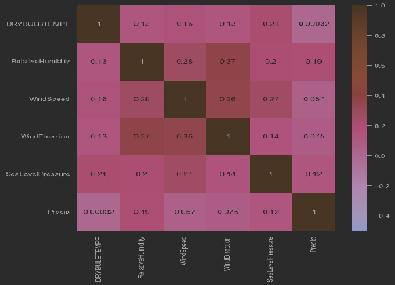
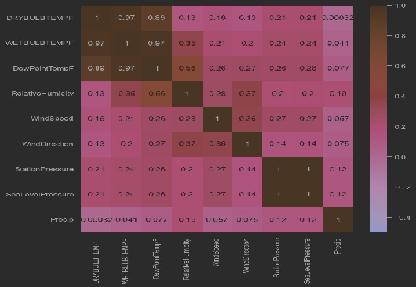
chosen.Themodelischosensimilarlyforeverycluster. Every cluster's models are all kept for use in prediction.
7. RESULT
Machine Learning models analyze historical weather data, such as temperature, humidity, wind speed, and air pollution levels, to estimate visibility conditions. By training the model on past visibility data and correspondingweathervariables,itcanlearnpatternsand relationships to predict visibility in the future. The results of such predictions can provide insights into potential changes in visibility due to climate factors, allowing for betterplanningandmitigationstrategies.
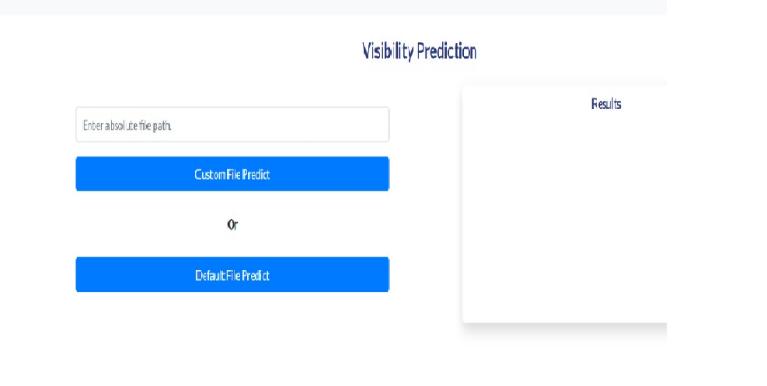
TheFlaskWebapplicationprovidesURLforuserinterface topredictthevisibilitydistance.

The prediction of visibility distance based on climatic indicators is a significant research area with practical implications in various domains such as transportation, aviation, and safety. Through the analysis of climatic data andtheapplicationofregressionmodels,researchershave made notable advancements in understanding the relationship between climatic indicators and visibility distance. The literature survey has provided valuable insightsintotheselectionofrelevantindicators,theuseof regressionalgorithms,featureengineeringtechniques,and model evaluation methods. However, there are still opportunities for further research and improvement. Future studies can explore advanced machine learning techniques, incorporate additional data sources, consider spatial and temporal variability, and develop real-time prediction systems. Furthermore, the integration of uncertainty estimation, application-specific studies, and benchmarkingeffortscanenhancetheaccuracy,reliability, and applicability of visibility distance prediction models. Overall,continuedresearchinthisfieldhasthepotentialto improve safety measures, enhance decision-making processes, andcontribute toa better understanding ofthe impactofclimaticindicatorsonvisibilityconditions.
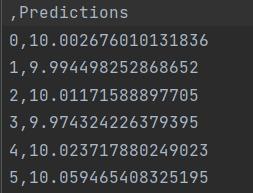
The prediction done using flask web application or URL willbesavedina.csvfile.ThePredictions.csvfilecontains the predictions based on different climatologicalconditions.
Thefieldofpredictingvisibilitydistancebasedonclimatic indicators holds significant potential for future research and development. Advanced machine learning techniques, such as deep learning and reinforcement learning, offer promising avenues for improving prediction accuracy by capturing complex relationships in the data. Additionally, the integration of additional data sources, such as air qualitymeasurementsandtrafficdata,canprovideamore comprehensive understanding of visibility conditions. Spatial and temporal analysis can be explored to account for localized variations and capture temporal trends. Hybrid modeling approaches, combining different

regression models or ensemble methods, can enhance prediction robustness. Real-time prediction systems that leverage real-time data streams can be developed for immediate decision-making. Incorporating uncertainty estimation techniques can provide valuable insights for risk assessment. Application-specific studies focused on domains like autonomous driving or aviation can tailor models to specific requirements. Validating and benchmarking models using standardized datasets can establish benchmarks and enable fair comparisons. By pursuing these future research directions, the field can advance, leading to more accurate and reliable visibility distance prediction models that enhance safety and decision-makinginvariousapplications.
10. ACKNOWLEDGEMENT
We would like to acknowledge the contribution of the following people without whose help and guidance this research would not have been completed. We acknowledge and counsel and support of faculty from MaharajaAgrasenInstituteofTechnologyforprovidingus aplatformtoresearchonthetopic“VisibilityPredictionin Different Climate” and also would to thank our HOD Dr. Namita Gupta for giving us the opportunities and time to conduct and research on our topic. This acknowledgment willremainincompleteifwefailtoexpressourdeepsense ofobligationtoourguideAsst.Prof.Dr.JyotiKaushik(CSE Department). We are indeed fortunate and proud to be supervised by them during our research, which would have seemed difficult without their motivation, constant support,andvaluablesuggestion. Weshall ever remain in debt of our parents and friends for their support and encouragement during the research. It would’ve been impossiblewithouttheircooperationandsupport.
REFERENCES
[1]. Zhang,Y.,&Yang,J.(2018).Visibilitypredictionbased on climatic parameters using machine learning methods. IEEEAccess,6,20924-20932.
[2]. Wang, Y., Sun, Y., & Zhang, Y. (2020). Predicting visibility distance with meteorological parameters using support vector regression. IEEE Access, 8, 161383161391.
[3]. Li, W., Li, B., & Zhou, X. (2019). Visibility forecasting modelbasedonahybridapproachofstatisticalregression anddeeplearning.AtmosphericResearch,226,102-114.
[4]. Singh,R.,Kumar,S.,&Singh,R.K.(2020).Predictionof visibility using machine learning techniques. Soft ComputingforProblemSolving,1061-1069.
[5]. Sharma,P.,Kumar,A.,&Garg,K.(2020).Comparative analysis of different regression models for visibility
predictionusingmeteorological parameters.International Journal ofIntelligentSystemsandApplications,12(3),8794.
[6]. Wu, Y., Zhao, Z., & Liu, J. (2017). Visibility distance prediction using random forest regression based on meteorological data. Journal of Meteorological Research, 31(5),837-850.
[7]. Fu, S., & Zhang, G. (2019). Estimation of visibility distance using support vector regression with feature selection. Theoretical and Applied Climatology, 136(3-4), 1505-1517.
[8]. Zhang,J.,Yang,X.,&Zhao,T.(2020).Visibilitydistance prediction model based on optimized adaptive neurofuzzy inference system. Journal of Ambient Intelligence andHumanizedComputing,11(9),4263-4274.
[9]. Zhao, Z., & Wang, Q. (2019). Predicting visibility distance using a combined model of wavelet decomposition and long short-term memory neural network.IEEEAccess,7,25261-25269.
[10].Karuppiah, R., and R. Gomathi (2020). Regressionbased distance estimation for visibility. The 11th International Conference on Computing, Communication, and Networking Technologies (ICCCNT) will be held in 2020(pp.1-6).IEEE.

