AMAZON STOCK PRICE PREDICTION BY USING SMLT
S.M. Ajitha1 , S.Karthick2 , Mu.Karthikeyan3, N.T.Naveen Balaji41 (Assistant Professor) Department of Information Technology, Meenakshi College of Engineering, Chennai, Tamil Nadu, India

2-4Students of Department of Information Technology, Meenakshi College of Engineering, Chennai, Tamil Nadu, ***
Abstract - Stock prices are determined by a company's initial public offering (IPO). Investment firms use a variety of metrics to determine what the stock's price should be. Traders use financial metrics to determine the value of the company, including its history of earnings, changes in the market, and the profit it can reasonably be expected to bring in. Stock price prediction has become an important research area. We propose a SMLT algorithms to accurately predict the stock price. Linear regression algorithm has the best accuracy with precision, Recall and F1 Score.
Keywords: LINEAR REGRESSION, ACCURACY, PRECISION
1. INTRODUCTION:
Amazon (AMZN) is one of the most well-known companiesintheworldand holdsaresoluteposition.The stock market prediction problem has drawn a lot of interest from both scholars and practitioners since it is crucial but difficult. An RNN-based ensemble model for financial market forecasting using news releases [1]-[2] was described in the existing solution. The most representative elements from financial news and historical data were culled using sentiment analysis and theslidingwindowapproach.Byusingdatafromthepast, machine learning can forecast the future [3]. Computers may learn without being explicitly taught thanks to a techniquecalledmachinelearning(ML),whichisasubset of artificial intelligence (AI). Algorithms with specialized functions are used during the training and prediction processes. The objective is to build a machine learning model for forecasting the price of Amazon stock [4] that might ultimately replace the supervised machine learning regression models, which can be updated by predicting outcomeswiththehighestlevelofaccuracybycontrasting supervisedmethods[10].Therestofthisarticleisdivided into the following sections. The three algorithms (KNN, EN, and SVR) and the structure of our suggested LR architecture are explained in Section II. In Section III, experiments and analyses are described. This includes data preparation, the evaluation index, experimental outcomes, and statistical analysis. In Section IV, conclusionsarereached.
1.1 Existing System:
When making stock market investing selections, traders and investors can benefit greatly from financial news announcements.Thestockmarketpredictionproblemhas drawn a lot of interest from academics and industry professionals since it is crucial yet difficult. Due to the complexity and ambiguity of the natural language [1] [15][16] used in thenews,conventional machinelearning models frequently fail to understand the substance of financial news. An RNN-based ensemble [4] [5] [6] model for financial market prediction using news releases was reported in this study. The sliding window approach and sentiment analysis were used to extract the most representative characteristics from historical data and financial news. Compared to conventional pre-processing techniques(suchbag-of-wordsandTF-IDF),whichextract tens of thousands of features, this significantly decreased thenumberofdimensions.
1.2 Proposed System:
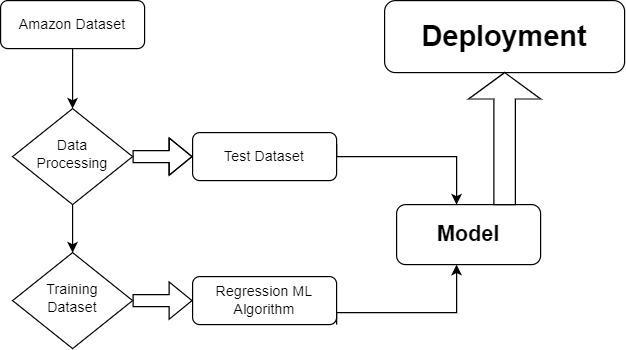
Data gathered from a variety of sources make up the proposedproject.Thedata will beexaminedforaccuracy. The cleansed data will be created for testing and training purposes. The machine learning approach is used to generatethemodel.Toidentifytheoptimalmethod,many algorithms are used. The ideal one serves as a template. Thenewstockpriceispredictedusingthedatamodel.
2. ALGORITHM USED:
The Elastic net, KNN, and SVR are three well-known algorithms capable of handling sequential structural data. The design of our LR Algorithm, which has the highest accuracyforstockpriceforecasts,isthendescribed.
2.1: K-NEAREST NEIGHBORS:
A straightforward technique known as "K nearest neighbors"storesalloftherelevantdataandforecaststhe numerical objective based on a similarity metric. (e.g., distance functions) [7]-[9]. Since the first decade of the 1970s,KNNhasbeenutilizedasanon-parametricmethod for statistical estimation and pattern identification. The supervised machine learning technique known as knearestneighbor’s(KNN)isstraightforwardandsimpleto
use. It may be used to tackle classification and regression issues. The KNN method pre supposes the presence of nearby comparable objects. Alternatively said, related objects are [9] close to one another. With some mathematics we may have learnt in our early years calculating the distance between points on a graph KNN encapsulates the notion of similarity (also termed distance,proximity,orcloseness).
as a line with a single input variable [16]-[19]. An optimization procedure is used to find the model's coefficients in order to reduce the total squared error between the predictions (yhat) and the anticipated goal values.(y).
Loss = sum i=0 to n (y_i – yhat_i)^2
The predicted coefficients of the model might grow significantly, which makes the model sensitive to inputs and potentially unstable. This is especially true for issues when there are fewer observations (samples) or more samples (n) than input variables or predictors (p) (socalledp>>nissues).
2.2:
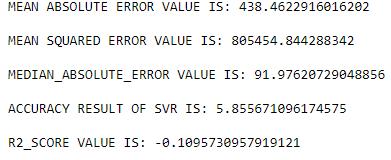
Fig-1: PredictedaccuracyusingKNN
SUPPORT VECTOR REGRESSION:
Machine learning classification and regression issues are frequently solved with Support Vector Machines (SVM) [20]-[22].Theclassificationproblemisageneralization of the regression problem, in which the model produces an output with continuous values as opposed to one from a limited set. In other terms, a regression model calculates the estimate of a multivariate continuous function. SVMs formulate binary classification issues as convex optimization issues and use those to solve the issues. The goaloftheoptimizationissueistoaccuratelycategorizeas many training points as feasible while determining the largestmarginseparatingthehyperplane.Supportvectors in SVMs are used to represent this ideal hyperplane. The SVM is adaptable to regression issues due to its sparse solution and strong generalization. In order to generalize SVM to SVR, the function is surrounded by a -insensitive zoneknownasthesupervisedlearningcontext.
Acommonpunishmentistodevalueamodelaccordingto thesumofthesquaredcoefficientvalues.Thepunishment forthisisanL2.Althoughitpreventsanycoefficientsfrom being dropped fromthe model,an L2penaltyreduces the sizeofallcoefficients.
L2_penalty = j=0 to p beta_j2
2.3:
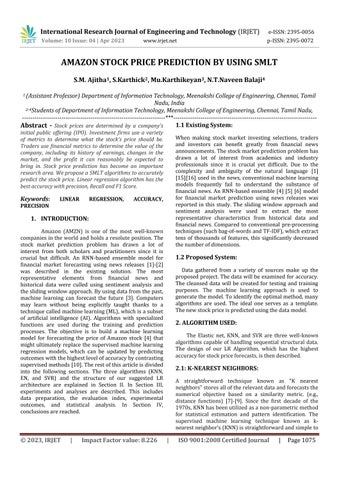
Fig-2: PredictedaccuracyusingSVR
ELASTIC NET:
A model that assumes a linear connection between the input variables and the target variable is known as a "linear regression" model. This connection may be conceptualized as a hyperplane connecting the input variables to the target variable in higher dimensions and
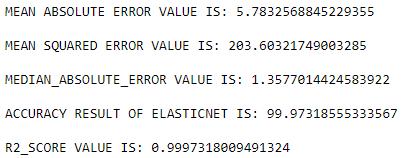
Another common punishment is to devalue a model according to the total of the absolute coefficient values. It is known as the L1 penalty. All coefficient sizes are reduced by an L1 penalty, which also permits certain coefficients to be minimized to zero, which eliminates the predictor from the model.Sum j=0 to p abs l1_penalty(beta_j)A penalized linear regression model calledanelasticnetincorporatesbothL1andL2penalties during training. The weight assigned to the L1 and L2 penalties is specified by the hyper parameter "alpha," whichistakenfrom"TheElementsofStatisticalLearning." The L1 penalty's contribution is weighted using an alpha value between 0 and 1, and the L2 penalty's contribution isweightedusingoneminusthealphavalue. ((1 - alpha) * l2_penalty) + (alpha * l1_penalty) = elastic_net_penalty. For instance, an alpha of 0.5 would allow each penalty to contribute equally to the loss function. All weight is given to the L2 penalty with an alphavalueof0,whileavalueof1yieldsallweight tothe L1penalty. Elastic net has the advantage of allowing a balance between the two penalties, which can lead to better performance on particular problems than a model withonlyonepenalty.Lambda,afurtherhyperparameter, affectshowmuchthetotalofbothpenaltiesisweightedin theloss function.The fullyweightedpenaltyis applied by defaultwithavalueof1.0;ifthevalueiszero,thepenalty is not applied. Lambda values as tiny as 1e-3 or less are typical.
b=theslope.
u=theregressionresidual.
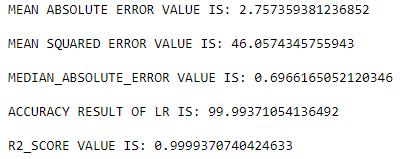
A machine learning algorithm built on supervised learning is linear regression. The job of predicting the valueofadependentvariable(y)basedonanindependent variableiscarried outusing linear regression.(x). Thus, x (the input) and y (the output) are shown to be linearly related using this regression approach.(output). It completes a regression job. Regression creates a goal prediction value based on independent variables. It is mostly used to determine how variables and forecasting relate to one another. The type of link that different regression models take into account between the dependent and independent variables, as well as the amountofindependentvariablesutilized,vary.Thejobof predicting the value of a dependent variable (y) based on an independent variable is carried out using linear regression. (x). Consequently, this regression approach identifies a linear connection between x(input) and y(output).
The linear regression procedure, often known as linear regression, illustrates a linear connection between one or more independent variables (y) and a dependent variable (y). As a result of displaying a linear connection, linearregressionmaybeusedtodeterminehowthevalue ofthedependentvariable[23]-[25]changesinproportion tothevalueoftheindependentvariable.Aslopingstraight line illustrating the relationship between the variables is providedbythelinearregressionmodel.
Thegeneralformofeachtypeofregressionis:
Simple linear regression: Y=a+bX+u
Multiple linear regression: Y=a+b1X1+ b2X2 + b3X3 +...+btXt +u
Where:
Y=thevariablethatyouaretryingtopredict (dependentvariable).
X=thevariablethatyouareusingtopredictY (independentvariable).
a=theintercept.
2.5: DEPLOYEMENT:
DJANGO:
A Python-based server-side web framework with a wide rangeoffeatures,Django,is verywell-liked Djangoisone of the most widely used web server frameworks, how to setupadevelopmentenvironment,andhowtostartusing it to build your own web applications Regardless of the popular operating system you use, this article should provide you with all you need to begin building Django apps. A high-level Python web framework called Django enables the quick creation of safe and dependable websites. Django, which was created by seasoned programmers, handles a lot of the pain associated with
web development, allowing you to concentrate on developingyourappwithouthavingtorecreatethewheel.
HTML:
Hyper Text Markup Language is referred to as HTML. Using a markup language, it is used to create web pages. Markup language and hypertext are combined to form HTML. The link between web pages is defined by hypertext.Tospecifythetextdocumentwithinthetagthat specifiesthestructureofwebpages,amarkuplanguageis employed. This language is used to annotate (create computer-readable comments on) material so that a computer can comprehend it and change the content as necessary. Most markup languages, including HTML, are understandablebyhumans.Tagsareusedinthelanguage tospecifywhattextprocessingisrequired.
CSS:
Cascading Style Sheets are known as CSS. It is a language for defining how Web pages are presented, including the colors,layout,andfontsthatmakeourwebsitesappealing to users. For creating style sheets for the web, CSS was created. Any XML-based markup language may be used withitbecauseitisnotdependentonHTML.Let'sattempt todecodetheacronymnow:
•Cascading:FallingintoOldHabits
•Sheets:Writinginvariousdocumentsusingourstyle
3. CONCLUSION:
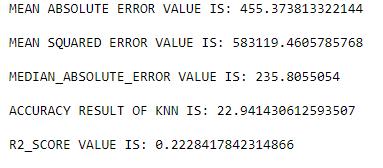
Customers may buy a range of products and services from Amazon.com, Inc. Through its shops, customers may purchase goods from both its own third-party sellers and thoseithasboughttoresell.Additionally,itmanufactures and sells electrical equipment. The project's primary objectives are to determine accuracy, reduce mistake rates, and obtain results from deployment. Data cleansing and processing, missing value analysis, exploratory analysis,andmodelcreationandassessmentcamenextin theanalyticalprocess.Thebestaccuracyonthepublictest set with the highest accuracy score will be discovered. By employing the algorithm with the highest degree of accuracy,thiscanassistindeterminingtheAmazonStock Price.
4. FUTURE WORK:
To link the AI Model, forecast the price of Amazon.com. Thisproceduremaybemadeautomatedbydisplayingthe prediction results in a desktop or online application. To more efficiently do the job that has to be done in an AI environment.
REFERENCES
[1] Raymond Chiong , Zongwen Fan, Zhongyi Hu, and Sandeep Dhakal “A Novel Ensemble Learning Approach for Stock Market Prediction Based on Sentiment Analysis and the Sliding Window Method”,2022.
[2] T. Fischer and C. Krauss, “Deep learning with long short-term memory 600 networks for financial market predictions,” Eur. J. Oper. Res., vol. 270, 601 no.2,pp.654–669,Dec.2017.602
[3] X. Wu, Q. Ye, H. Hong, and Y. Li, “Stock selection modelbasedon603machinelearningwithwisdomof expertsandcrowds,”IEEEIntell.604Syst.,vol.35,no. 2,pp.54–64,Mar.2020.605
[4] M. Jiang, L. Jia, Z. Chen, and W. Chen, “The two-stage machine 606 learning ensemble models for stock price prediction by combining 607 mode decomposition, extreme learning machine and improved har- 608 mony search algorithm,” Ann. Oper.Res.,vol.309,pp.553–585,609Jun.2020.610
[5] D. C. Furlaneto, L. S. Oliveira, D. Menotti, and G. D. C. Cavalcanti, 611 “Bias effect on predicting market trends with EMD,” Expert Syst. Appl., 612 vol. 82, pp. 19–26,Oct.2017.613
[6] I.E.Fisher,M.R.Garnsey,andM.E.Hughes,“Natural language 614 processing in accounting, auditing and finance: A synthesis of the 615 literature with a roadmap for future research,” Intell. Syst. Accounting, 616 Finance Manage, vol. 23, no. 3, pp. 157–214, Jul. 2016.617
[7] G. G. Creamer, “Network structure and market risk in the Euro- 618 pean equity market,” IEEE Syst. J., vol. 12,no.2,pp.1090–1098,619Jun.2018.620
[8] S. Feuerriegel and J. Gordon, “Long-term stock index forecasting based 621 on text mining of regulatory disclosures,”Decis.SupportSyst.,vol.112,622pp.88–97,Aug.2018.623
[9] T. Geva and J. Zahavi, “Empirical evaluation of an automated intraday 624 stock recommendation system incorporating both market data and textual 625 news,” Decis. Support Syst., vol. 57, pp. 212–223, Jan.2015.626
[10] F. Z. Xing, E. Cambria, and R. E. Welsch, “Natural language based 627 financial forecasting: A survey,” Artif. Intell. Rev., vol. 50, no. 1, 628 pp. 49–73, Jun. 2018.629
[11] K. Yuan, G. Liu, J. Wu, and H. Xiong, “Dancing with Trump in the 630 stock market: A deep information echoing model,” ACM Trans. Intell. 631 Syst. Technol., vol.11,no.5,pp.1–22,Oct.2020.632
[12] K. Nam and N. Seong, “Financial news-based stock movement prediction using causality analysis of influence in the Korean stock market,” 634 Decis. Support Syst., vol. 117, pp. 100–112, Feb. 2019. 635
[12] J. Nikkinen and J. Peltomäki, “Crash fears and stockmarketeffects:636Evidencefromwebsearches and printed news articles,” J. Behav. 637 Finance, vol. 21,no.2,pp.117–127,2019.638
[13] S. Evert et al., “Combining machine learning and semantic features in 639 the classification of corporate disclosures,” J. Log., Lang. Inf., vol. 28, 640 no. 2, pp. 309–330, 2019. 6M. Young, The Technical Writer’sHandbook.MillValley,CA:UniversityScience, 1989.
[14] E. Saquete, D. Tomás, P. Moreda, P. Martínez-Barco, and M. Palomar, 643 “Fighting post-truth using natural language processing: A review 644 and open challenges,” Expert Syst. Appl., vol. 141, Mar. 2020, 645Art.no.112943.646
[15] N. Seong and K. Nam, “Predicting stock movements based on financial 647 news with segmentation,” Expert Syst. Appl., vol. 164, Feb. 2021, 648 Art. no. 113988.649
[16] R. Chiong, G. S. Budhi, S. Dhakal, and F. Chiong, “A textual-based 650 featuring approach for depression detection using machine learning 651 classifiers and social media texts,” Comput. Biol. Med., vol. 135, 652 Aug.2021,Art.no.104499.653
[17] S.F.A.Zaidi,F.M.Awan,M.Lee,H.Woo,andC.-G.Lee, 654 “Applying convolutional neural networks with different word repre655 sentation techniques to recommend bug fixers,” IEEE Access, vol. 8, 656 pp. 213729–213747,2020.657
[18] S.M.A.Islam,B.J.Heil,C.M.Kearney,andE. J.Baker, “Protein 658 classification using modified n-grams andskip-grams,”Bioinformatics,659vol.34,no.9,pp. 1481–1487,May2018.660
[19] S. Yilmaz and S. Toklu, “A deep learning analysis on question classi661 fication task using Word2vec representations,” Neural Comput. Appl., 662 vol. 32, pp.2909–2928,Jan.2020.663
[20] J. Lilleberg, Y. Zhu, and Y. Zhang, “Support vector machines and 664 Word2vec for text classification with semantic features,” in Proc. IEEE 665 14th Int.
Conf. Cognit. Informat. Cognit. Comput. (ICCI*CC), Jul. 2015,666pp.136–140.667
[21] Y.Qiu,H.-Y. Yang, S.Lu, and W. Chen,“A novel hybrid model based 668 on recurrent neural networks for stockmarkettiming,”SoftComput.,669vol.24,no.20, pp.15273–15290,2020.670
[22] T.Young,D.Hazarika,S.Poria,andE.Cambria,“Recent trends in 671 deep learning based natural language processing,”IEEEComput.Intell.672Mag.,vol.13,no. 3,pp.55–75,Aug.2018.673
[23] M. Kraus and S. Feuerriegel, “Decision support from financial disclo674 sures with deep neural networks and transfer learning,” Decis. Support 675 Syst., vol. 104,pp.38–48,Dec.2017.676
[24] A.Atkins,M.Niranjan,andE.Gerding,“Financialnews predicts stock 677 market volatility better than close price,” J. Finance Data Sci., vol. 4, 678 no. 2, pp. 120–137,Jun.2018.679
[25] Y. Liu, Y. Chen, S. Wu, G. Peng, and B. Lv, “Composite leading search 680 index: A preprocessing method of internet search data for stock trends 681 prediction,” Ann.Oper.Res.,vol.234,no.1,pp.77–94,Nov.2015.