The Simulation and Economic Analysis of Palm Oil Empty Fruit Bunches Gasification as Renewable Energy
 Muhammad Farizan Praevia1 , Widayat2 , Endang Kusdiyantini3
***
Abstract - Riau Province, the highest palm oil production in Indonesia has 10,270,149 tonnes ofplantation, in2.895 million hectares area. Empty fruit bunches (EFB) are one of the byproducts of palm oil plantations and refineries that are not utilized. EFB waste impacts on increasing carbon emissions. The Empty fruit Bunches can be utilized as a new renewable energy source with gasification technology. Gasification is a thermochemical process by which carbon in fuel is converted into a combustible gas, known as syn-gas. Modeling of gasification fueled by shredded empty fruit bunches can produce an electricity capacity of 152 MW. The operation parameters by simulationusingAspenPlus software, consist of gasification temperature: 800 °C; Equivalent Ratio (ER): 0.2; and moisture content: 30% producing syn-gas with a calorific value of 21.87 MJ/kg. The syn-gas consists of H2 25.78%; CH4 8.31%; CO 20.25%; CO2 21.62%; H2O 16.47%. By the feasibility analysis, the investment cost of the power plant is IDR 2,750,015,292,173, with an interest rate of 15%, the investment cost can be returned in 3 years with IRR value of 47.68%..
Key Words: empty fruit bunches, gasification, syn-gas, biomasspowerplant
1. INTRODUCTION
Indonesia's commitment contributes to global climate changedeclaredinParisAgreement,withatargettoreduce greenhousegasemissionsby29%in2030.Thistargethas been outlined in the National Energy General Plan by increasingtheenergymixofNewandRenewableEnergyby 23 % in 2025 [1]. One of the solutions to increase the percentage of renewable energy is by using biomass gasification.Gasificationisathermochemicalprocesswhich carbonfuel isconvertedintoa combustiblegas,known as syn-gas(synthesisgas).
Syn-gascanbeuseddirectlyasgasturbinefuelorasa rawmaterialforchemicalindustries.Syn-gasfuelconsistsof hydrogen (H2), carbon monoxide (CO), methane (CH4), carbondioxide(CO2),watervapor(H2O),nitrogen(N2),tar, ammonia (NH3), hydrogen sulphide (H2S) and hydrogen chloride(HCl).Thisprocessoccurswhenseveral oxidants consistingofpureoxygen,air,andsteamarereactedathigh temperatures withcarbonandfuel in the gasifier [2]. The
stages of the gasification process can be divided into: (1) dryingstage(at100-200°C),(2)pyrolysisstage(at200-500 °C),(3)gasificationandcombustionstages(at500-1000°C). Gasification aims to convert liquid and solid fuels into flammablegasusingareactorcalledagasifier.Agasification systemconsistsofagasificationreactorequippedwithfuel pre-treatmentandgasconditioning[3].
ThisresearchusesRiauProvince,Sumatera,Indonesiaas an object. Based on data from 2019-2021, issued by the MinistryofAgricultureoftheRepublicofIndonesia,Riauis theprovincewiththehighestlevelofpalmoilproduction, reaching 10,270,149 tonnes palm oil which is planted on 2.895millionhectaresofland.EmptyFruitBunches(EFB) are the largest solid waste from plantations and palm oil refineriesthatarecurrentlynotutilized.Comparewiththe palm shell, it can be directly burnt an biomass boiler, but EmptyFruitBunchesarestillnotbeingusedmassively.EFB identifytobeusedasfuelbecauseithasconsistedofcalorific valueby17.02MJ/kg[4].
Gasification technology can be used as an option for utilizing EFB in Riau Province. The biomass gasification process can be modelled with Aspen Plus software. Modellingisneededtogetoptimaloperatingconditionsof gasification.Theoptimalconditioniswhenthegasproduces fewerimpuritiesandincreaseefficiencyintheprocess.The mainoperatingconditionsstudiedinthisresearchsuchas: gasificationtemperature,biomassmoisture,andEquivalent Ratio(ER).Furthermore,thesyn-gaswhichistheproductof gasification is reviewed in terms of the net energy value (MW) produced. Energy value is then analysed for the economicfeasibilityofestablishingabiomasspowerplantin RiauProvinceandthepotentialcalculationforreducingCO2 emissions.
2. RESEARCH METHOD
2.1. Empty Fruit Brunches Analysis
Solid fuel quality is measured using three types of analysis; heating value, proximate analysis, and ultimate analysis.TheEFBquality[4]showedonTable1.DataofEFB usedthathavebeenchoppedwithashreddermachinewitha sizeof10-25cm.Thequalitywillbeusedforsimulation.
Table -1: EmptyFruitBunchesAnalysis
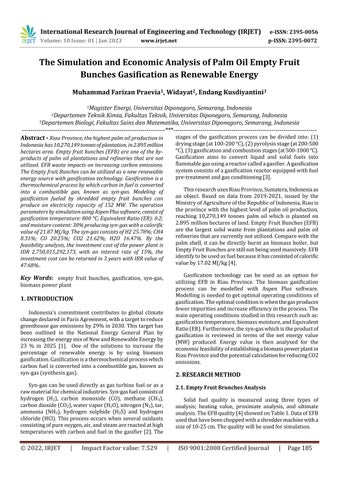
Rusydy [7]. Gasification process used consists of the decompositionofemptyfruitbunches,combustionofvolatile matters, char gasification, and gas-solid separation. The producergascomingoutofthegasifieriscleanedofsolids contained in the feed and those formed during the gasificationprocessusingaseparator.Inthismodeling,airis used as a gasifier agent to show the most optimum conditions.
2.2 Gasification Modelling using Aspen Plus
The software used for modelling is Aspen Plus V.10, a product from Aspen Tech. Research was carried out in several stages, starting with the pre-research, conducting literaturestudiesrelatedtobiomassandgasification,andthe simulationstagebymodelingusingtheAspenPlusprogram togetoptimumsyn-gasconversion.Theoptimumvalueisthe valueofthesyn-gascompositionwiththehighesttheoretical HHVvalue(MJ.kg-1)usingempiricalequations.
Gasification temperature is one of the most influential factorsingasificationprocess.Attemperatureabove750-800 °C,theendothermicreactionoftheH2(steamreformingand water-gas reactions) produce H2 production and the reduction of CH4 content with increasing temperature [2]. While Equivalent Ratio is related to air flow which affects gasificationproducts.Airsupplies,O2forcombustion(inthe caseofafluidizedbed)willaffectedtotheresidencetime.By the variation of O2 supply, the air flow rate controls the degreeofcombustionwhich,inturn,affectsthegasification temperature[5].Biomassmoisturerelatedtotheamountof watercontainedinthebiomassmaterialthatisfeedintothe gasifier.Thehigherthemoisturecontent,thegreatertheair requirementusedtodrythebiomass.Thevariationsusedin thisstudyconsistedof:Gasifiertemperaturevariedfrom600800°C[2],EquivalentRatio(ER)0.15-0.30kg/kg[6],and moisture 20-40 % (data taken ± 10% from laboratory results).
Biomass gasification model used the sub dryer and gasificationmodelsdescribedonKGEngineeringSolutions research andsomeliterature from modelingconductedby
2.3. Techno-Economic Analysis
Afterobtainingoptimalconditionswiththehighestyield of syn-gas,techno-economic calculations were carried out. The calculation is expected to get a power plant model. Calculationofgeneratedpowercapacityneedstoknowthe efficiency of the power plant technologyused[8]. Technoeconomic analysis starts with determine the gasification technology: to be able to calculate the investment cost. Capitalbudgetinganalysiscanbeusedtoassesswhethera projectisacceptableornot.Themainanalysiswascarried out onthenet presentvalue(NPV),internal rateof return (IRR),andpaybackperiod(PBP).CalculationofNPV,IRR,and PBPusingequations(1),(2),(3).
(1)
CFo:fixedcapitalcost,CFt:cashinflow,i:interestrate If NPV>0,higherreturnrate.
(2)
Xt : Cash flow on year-t, IRR: . Rate of Return. If IRR>CFo, projectaccepted.
(3)
ThehigherPBPaccepted,theprojectwillbeexecuted
3. RESULT AND DISCUSSION
3.1. EFB Gasification Simulation
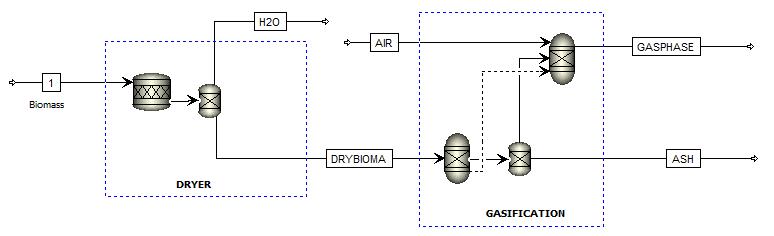
Equivalent Ratio (ER) is the ratio between the actual airflowrequiredforbiomasscombustion.Airflowratewill control the degree of combustion, this will affect to the gasification temperature setting. In this study, the ER variationwas0.15-0.30atatemperatureof800°Cand30% moisture.Chart-2showstheCO2 concentrationinthesyngasproductisdirectlyproportionaltotheEquivalentRatio (ER), the higher the ER (0.35), the higher the CO2 concentration. The ER value indicates the more carbon combustionprocess,becauseitproducesmoreCO2andthis causesadecreaseinCOconcentration.WhileH2deficiencyis caused by the water gas shift reaction which affects the decreaseinH2 concentration.ThehighestH2 valueisatthe ER value of 0.15 of 21.57%. Equivalent Ratio (ER) significantlyaffectsthesyn-gascomposition.Theadditionof O2willcausedmoreoxidationheat,sothatwhenmoregas goestopyrolysisatthemouthofthegasifier,thepyrolysis temperaturewillrise[9]
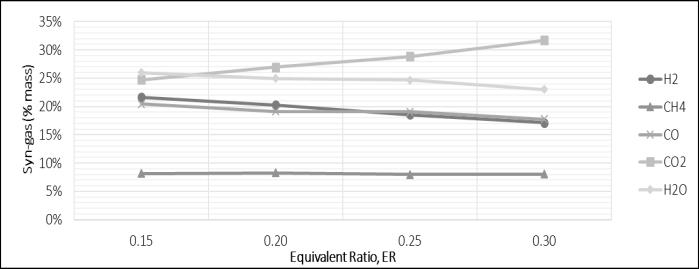
Gasificationisanendothermicreaction,theconversionof gascompositionisstronglyinfluencedbythetemperature changevalue.Basedonthesimulationresultswithconstant ERandmoisturevalues,itwasfoundthattheconcentration ofH2wasincreasing,achievingthehighestconversionat800 °Cof25.78%(Chart-3).COconcentrationdecreased(20.2920.25%)althoughnotsignificantlyinthetemperaturerange (600-800°C).TheconcentrationofCO2decreases(21.62%) withincreasing temperature(600-800 °C) because higher temperatureisgoodforendothermicreactionsformingCO fromCO2 (Boudouardreaction).
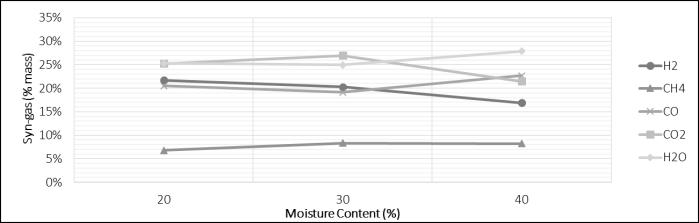
Theincreasingofmoistureinemptybuncheswillcause thegasificationtemperaturedecrease.Thisconditionoccurs due to the reduction of heat for endothermic gasification reactions. The heat uses for evaporate water in raw materials [7]. Gasification process itself should be maintainedatatemperatureabove600°C.Thesimulation resultsatvariationsinmoisturecontentof20,30,40%show thehighestH2conversionrateat20%moisturewith21.71% H2 (Chart-4).
3.2. Techno-Economic Analysis
An optimum syn-gas composition was obtained at an averageHHVof20.53MJ.kg-1(calculatedfromsyn-gasyield with empirical equation). The operating gasifation parameterswithER=0.2,gasificationtemperature=800°C, andmoisture=30%.TheresultingofHHVorcalorificvalue is used to calculate the generated power capacity. In this study,gasificationefficiencyon75.15%[8].
The electrical energy generated from the generator is calculatedbytheheatrate(HR).HeatRateisobtainedonthe basisofemptyfruitbunch480tonsperday.Heatratevalue generatedbythegasificationisassumedtobethegenerated electricpower,whichisreferredtoastheGrossPoweron 152MW.Withthereductionofinternalpowerneededfor generation by 25%, the rest 75% will sell to the national power plant unit. Details of the cost of investment and operational cost of Biomass Power Plant with gasification technology capacity of 152 MW are shown in Table-2 and Table-3.
Economicanalysisisorientedtotheamountofprofitso thatitattractsinvestorsininvesting.Theassumptionsused inthecalculationsareasfollows:
1.InstalledCapacity:152MW
2.BankLoanInterestRate:15%
3.CapacityFactor:80%
4.BookLifeofInvestment(n):15years
5.Constructiontime:1year
6.RawMaterials:EFB
7.InvestmentCost:IDR2,750,015,292,173
Theamountofincomeperyear/CashinFlow(CIF)canbe calculated from the kWh output multiplied by the selling price of electricity to PT PLN (Persero) (Indonesian government-ownedcorporationwhichhasamonopolyon electricpowerdistributioninIndonesia).BasedonMinister
ofEnergyandMineralResourcesregulation,forpowerplant withcapacitiy>50MW,thesellingpriceofelectricitytoPLN: 10.80centsUSD.kWh-1,sothesellingpricetoPLN:1925.10 Rp.kWh-1.Withtotalelectricitysaleis75%ofthecapacity, an annual income of IDR 1,260,502,319,379 is obtained. WhilethetotalinvestmentcostIDR2,750,015,292,173and O&McostperyearIDR129,272,336,428.
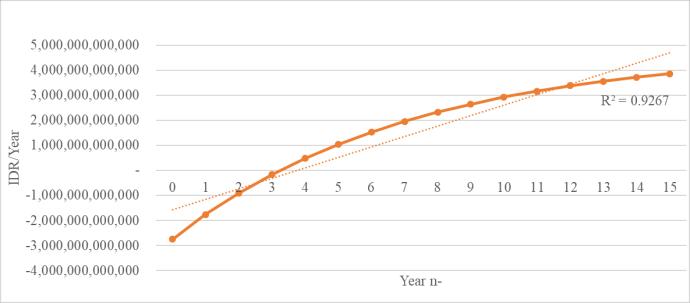
Net Present Value (NPV) is calculated by minus the project initial investment (CFo) from the present value of cashinflow(CFt)oninterestrate(i).NPVinthefirstyearis (-) means the investment is not feasible. The NPV is calculated by using equation (1) describe on Chart-5. In trend, the NPV shows (+) in 4th year. So that the Biomass PowerPlantisfeasibletobeestablished.
TheInternalRateReturn(IRR)iscalculatedusingequation (2).
(1+i%)15 =2.431
WithusingCompundInterestFactortabledeterminedi= 47,58%. So IRR value = 47,58% > 15%, investment is feasible.
WhiletheresultofPayBackPerioddescribesonTable-4. With the selling price energy 1925.10 IDR.kWh-1 PBP achieveson3years
Table -4: PayBackPeriodResult
4. CONCLUSION
TheconceptofWastetoEnergy,byEmptyFruitBunches canbeutilizedforgeneratingelectricitywithcapacity152 MWusingthegasificationmethod.TheAspenPlussoftware succeeds showing the most optimal condition for the gasification process of empty palm fruit bunches with the main operating parameters measured: (a) Gasification temperature = 800 °C, (b) Equivalent Ratio = 0.2, (c) Moisture=30%.Thoseparameterswill producesynthetic gaswithaheatingvalue,HHVof21.87MJ/kg.Thesyn-gas produced consists of 25.78% H2, 8.31% CH4, 20.25% CO, 21.62% CO2, 16.47% H2O. The techno-economic analysis shows that with the investment cost of IDR 2,750,015,292,173atinterestrateof15%, theinvestment canbereturnedin3yearssothattheinvestmentisfeasible tobeestablishedwithanIRRvalueof47.68%.
REFERENCES
[1] Indonesia Energy Outlook (2020). Dewan Energy Nasional.
[2] Doherty, W., Reynold, A., Kennedy D. (2013). “Aspen Plus Simulation of Biomass Gasification in a Steam BlownDualFluidisedBed,Materialsandprocessesfor energy: communicating current research and technological developments”, A. Méndez-Vilas(Ed.), FormatexResearchCentre.
[3] Waliul,MD.(2020).“Effectofdifferentgasifyingagents (steam, H2O2, oxygen, CO2, and air) on gasification parameters”,InternationalJournalofHydrogenEnergy 45(2020) pp 31760- 3 1774. https://doi.org/10.1016/j.ijhydene.2020.09.002
[4] Novianti, S., M. Biddinika, P. Prawisudha and K. Yoshikawa.(2014).“UpgradingofPalmOilEmptyFruit BunchEmployingHydrothermalTreatmentinLab-scale andPilotScale”,ProcediaEnvironmentalSciences20( 2014),pp46–54.
[5] Panda, C. (2012). “Aspen Plus Simulation and Exsperimantal Studies on Biomass Gassification. NationalInstituteofTechnology”,Rourkela.
[6] Motta, I.L, Marchesan, A.N, Filho R., Maciel, MR.W. (2022). “Correlating biomass properties, gasification performance, and syngasapplications of Brazilian feedstocks via simulation and multivariate analysis”, Industrial Crops & Products 181 (2022) 114808 .https://doi.org/10.1016/j.indcrop.2022.114808
[7] Rusydy.(2017).“SimulasiGasifikasiSludgeLimbah IndustriPulpDanKertasSebagaiAlternatifEnergi BaruTerbarukan”,TeknikKimiaUniversitasRiau.
[8] Azmi,Muhyiddin.(2014).“AnalisisTeknikdanEkonomi Pemanfaatan Biomassa Sebagai Pembangkit Energi ListrikdiSurabaya”,TeknikFisikaITS,Surabaya.
[9] Mehrdokht B.N., Nader M. (2008). “Simulation of biomass gasification In fluidized bed reactor using ASPENPLUS”, Elsivier,BiomassAndBioenergy32, 245
254.
