International Research Journal of Engineering and Technology (IRJET)
e-ISSN: 2395-0056
Volume: 12 Issue: 05 | May 2025
p-ISSN: 2395-0072
www.irjet.net
IMPROVEMENT OF FUEL CONTROL UNIT PRODUCTION EFFICIENCY: A VALUE STREAM MAPPING AND SIMULATION APPROACH FOR BOTTLENECK IDENTIFICATION AND OEE ENHANCEMENT Muthukkumar S M1, Parthiban M2 1 PG Scholar, Department of Mechanical Engineering, PSG college of Technology, Coimbatore, Tamil Nadu 2Assistant professor, Department of Mechanical Engineering, PSG college of Technology, Coimbatore, Tamil Nadu
---------------------------------------------------------------------***--------------------------------------------------------------------1.2 LITERATURE REVIEW
Abstract - This journal paper improves FCU manufacturing at ABC Company, doubling production from 35,000 to 50,000 units/month by maximizing OEE and removing bottlenecks in die casting, trimming, and leak testing. VSM and simulation uncover inefficiencies, which direct improvements in machine availability, performance, and quality. Reducing processes ensures scalable, high-quality manufacturing to meet demand cost-effectively. Key Words: FCU, OEE Elimination, Process Improvement
A surgical database comparing F1-score and area under the curve. Although health-focused, their methodology can be beneficial to FCU production through enhanced defect prediction and quality testing. Gupta, Jain & Mehta (2019) showed how simulation and lean implementation improve manufacturing performance, i.e., enhance OEE and VSM. Their research directly supports improving FCU production efficiency.
Optimization, Bottleneck Efficiency, Throughput
Johnson, Brown & Jones (2018) reviewed VSM's effect on lean manufacturing and proved its efficiency in minimizing waste, cycle time, and resource usage. This technique is advantageous to high-output industries such as FCU production.
1.INTRODUCTION Efficiency is paramount in the sketch of FCUs. ABC Company, which produces 35,000 units/month through die casting, blends VSM and simulation in real-time optimization. (Z. DeVries. Et al., 2021) This forecast method improves manufacturing, optimizes operations, and guarantees longterm viability.
Kareem, Benin & Mohammed (2022) combined VSM and simulation for lean manufacturing to achieve notable OEE enhancements. Their approach is transferable to FCU manufacturing for better process effectiveness. Kumar, Narayan & Gupta (2020) highlighted VSM's contribution to efficiency in production by minimizing cycle time and maximizing productivity. Their findings find themselves in great harmony with FCU production optimization.
2. METHODOLOGY 2.1 OBJECTIVE Increasing FCU Production to 50,000 Units/Month involves cutting bottlenecks through automation of die casting, optimized post-casting flow, and upgrading leak testing. Scaling involves efforts on resource deployment, technology upgrades, and workflow optimization for continued efficiency. (V. Kumar. Et al., 2021)
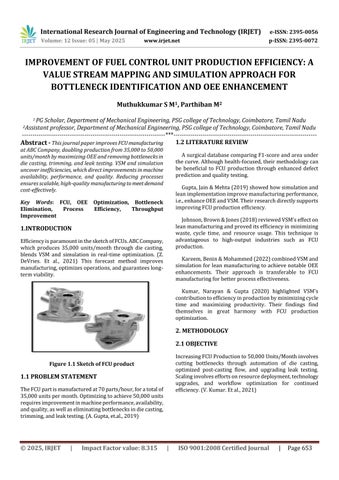
Figure 1.1 Sketch of FCU product
1.1 PROBLEM STATEMENT The FCU part is manufactured at 70 parts/hour, for a total of 35,000 units per month. Optimizing to achieve 50,000 units requires improvement in machine performance, availability, and quality, as well as eliminating bottlenecks in die casting, trimming, and leak testing. (A. Gupta, et.al., 2019)
© 2025, IRJET
|
Impact Factor value: 8.315
|
ISO 9001:2008 Certified Journal
|
Page 653