
International Research Journal of Engineering and Technology (IRJET) e-ISSN: 2395-0056 p-ISSN: 2395-0072

Volume: 12 Issue: 03 | Mar 2025 www.irjet.net

International Research Journal of Engineering and Technology (IRJET) e-ISSN: 2395-0056 p-ISSN: 2395-0072
Volume: 12 Issue: 03 | Mar 2025 www.irjet.net
Nenturi Vedha Sri1 , Dharavath Vandhana2 , Koukuntla Sneha3 , Dr M V Krishna Rao4
1,2,3B. Tech Student, Dept. of Computer Science and Engineering (Data Science), Institute of Aeronautical Engineering, Telangana, India
4Professor, Dept. of Computer Science and Engineering (Data Science), Institute of Aeronautical Engineering, Telangana, India
Abstract - This study analyzes the trends of global health expenditures including patterns of the real gross domestic product (GDP) and health expenditures as a percentage of GDP for almost 200 countries in 2000 and 2022 . Principal component analysis was adopted to reduce dimensionality, therebydiscerningthemajorexpenditure-influencingfactors and simplifying the complexity of the dataset. It aided in understanding variable importance, which was useful in furtherpredictivemodeling.Fourwaysforforecastinghealth expenditures were employed: AR (Autoregressive), MA (Moving Average), ARMA, LSTM (Long Short-Term Memory) networks. The AR and MA gave strong statistical assertions about past and recent trends, while ARMA was a hybrid method that combined autoregressive and moving average components to fit more complex time-dependent structures withinthedata.whilethe LSTMmodellearnedthelong-term dependencyandnon-linearrelationshipsexistinginthedata.
Two distinct LSTM models, Uni-variable (UV) and Multivariable(MV),were developedbasedonvariousindicators of healthcare expenditure. A comparison of these methods indicated the strength ofeach ofthe methods incontext with performance, shedding light on how both traditional statistical methods and deep learning techniques may be successful inpredictive analytics.
Keywords Principal Component Analysis, Dimensionality reduction, Healthcare Spending Patterns, Long Short-Term Memory, Autoregressive Model, Moving Average Model.
Health care spending acts as a key determinant for the capacityofthehealthsystem,theresilienceoftheeconomy, andthegeneralstateofpublicwelfareinanation.Funding streamsinahealthcaresystemarefundamentallyessential in shaping access to medical services, infrastructural development,andadvancementinmedicalresearch.Oneof themostimportantfinancialindicatorsisCurrentCHE_GDP: Health Expenditure as a percentage of GDP; indicates the levelofrelativeinvestmentacountryis making inhealth
care.ThisstudywillfocusonanalysingandforecastingCHEGDP trends in about 200 countries starting from 2000 to 2022 to fathom a clear picture of the global health care financingframework.

Overthe lasttwodecades,thelandscapeofglobalhealthhas witnessed multiple transformations expenditure due to economic dynamics, population aging, technological advancements, inflation in healthcare, and public health crises like COVID-19. These changes have warranted the need for further analytical techniques to uncover expenditure trends, advocate financial sustainability, and assess future scenarios. For government officials, researchers, and health institutions, such knowledge provides a basis to enhance resource allocations, improve financialplanning,andsustainhealthsystemsinthefuture. DataiscollectedfromtheWorldHealthOrganization(WHO) Global Health Expenditure Database, providing data for nearly200countriesbetween2000and2022.Thisdataset covers all aspects related to government and private contributions toward health, per capita expenditure, and other economic trends concerning the global healthcare systems.Thesizeandintricacyofthedatasetofferavariety ofvariablesandcorrelationsthatareoutsidethepurviewof traditionalanalysisinordertocomprehendtheprocessof deriving meaning from the data. Since the data are highdimensional by nature, identifying the key variables influencing healthcare spending presents both a problem andanopportunityforsophisticatedmethodologies.
Duetothehighdimensionalityandcomplexityofthedata presented in this study, they have been analysed using PrincipalComponentAnalysis(PCA)toreduceduplication without sacrificing the most significant factors affecting changes in CHE_GDP. PCA decreases the difficulty of data interpretation by naming key contributors to healthcare spending change trends while sustaining the fundamental structureofthedata.
ToperformtheforecastingoffutureCHE_GDPvalues,four different predictive modeling techniques were applied Autoregressive(AR)ModelsUsingpastvaluesofCHE_GDPto predict future trends based on time-dependent relationships. Moving Average (MA) Models are utilizing methods that capture short-lived deviations concerning
healthcare expenditure from smooth past variations. Autoregressive and Moving Average (ARMA) Model with both autoregressive and moving average components, modelingcurrentCHE_GDPbasedonpastdependenciesand short-run changes. Since then Long Short-Term Memory Networks (LSTMs) with Deep learning-based were

International Research Journal of Engineering and Technology (IRJET) e-ISSN: 2395-0056 p-ISSN: 2395-0072
Volume: 12 Issue: 03 | Mar 2025 www.irjet.net
introducedtocapturelong-termdependenciesandnonlinear patternsintime-seriesdata.WhiletheclassicalAR,MAand ARMAmodelsmayhavehelpedonederivecertainstatistical. conclusions about past spending behavior, they poorly capturecomplexlong-termrelationships;thislimitationis addressed in the scope of this study through the implementation of univariate and multivariate LSTMs. Univariate LSTM will extrapolate future CHE_GDP from previous records. Multivariate LSTM will exploit other additionaleconomic-andhealthcare-relatedvariablessuch asgovernment-andprivate-sectorhealthcarecontributions topredictmoreaccurately.
[3]Toexaminehealthexpenditureworldwide,theexisting system mostly uses a statistical and descriptive approach anddoesnotdeal well withtherelationsanddynamicsof healthexpenditureissues.Withtheircrudemeasuringunit, traditional methods can hardly reveal patterns or make comparisons between countries nuanced. The existing system estimating global health expenditure is based on inter-countrydomestichealthexpenditureevaluationsfor 195countriesandterritoriesandencompassesthreemain funding sources, that is, expenditure incurred by government,privatelyfinancedout-of-pocketspendingand pre-paidprivatehealthspending.datafrom195countries from1995to2016,aswellasDAHdatafrom1990to2018, toestimatetrendsinglobalhealthspending.Italsoincludes developmentassistanceforhealth(DAH)over1990–2018. Thisapproach,throughmodellinguncertainty,createsthe dataset necessary to estimate total health expenditure categories and DAH despite a variety of issues presenting challenges in assembling complete or really good quality thus supporting the health financing transition theory. Futurescenariosforhealthspendinghavebeenforecasted using linear mixed-effects models, all having time series specifications These predictors have been drawn from national health accounts, budget reports, and revenue trackingsystemsafterstandardizationandconversionfrom inflation-adjusted2018USdollars.
[8]ThestudybyMuremyietal.(2018)examinesamassive exercise in predicting out-of-pocket health expenditure in Rwandausingavarietyof machinelearningalgorithms.The authorsintroducedarangeofmodels,includingmultivariate adaptiveregressionsplines(MARS),decisiontrees,random forests,gradientboosting,andtreenet.Themodelwiththe highest accuracy of 87% was produced out of the above denotingatreenetmodel.Oneofthemajorpredictorsforall modelsinvestigatedisthetotalconsumptionofhouseholds intermsofhouseholdconsumption.Therefore,itsrelevance
inpredictinghealthcostsissignificant,asthisinformation willbecrucialforpolicyformulationonhealthcarefinancing, particularlyintermsofincreasingdomesticpublicbudgets toattainUniversalHealthCoverage(UHC).However,there
arecertaindownsidestothestudy.Ittakesasingledataset of14,580households(EICV5)andhencedoesnotrepresent the general population or address its geographical differences across the country. Moreover, although the modelspredictedwell,itdoesnottakeaccountofpossible issuesofinterpretabilityinthemodels,asthiswouldlimit knowinghowandwhysomeofthemostrelevantpredictors, i.e.householdconsumption,aresopowerful.
[9]Thisexistingresearchdeepensone'sunderstandingof thecomplex(1)the effectofpublichealthexpenditureon health status; (2) the role of health status in influencing economic development.Healthadvancementsincreaselabor productivityand,consequently,economicgrowth,according to Bloom and Canning (2000) and Weil, (2007). In the Nigeriacontext,however,AnyanwuandErhijakpor(2009) find that increased health expenditure translates directly intobetterhealthoutcomeswhereasAregbesolaandKhan (2018) contend that poor funding makes health less impactfultothewidereconomy.Seer's,(1972),ThreePillars model;thepoverty,inequality,andunemploymentarethen blendedasanEconomicDevelopmentIndexalongsidethe techniquesofPrincipalComponentAnalysis-PCA,through FilmerandPritchett,(2001).Thosemodelshavebeenwidely used in methodology in simultaneous equation models. Baldacci et al. (2008) and Barro (1996) show a health expenditureindirectimpactoneconomicgrowthviahealth status usingsuchmodels,whereasAcemogluand Johnson (2007) argued on the direct effect on GDP. Advanced econometricssuchasThree-StageLeastSquares(3SLS)by ZellnerandTheil(1962)improvedefficienciesinestimation byeliminatingendogeneityandsimultaneityproblems.This study, therefore includes a new Economic Development Index(EDI)aswellasHealthStatusIndexdevelopedusing PCAwithsimultaneousequationmodelingbywayof3SLS estimation for a holistic view of Nigeria's health-economy dynamic.
[11]This study covers global health financing trends for 184countriesbetween1995and2014.Healthexpenditures are estimated using programmatic the latest reports nationalestimatesand964NationalHealthAccounts.They were converted into currency adjusted using inflationadjusted purchasing power. Economic growth and health financingareinterrelated.,andtimeisestimatedusingnonlinear regression models. Results show that increase in economic development increases health expenditure," reducingrelianceonout-of-pocket(OOP)paymentsandaid whileincreasinggovernmentspending".Themostsignificant increasesinspendinghave occurredincountries withthe highest income. The contrasts for the lowest-income countries are that they continue to rely on OOP and aid. Although modest, aid growth has not eradicated the inequities in funding, thus pointing towards the need for effective strategic healthcare financing policies In low-
International Research Journal of Engineering and Technology (IRJET) e-ISSN: 2395-0056 p-ISSN: 2395-0072
Volume: 12 Issue: 03 | Mar 2025 www.irjet.net
incomecountries,out-of-pockethealthspendingaccounted for29.1%ofthetotalhealthspendingin2014,comparedto 58.0% in lower-middle-income countries. There exist variations in spending across different countries, the variations pointing to the fact that some countries exceed theirexpectationswhileothersfallshortoftheirgoals.These thingsindicatethateconomicgrowthdoesnotguaranteethe existenceofadequate pre-paidhealthresourcesand must necessarilyhavestrategicpolicyapproachesforcontinued andfairhealthcarefinancing.
[13]Prediction of health care costs is a field that has increasinglygainedattentionbecausecostsassociatedwith healthcarearerisingsofastthattheybecomeabudgetfor government expenditure and an individual's pocket. Traditional statistical methods in time series forecasting haveextensivelybeenused;however,overtime,moreand more machine learning techniques are being adopted by researchers because of their powerful ability to learn complexrelationships.Differentresearcheshaveeffectively applied their various models, including Support vector regression (SVR), decision tree regression (DT), and Gaussianprocessregression (GPR).SVRisknownforstrong generalizationpowerevenwithsmalldatasets,whileDTisa very interpretable means of prediction but is prone to overfitting.Onthecontrary,GPRasaprobabilisticmodelis abletoquantifyuncertainty,yetitscomputationalburdenis quitehigh.Determinantsofhealthcareexpenditureinclude economicindicatorssuchasGDPpercapita,unemployment rate; demographic factors like age and urbanization; and healthcaresystemparameterssuchasphysiciandensityand hospitalbedavailability.Amongmachinelearningmodels, studies have also indicated that SVR usually outperforms others in prediction accuracy; thus, it is an appropriate modelforpredictinghealthexpenditure.
3.1 Introduction
The procedure for forecasting global health expenditures passes through various stages, starting from the data collection and preprocessing activities of the WHO Global HealthExpenditureDatabase.Thedatasetwith4405rows and4120columnscleanedwasdonebyimputingthemedian value for missing data, followed by MinMaxScaler standardizationandfurtherdimensionalityreductionwith PCA(224componentsexplaining95%variance).
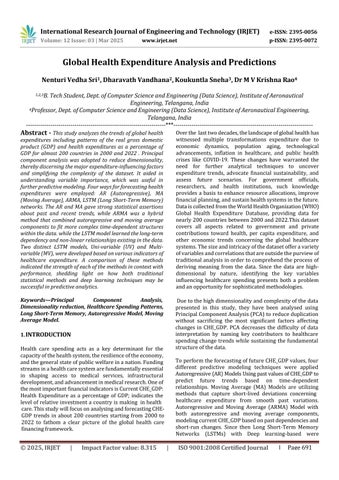
TheAugmentedDickey-Fuller(ADF)testwasperformedon CHE (% GDP) time series data to ascertain reliable timeseriesforecasting.Theresultsindicatedateststatisticof12.57 with a p-value of 1.97e-23, well below the 0.05 threshold, confirming stationarity of the series. The time series was analyzed by means of the rolling statistics analysis to observe the moving average and the standard deviation within the set timeframe. The rolling mean and rolling standard deviation results were interpreted to visualize trends and fluctuations over time. The rolling
meansshowagradualriseinhealthcareexpenditures,while therollingstandarddeviationhasdepictedstabilityexcept forsignificantfluctuationsaroundtheyear2020,possibly duetotheCOVID-19pandemic.
Training data upto the time of prediction is critical in tabulatingAutoregressive(AR),MovingAverage(MA),ARMA model.toensurepastdependenciesarecapturedeffectively intheprediction.ClassicalPartialAutocorrelationFunction (PACF)andAutocorrelationFunction(ACF)plotsandAkaike Information Criterion (AIC) and Bayesian Information Criterion (BIC). Alongside, deep learning approaches operated Univariate LSTM (predicting CHE_GDP using the past values) and Multivariate LSTM(leveraging additional economicindicatorslikeGDP,GGHE-D,PVTD,andEXT).Both LSTMsweredesignedwithmultipleLSTMlayers,Dropout, BatchNormalization,andOptimizerAdam,trainedwithan 80%train,20%testsplitover100epochs.
EvaluationmetricsincludeMAE,MSE,RMSE,andMAPEto benchmark AR, MA, ARMA, and LSTM models, while ReduceLROnPlateauwassuedtoenhanceconvergenceofthe model. The five years ahead forecast represents trends in CHE_GDPofdifferentcountries.Oncethemodelshavebeen trainedandevaluated,forecastsarepreparedforthenext5 yearsforeachcountry.Theseforecastsarethencompared withactualrecordeddatatodeterminethelevelofprecision andreliabilityoftheforecastproducedbythemodel.Finally, adetailedevaluationofthemodelsisconductedintermsof their ability to generate the trend of health expenditure projectionsovertime.
Data Collection and Preprocessing
Dimensionality Reduction using PCA

Model Identification
AR, MA, ARMA and LSTM Model Training

Evaluation of a Model
Prediction and Forecasting
3.2 Data Collection and Preprocessing
The dataset for this project contains data on health expenditure on global health for many different countries andovermanyyears.Itincludessuchvariablesascountry code,region,incomegroup,healthexpenditure(che),gghed ,pvtdetc.Thedataisbetweentheyears2000and2022and
International Research Journal of Engineering and Technology (IRJET) e-ISSN: 2395-0056 p-ISSN: 2395-0072
Volume: 12 Issue: 03 | Mar 2025 www.irjet.net
isdownloadedfromWHOdatabases,whichmakesitwellesteemed and complete. The first phase: Preprocessingpreparation, which cleans, formats the data, and removes missingdataandinconsistenciesinthedataset.Thisincludes handling missing entries and duplicate entries and converting categorical features (e.g., country, region) into numericals, which can be subsequently analysed. Feature Scaling Standardizes the dataset so that all features contributeequallytotheoverallperformanceofthemodel.
Because of the many features that are involved in the dataset, PCA is applied for dimensionality reduction and extractionofthemostrelevantcomponents.Essentially,for PCA,trivialfeaturesthatwillhelptoexplainvarianceinthe dataareidentifiedand,hence,facilitatethehandlingofthe smallerdatasetthatmaintainsallvitalinformation.Afterthe PCAtransformation,weretained224componentsthatare quiterepresentativeoftheunderlyingpatternsoftheglobal health expenditure data. PCA-generated components are used to study the relations and trends within the health expendituredata.
3.4 Forecasting with AR,MA,ARMA and LSTM.
Fortheforecastoffuturehealthexpendituresforindividual countries, we integrated a series of time series models, includingAutoregressive (AR),MovingAverage (MA),and LongShort-TermMemory(LSTM).
a)AR Model: AR Model: The prediction of future health spending(CHE_GDP)isdoneusinganAutoRegressive(AR) model whichisbasedonits pastvaluestherebyassuming linearitytoallthepreviousobservations.Inidentifyingthe orderoflag(p)forwhichUsingeachnation'sCHE_GDPdata, Akaike Information Criterion (AIC) and Bayesian InformationCriterion(BIC)wereexplored.Toidentifythis, AutocorrelationFunction(ACF)andPartialAutocorrelation Function (PACF) was then used relevant past values-the meaningfullastlag,accordingtoPACF,wasoptimalp. Foreachcountry,thedatasetwasfirstsortedbyyearand groupswereformedaccordingly.Theoptimallagorderfor theARmodelswasdeterminedbyfittingthemodelforlags of1through 5and identifyingthelagwiththelowestAIC andBICscore.Thedatawasthensplitintotrainingandtest sets in 80-20 proportions. The Auto Reg model was then developed using the CHE_GDP data history, whereas predictionwasexecutedtothetestset.Modelperformance wasthenmeasuredusingMeanAbsoluteError(MAE)and Root Mean Squared Error (RMSE). For future health expenditure forecasting, CHE_GDP was predicted for five years (2023-2027), with results stored in an Excel file. Finally, line plots were prepared to compare the actual values with predicted values, and future forecasts are presentedwithenhancedstylingforclarity.
yt=c+∑ϕiyt−i+ϵt(i.e:i=1top)
ytstandsfortheCHE_GDPattimet,cisaconstant,ϕiareAR coefficients,,pistheoptimallag,ϵ_tistheerrorterm.
b) MA Model: The Moving Average (MA) model captures random noise and smoothens out short-term fluctuations andisusedalongwiththeARmodel.TheMAmodelworks by deriving a relationship between the value of the series andpasterrorterms.Thus,itgivesasfollowsabouttheMA model-the present value is a linear combination of past errors:
yt=μ+∑θiϵt−i+ϵt(i.e:i=1toq)
Here,μisthemeanoftheseries,θᵢarethemovingaverage coefficients,qistheorderofthemodel,and ϵₜistheerror term.TheimplementedMAmodeltoforecastCHE-GDPwas the year-wise sorting of the dataset and grouping by each country. Thus, the optimal lag (q) for each country was ascertainedbyfittingMAmodelsofdifferentorders(from1 to5)intothedataandselectingtheonethatminimizesMAE. Datasetwasdividedintotraining(80%)andtesting(20%), andthemodelwastrainedusingthepasthistoricalvaluesof CHE_GDP.PredictionswereevaluatedusingMAE,RMSE,and MAPE,andthemodelwithoptimalperformancewasusedto forecasthealthexpenditureforthenextfiveyears(i.e.20232027).
c) LSTM Model: The health expenditure data has been sequenced to train The model employs three LSTM layers withrespectivesizesof128,64,and32units.Allthethree are architected to seize on the complexities inherent in temporal interrelations prevalent within the given data. Additionally,a30%dropoutrateisintroducedineachlayer to prevent overfitting while the inclusion of batch normalization is intended to enhance stability. The last output layer is a dense layer, with a single neuron that predictsthefuturevaluesofCHE_GDP.Themodelwasthen compiledusingtheAdamoptimizer,applyingMeanSquare Error(MSE) astheloss functionandMeanAbsoluteError (MAE) as a secondary performance measure. The LSTM modelsequencesarederivedfroma5-yearwindowofthe past. The dataset is split into two categories: 80% for trainingand20%fortestingforabalancedevaluation. Thebatchsizeof64ensuresthetrainingoftheLSTMmodel across 100 epochs, to enhance learning further. A ReduceLROnPlateaucallbackisintroducedtoautomatically changethelearningratewhenthereisnoimprovement in validationloss,makingtheconvergenceprocessbetter.The trainedmodelisthensuitedtorollingforecastingwherethe next5fyearsofhealthexpendituresarepredictedforeach countryinvolved.Hence,itassistspolicymakers'foresightof possiblefundinggaps,enablingthemtoallocateresources optimally.
MAE, MSE, RMSE, and MAPE are the evaluation indices whichareusedtomeasure theperformanceofthemodel. They are used as indicators of the level of precision and reliabilityofthemodelacrossthenations.
International Research
Volume: 12 Issue: 03 | Mar 2025 www.irjet.net
The time series data of CHE as % of GDP (chegdp) were subjected to the Augmented Dickey-Fuller (ADF) testemployedtocheckstationarity.Testyieldedastatistic of -12.57423 with p-value 1.97e-23, which is much lower than the 0.05 limit. The critical values for the tests at 1%, 5%, and 10% confidence levels stand at -3.4318, -2.8622, and-2.5671,respectively.Sincetheteststatisticvalueisless than all of the critical values, hence we reject the null hypothesisofunitroot.Therefore,theseriesisstationary.
. Fig -2:CHE_GDPRollingStatistics
of Engineering and Technology (IRJET) e-ISSN: 2395-0056 p-ISSN: 2395-0072
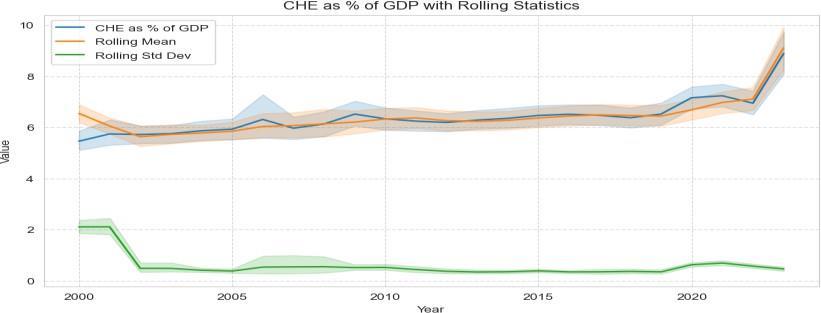
To visualize the moving average and its rolling standard deviationovertime,rollingstatisticsanalysiswasobtained. Verygraduallyovera long period,therollingmeanisina steadyupward trend, suggesting Healthexpenditureas a percentage oftheGDPisincreasing. Throughout the observationperiod,therollingstandarddeviationcapturesa rather low level of variance, suggesting fluctuations in expenditureareprettywell-controlled,withtheexceptionof a strong spike in 2020, possibly because of the COVID-19 pandemic.TheincreaseinCHEasapercentageofGDPbeing observedovertimereflectstheincreasingleveloffinancial burdenonhealthcaresystemsaroundtheworld.Thesteady state in variance as indicated by the rolling standard deviationshowsthateventhoughexpendituresareonthe increase, their behaviour remains predictable with a few exceptionsduetoexogenousshockssuchastheCOVID-19 pandemic,thuscallingforviablehealthcarefundingpolicies to sustain equitable financial provision in the days ahead. ForecastwithARModel:PACFandACFplotswereused,as wellasAICandBICvaluestodeterminetheARmodelorder sothatthetrade-offbetweencomplexityandgoodness-of-fit wastakenintoaccount.
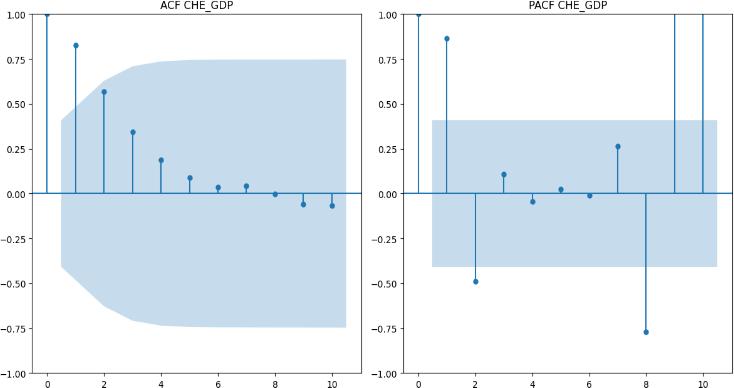
OptimalLagSelections:AICsuggestedlagis2,BICsuggested lagis2.ThemodelfinallyselectedwasAR(2).
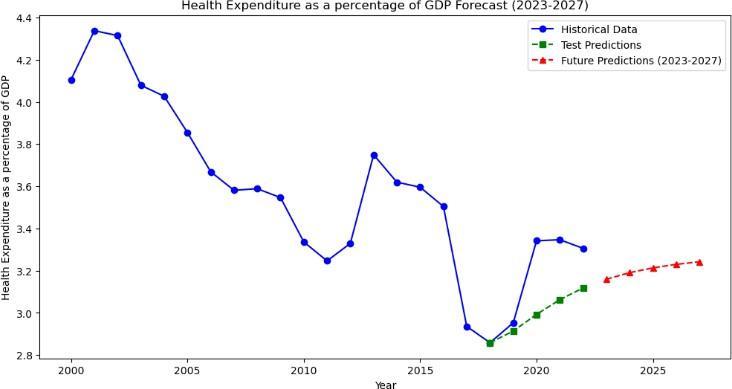
Fig -5:CHE_GDPpredictionsofIndia
In India, CHE_GDP has historically been characterized by fluctuationsinvolvingadeclinesincetheearly2000s,amore marked fall around 2015, and a slow recovery thereafter startingfrom2020.TheAR(2)modelpredictsCHE_GDPto slowlyrisefrom2023-2027,showinganincreasingtrendin healthexpenditure.TheMAPEvalueof5.19%indicatesthe predictionsmayerrbythisamountoneitherside,thereby justifying the use of the AR(2) autoregressive model as a short-termforecastingtoolforCHE_GDP.
Accuracy:TheARmodelwasbuiltusing80%ofthedataand testedon20%.StandardErrormetricswereusedtoevaluate the predictions: Mean Absolute Error (MAE) is 0.17, Root Mean Square Error (RMSE) is 0.22, and Mean Absolute PercentageError(MAPE)is5.19%.
ForecastwithMAmodels:Wefiguredoutthebestorderfor the Moving Average (MA) model by cross-validation with differing valuesof q. Theassessed measure wastheMean AbsoluteError(MAE).AsshownintheFigure,theoutcome MAEfiguresreducewhenincreasesinvalueofq,havingthe leastat Beyondthatpointseveregrowthoferrorhappened toindicatethesuitabilityofanMA(4)modelinprojectionfor CHE_GDPofIndia.
Though indicating a satisfactory overall capturing of CHE_GDPinIndiaduringthetestperiod(2018-2022),this MA(4) model forecasting accuracy does show some deviationsinparticularyears.Theseimplythatthemodel, whilecapturingminorshort-termfluctuations,maynotbe able to capture broader or longer variations or outside shocks to health expenditure. It appears that historically there has been a steady decrease in CHE_GDP, especially
International Research Journal of Engineering and Technology (IRJET) e-ISSN: 2395-0056 p-ISSN: 2395-0072
Volume: 12 Issue: 03 | Mar 2025 www.irjet.net
from the early 2000s and into 2015, at which point there wasamassivedecline,againprobablybecauseofeconomic restrictions,policychanges,orinstabilityoffundswithinthe healthcaresystem;thenfinally,post-2020,therehasbeena smallbutpersistentrise,whichagainwilllikelybeseenas extending by the MA(4) model from 2023-2027. With an MAE of 0.1879, it does indicate a fairly good forecasting accuracy. However, further improvement may happen if more macroeconomic factors such as GDP growth rates, inflation,andhealthpolicies,arepluggedintothemodel.
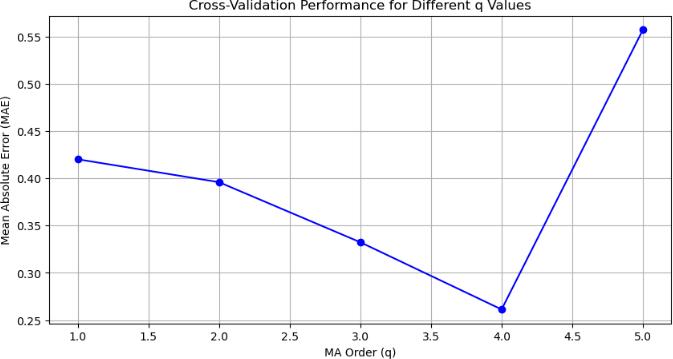
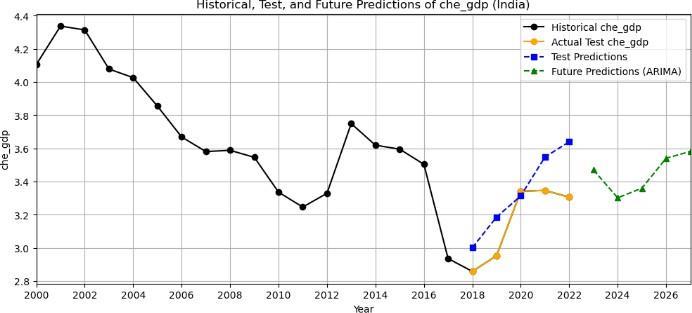
Fig -7:PredictionsofIndiausingMAmodel.
The MA(4) model has been satisfactorily accurate in forecasting CHE_GDP for India. Here are the model evaluation metrics: MAE: 0.1879, RMSE: 0.2134. These figuressuggestthatthemodelquiterightlypicksupsharp fluctuationsintheshort termwithoutmuchoverall error. ForecastingwithARMAModel:TheARMAmodeltrainedat optimalparametersofAR(p)=1andMA(q)=1hasbeen modeled to forecast India's CHE_GDP (Current Health ExpenditureasapercentageofGDP).Testyearprojections (2018-2022)showaverygoodmatchwiththeactualswith respect to short-term variation. Mean Absolute Error was 0.11,withtheRootMeanSquaredErrorwas0.14,indicating that the model performed well in short-term forecasting. Projections for the future years' 2023-2027 suggest that CHE_GDPwouldgrowataconstantrate,whichisseenasa recoverytrendoftheyearspost-2020.
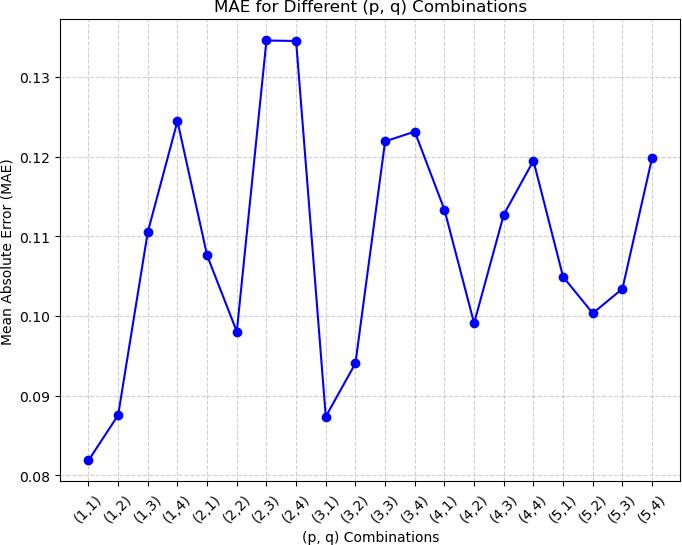
-8:MAEfordifferent(p,q)lags.
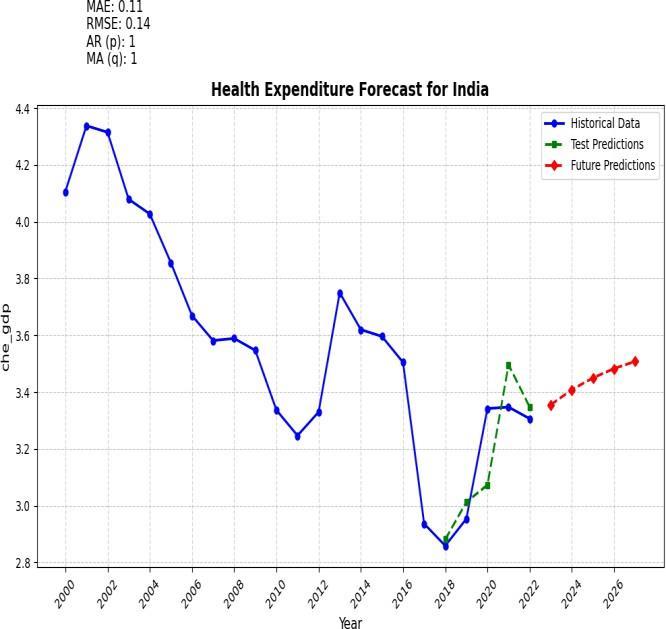
Fig -9:ARMAPredictionsforIndia
TheARMAmodelcapturesthoseshort-termdependencies andcyclesthenfallsshortoflong-termtrendsandexternal economic shocks. Rolling statistical analysis and ADF test confirmed the presence of stationarity, hence validating suitabilityforARMAtimeseriesmodeling.Forecastindicates apossiblereboundofhealthexpenditureinlinewithpostpandemicrecoverytrends.
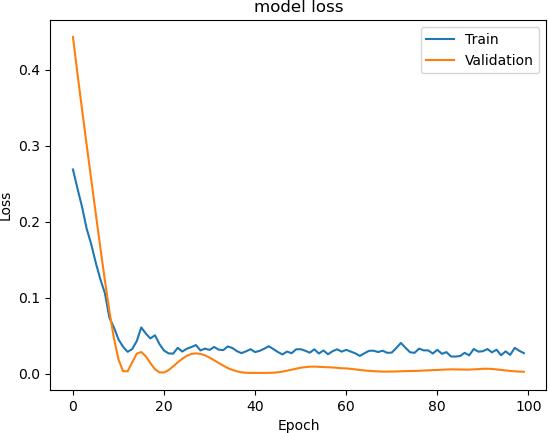
ForecastingwithLSTM(Univariatemodel):TheLongShortTerm Memory (LSTM) univariate model was trained andtested toforecast trends in health expenditure as a percentage of GDP. Training and validation loss curves revealed that the model converged nicely, with little overfitting. There was a steep decline in loss during the initialepochs,whichstartedstabilizingafterapproximately 20epochs,asseenonthegraphofmodelloss
The model's predictive power was measured using three key metrics: Mean Absolute Error (MAE), Mean Squared Error (MSE), and Root Mean Squared Error (RMSE). The findings we obtained are MAE: 0.1485; MSE: 0.0349; RMSE:0.1868; TestLoss:0.0349.
Volume: 12 Issue: 03 | Mar 2025 www.irjet.net
International Research Journal of Engineering and Technology (IRJET) e-ISSN: 2395-0056 p-ISSN: 2395-0072
-10:Modelloss
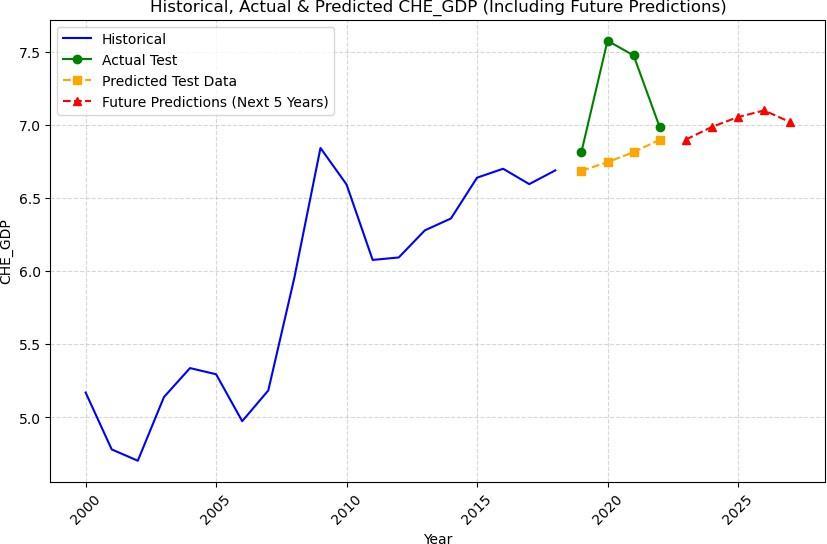
Fig -11:PredictionsusingLSTM-UnivariateModel
Predictions and Trends: The prediction plot shows an illustrationofhistoricalvalues,actualtestvalues,predicted test values, and future predictions for the next five years. The model seems to closely follow the trend of the actual data points, where The model's predictive ability was checkedwiththreemajormeasures:MeanAbsoluteError (MAE),MeanSquaredError(MSE),andRootMeanSquared Error (RMSE). The results. The future predictions show a level trend, implying a gradual increase in health expenditureconcerningGDPgoingforward.
Theinferencefromtheseresultsisthatthemodelhasafairly lowerror,whichindicatesthatitisprobablyabletocapture the patterns of the given dataset quite well. The model captures temporal dependencies fairly well and gives reasonableforecastsforthefuture.Theverysmalldisparity between training and validation loss indicates good generalizationbehaviorofthemodel.
ForecastingwithLSTM(Multivariatemodel):CurrentHealth Expenditure as a percentage of GDP (CHE_GDP) was forecasted with the implementation of a multivariate LSTMmodel.Theperformancewasevaluatedagainstsome key metrics; the MAE value measured 0.1226, the MSE at 0.0152, and the RMSE presented a value of 0.1234, which signifiesthatthemodelhasagoodpredictivecapability.The validation loss was also low, showing the good generalizationcapabilityofthemodelonunseendata.
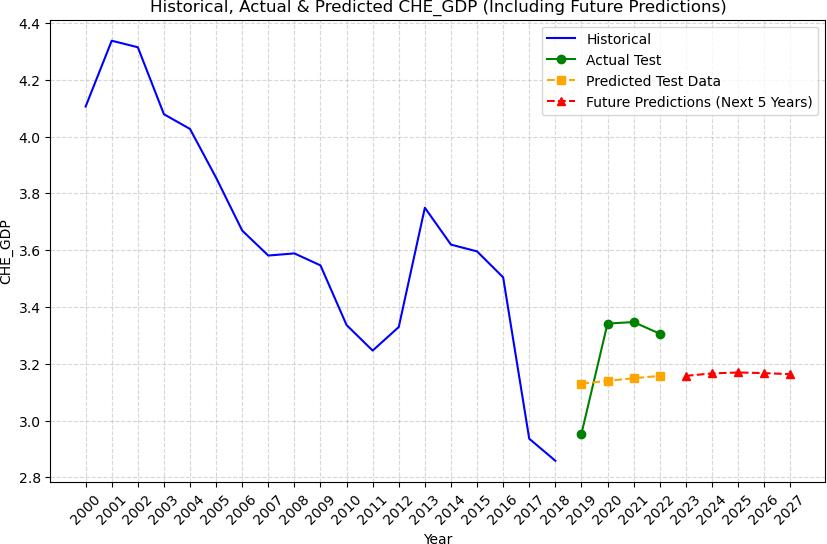
Fig -12: PredictionsusingLSTM-MultivariateModel-India.
Table -1: AccuracyMetrics.
05326
The study carried out the comparative analysis of traditional time series models and the deep learningbased Long Short-Term Memory (LSTM) models, for the prediction of Current Health Expenditure (CHE) measured as a percentage of GDP (CHE_GDP).
Theinversedtransformedpredictionstotheoriginalscale with respect to the actual CHE_GDP values followed very closelyintime,especiallyintheshortterm.Afewinitialtest predictionsof3.13,3.14,3.15,and3.16weremadeagainst true values of 2.95, 3.34, 3.35, and 3.30, revealing a reasonable approximation, and small deviations. The graphical representation of the historical time series data and the actual test values, along with future predictions, show the model's ability to capture general trends adequately,withminordiscrepanciesinweightedregions. Predicted next 5 years' values: [3.15723322 3.16604606 3.169230473.167091863.16314209]forIndia. ThemodelshowsthatCHE_GDPcanbereasonablypredicted forthenext5years,pointingtostableorslightlyincreasing trends in many regions. Nevertheless, it is limited by the inability to simulate external economic shocks, implementing policy interventions, and the pandemicinducedfluxers,thusinducinguncertaintyinitslong-term prediction. © 2025, IRJET | Impact Factor value: 8.315 | ISO 9001:2008 Certified Journal | Page697
International Research Journal of Engineering and Technology (IRJET) e-ISSN: 2395-0056 p-ISSN: 2395-0072
Volume: 12 Issue: 03 | Mar 2025 www.irjet.net
Among the traditional models, ARMA performed well forshort-termforecasting.
The LSTM models exhibited variations in error performance. Univariate LSTM performs slightly better than multivariate models, implying that any addition of extrafeaturesinthisdatasetdoesnotseemtoimprovethe performance. The work assumed the stationarity of the timeseries under consideration. However, the data of several countries are nonstationary and have cyclic changes also. It is expected that the performance of both ARMA and LSTM models will improve if seasonal and nonstationarytrendeffectsareremoved.Hencethefuture scopeofworkmustincludethetechniquesthatcantakecareof theseeffectsto producebettershorttermaswellaslongterm predictions.
[1] T.HitirisandJ.Posnett,"Thedeterminantsandeffects ofhealthexpenditureindevelopedcountries", Journal ofHealth Economics,vol.11,pp.173-181,1992.
[2] J. P. Newhouse, "Cross-national differences in health spending: What do they mean?", Journal of Health Economics,vol.6,pp.159-162,1987.
[3] Global Burden of Disease Health Financing Collaborator Network. Past, present, and future of global health financing: a review of development assistance, government, out-of-pocket, and other private spending on health for 195 countries, 1995–2050. The Lancet. 24 April 2019. doi: http://dx.doi.org/10.1016/S0140-6736(19)30841-4
[4] J. P. McCusker, D. L. McGuinness, J. Lee, C Thomas, P. Courtney, Z. Tatalovich, et al., "Towards Next Generation Health Data Exploration: A Data Cubebased Investigation into Population Statistics for Tobacco", 46th Hawaii International Conference on SystemSciences(HICSS),pp.2725-2732,2013.
[5] E.Meara,C.WhiteandD.M.Cutler,"Trendsinmedical spendingbyage1963–2000", HealthAffairs,vol.23,no. 4,pp.176-183,2004.
[6] John Wang, Zhaoqiong Qin, Jeffrey Hsu, Bin Zhou,A fusion of machine learning algorithms and traditional statistical forecasting models for analyzing American healthcareexpenditure,HealthcareAnalytics,Volume5,2 024,100312,ISSN27724425,https://doi .org/10.1016/j.health.2024.100312.T.E
[7] A.Burrell,V.Zah,Z.Zrubka,andC.Asche,"PD45Paying For Digital Health: What Evidence Is Needed?", Int. J. Technol. Assess. Health Care, vol. 38, no. S1, pp. S106S107,Dec.2022.
[8] Roger Muremyi Prediction of out-of-pocket health expenditures in Rwanda using machine learning techniques
[9] N.ChiomaEwurumandS.OselokaOkafor,‘GlobalHealth Security: An Evaluation of Public Health Expenditure, Health Status and Economic Development in Nigeria’, SustainableDevelopment.IntechOpen,Jun.19,2024.doi: 10.5772/intechopen.114264.
[10] Z.Song,S.Rose,D.G.Safran,B.E.Landon,M.P.Dayand M. E. Chernew, "Changes in health care spending and quality4yearsintoglobalpayment", NewEnglandJournal ofMedicine,vol.371,no.18,pp.1704-1714,2014.
[11] Evolution and patterns of global health financing 1995–2014: development assistance for health, and government, prepaid private, and out-of-pocket health spendingin184.
[12] Ntivuguruzwa S (2023) Application of Machine Learning in Long Term Healthcare Cost Prediction in Rwanda. HealthSciJ.Vol.17No.4:1007.
[13] PredictingHealthSpendinginTurkeyUsingtheGPR,SVR, andDTModelsTürkiyeSağlıkHarcamalarının GPR,SVR veDTModelleriile
[14] TahminiDrivers of healthcare expenditure growth in West Africa: A panel data investigation Rasaki Stephen Dauda, Fiyinfoluwa Adeyinka Balogun First published: 23 November 2023 https://doi.org/10.100 2 /hpm.3735
[15] FFAWorkingPaperNo.25,July2022,authoredbyThomas BrändleandCarstenColombier.
[16] TetianaZatonatska,OlenaLiashenko,YanaFareniuk,Oleks and Dluhopolskyi, Artur Dmowski, and Marzena Cichorzews ka."The migration Influence on the Forecasting of Health Care Budget Expenditures in the DirectionofSustainability:
[17] Z. Zrubka et al., "Towards a single goodness metric of clinically relevant accurate fair and unbiased machine learning predictions of health-related quality of life", 2023 IEEE 27th International Conference on Intelligent ystems (INES), pp. 000285-000290, Jul. 2023. EngineeringS
[18] M. Alkhaldi, A. Al Basuoni, M. Matos, M. Tanner, and S. Ahmed, "Health Technology Assessment in High Middle and Low-income Countries: New Systematic and Interdisciplinary Approach For Sound Informed-Policy Making: Research Protocole", Risk Manag. Health Policy, vol.14,pp.2757-2770,2021.
[19] Tracking development assistance for health and for COVID-19: a review of development assistance, © 2025, IRJET | Impact Factor value: 8.315 | ISO 9001:2008 Certified Journal | Page698
International Research Journal of Engineering and Technology (IRJET) e-ISSN: 2395-0056 p-ISSN: 2395-0072
Volume: 12 Issue: 03 | Mar 2025 www.irjet.net
government, out-of-pocket, and other private spendingonhealthfor204countriesandterritories, 1990–2050
[20] Samah, I.H.A., Rashid, I.M.A., Husain, WAFW, Ibrahim, S., Hamzah, H., Amlus, M.H., 2020. The impact of healthcare expenditure and healthcare sector growth on CO2 emission using dynamic panel data system GMM estimation model during COVID 19 crisis. Int. J. Energy Econ.Policy10,235–241. https://doi.org/10.32479/ijeep.9769
[21] Zhang, C., Wei, H., Zhao, X., Liu, T., Zhang, K., 2016. A Gaussian process regression based hybrid approach for short-termwindspeedprediction. EnergyConvers. Manag. 126,1084https://doi.org/10.1016/j.enconman.201 6.08.086.