
International Research Journal of Engineering and Technology (IRJET) e-ISSN: 2395-0056
Volume: 12 Issue: 03 | Mar 2025 www.irjet.net p-ISSN: 2395-0072
International Research Journal of Engineering and Technology (IRJET) e-ISSN: 2395-0056
Volume: 12 Issue: 03 | Mar 2025 www.irjet.net p-ISSN: 2395-0072
J Gowri Thangam 1 , M Maanis2 and M Manasa3
1Assistant Professor, Department of Computer Applications, PSG College of Technology, Coimbatore, India
2UG Student, Department of Economics, PSG College of Arts and Science, Coimbatore, India
3UGStudent,DepartmentofStatistics,PSGCollegeofArtsandScience,Coimbatore,India ***
Abstract - Stock market prediction is a crucial field of studythatimpactsfinancialdatatopredictpricesofstocks andtrends,aidingfinancialorganizationsandinvestorsin decision-making. This research explores advanced predictive modeling techniques by integrating real-time marketsentiment,macroeconomicvariables,andhistorical stock data. The deep learning approach including regression-based modeling, neural networks with recurrent features (RNNs), and long short-term memory (LSTM) models are used to identify challenging patterns and non-linearity in the data set. Thestudyhighlightsthe significance of data pre-processing, feature selection, and evaluation measuresincluding meansquarederror(MSE) and accuracy. The preliminary results indicate that the MSE has diminished, demonstrating that deep learning algorithmsmayenhancestock marketforecasts.Therealtime prediction models can be improved by combining adaptive algorithms and reinforcement learning which willpavepathwayforfutureresearch.
Key Words: Deep Learning, Forecasting, Investors, LSTM, MSE,RNN,StockMarket
Stock market prediction is the process of forecasting future stock prices or market trends using various analyticalmethods,models,andtools.Itisacriticalareain finance, as accurate predictions can guide investors in making informed decisions, maximizing returns, and minimizing risks. Predicting stock market movements involves estimating future changes in stock prices or market trends using a variety of models, strategies, and algorithms. By examining technical indicators, historical data, and other relevant aspects, stock market prediction aimstoforecastthedirectionofstockindicesorprices.In order to maximize profits or minimize losses, these projections assist traders, analysts, and investors in making well-informed decisions regarding the purchase, sale,orholdingofstocks (Lin,2022).Becauseofthestock market's intrinsic complexity and wide range of influencing factors, predicting is both difficult and essential. While bad forecasts can cause large financial losses, accurate forecasts can result in lucrative investments
The complexity of stock market prediction arises from its dynamic and volatile nature, influenced by numerous factors such as economic indicators, company performance, geopolitical events, market sentiment, and technological advancements. Techniques for prediction range from traditional methods like fundamental and technical analysis to modern approaches leveraging machinelearning,artificialintelligence,anddataanalytics
Despite advancements in predictive models, uncertainty remains a fundamental challenge in the stock market. Understanding the strengths and limitations of different methods and integrating them effectively is key to enhancing the reliability of market predictions and achievingfinancialgoals
The financial and economic importance of stock market prediction has attracted a lot of attention and research. Numerous approaches have been put forth and put into practice, ranging from sophisticated machine learning algorithms to statistical models. This literature review provides an overview of the key theories and findings relatedtostockmarketprediction(Das,2024)
Statistical approaches include historical market data, statisticalmodels,andmathematicaltechniquestopredict future stock prices, trends, or market changes in stock market forecasting. These methods seek to recognize patterns, relationships, and trends that can be used to forecastfuturebehaviorinfinancialmarkets.
2.1.1
TheAutoregressiveIntegratedMovingAverage(ARIMA)is a popular tool for time series forecasting because of the extentto whichit modelslinear trends andhow easyit is to use. According to studies, ARIMA does well for shortterm forecasts but has trouble with complex and nonlinearfinancialtrends.(Boxetal.,2015).
International Research Journal of Engineering and Technology (IRJET) e-ISSN: 2395-0056
Volume: 12 Issue: 03 | Mar 2025 www.irjet.net p-ISSN: 2395-0072
Regression models use macroeconomic indices and past stock data to forecast prices. However, their incapacity to grasp non-linear relations typically limits their performance.(Fama,1970).
2.2
Machine learning (ML) techniques have become increasingly predominant for stock market prediction because of capability to represent complicated patterns and make predictions based on vast amounts of data. These techniques help identify trends, predict stock price movements, and manage risks by learning from historical market data and improving predictions over time. (Sharmila,V.,et al.,2024).
2.2.1
Support Vector Machines have been used to categorize trends and changes in stock prices. SVMs perform better than conventional statistical techniques in capturing nonlineardependencies,accordingtoresearchbyTayandCao (2001).
2.2.2
Ensemble techniques that can handle noisy and highdimensional data, such as Random Forest and Gradient Boosting, have demonstrated strong predictive skills. (ChenandGuestrin,2016).
2.3
The non-linearity and complex patterns in stock market can be identified by employing the deep learning models. Thesemodelsserveas efficient toolsfor forecasting stock prices and market movements because they can automatically identify patterns in massive amounts of data.
2.3.1
Temporal dependencies in stock data are commonly captured by recurrent neural networks, particularly Long Short-TermMemory(LSTM)networks (Hassanien,2020) Fischer and Krauss (2018) emphasized that LSTM outperformedconventionalneuralnetworksinstockprice prediction.
2.3.2 Convolutional Neural Networks (CNNs)
Despite its traditional approach in image processing, Convolutional Neural Networks have been utilized to extractfeaturesfromfinancial timeseriesdata. According to studies, CNNs are capable of efficiently capturing local
patterns, which improves prediction accuracy (Eapen et al.,2019).
2.4
Statisticalandmachinelearningmodelsareusedinhybrid techniques to take advantage of their respective advantages. According to Zhang et al. (2020), ARIMALSTM hybrids, for example, combine the linear predictive effectiveness of ARIMA with the non-linear forecasting strengthofLSTMtoimproveaccuracy.
2.4.1
A developing subfield of financial analysis is sentiment analysis for stock market prediction, which uses natural language processing (NLP) techniques to determine whether news articles, social media content, financial reports, or other types of textual data, earnings disclosures, are positive, negative, or neutral. Market sentiment, or investors' perceptions of a stock or the marketoverall,isthoughttohaveabiginfluenceonstock prices.(Mariprasath,T.,et. al.,2024).
2.4.2
Incorporating sentiment analysis of news articles, social media,andfinancialreportshasprovenbeneficial(Ayesha Anwar, 2023). Bollen et al. (2011) provided an additional component of predictive information by demonstrating how sentiment on Twitter can forecast stock market developments.
2.4.3
Dynamic prediction and trading methods have been investigated using reinforcement learning models, including Deep Learning. Through trial and error, they discover the best policies to adjust to shifting market conditions(Pendharkar,2018).
An overview of the several methods that have been employed for stock market prediction, such as deep learning models, statistical models and machine learning techniques, is given in the study. It demonstrates the benefits and drawbacks of these various approaches, including their capacity to handle complicated, highdimensionaldataandcapturenon-linearrelationships.
The study investigates how to estimate stock prices and trends using sophisticated predictive modeling approaches like machine learning and deep learning. It combines historical stock data with current market
International Research Journal of Engineering and Technology (IRJET) e-ISSN: 2395-0056
Volume: 12 Issue: 03 | Mar 2025 www.irjet.net p-ISSN: 2395-0072
sentiment to find intricate patterns and non-linear linkagesinthestockmarket.
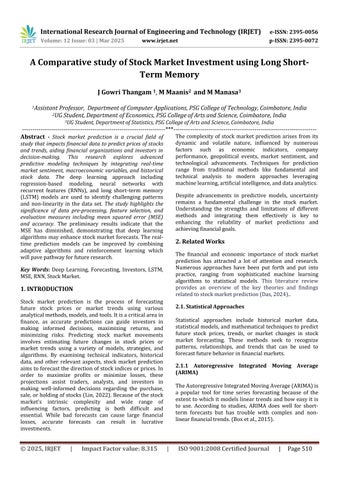
A particular kind of recurrent neural network (RNN) called long short-term memory (LSTM) was created to solvethegradientdisappearingissueandmakeitpossible to identify long-term dependencies in sequential input (Yue, 2024). Memory cells, gates, and a data storage or deletionmechanismareallpartofitsarchitecture. (Liang, C.X.,et. al,2024).
The innovative idea of introducing self-loops to create routes where the gradient can flow for lengthy periods of time is one of the primary contributions of the original long short-term memory (LSTM) model. (Jadhav, C., Somkunwar, R.K., and Ramteke, R., 2023). To dynamically change the integration time scale, the weight of this selfloop can be gated, or controlled by another hidden unit. Because time-dependent factors are produced by the model itself, the time scale of integration may vary depending on the input sequence even for an LSTM with fixed parameters (Goodfellow, 2016) The LSTM block diagram is illustrated in Figure3.1.
nonlinearity. Additionally, the state unit may serve as an auxiliary input for the gating units, enhancing its versatility (Goodfellow, 2016). The black square in the diagram signifies a single time-step delay, which enables thenetworktoprocesssequentialdataeffectively.
ThepaperarguesthatLSTMnetworksarehighlyeffective for time-series forecasting in stock market prediction (Sharmila, 2024). They can learn dependencies over long time periods and handle the sequential nature of stock data, such as historical prices, volumes, and indicators. This is supported by the model’s performance in closely aligning predictions with actual observations during training,validationsandtestingphases.Themajorreasons foremployingLSTMare:
Sequential Data Handling: Stock prices depend on past trends, making LSTM's temporal memory capabilitiesideal.
Long-Term Dependencies: LSTMaddressesvanishing gradient problems in traditional RNNs, enabling the modeltocapturelong-termpatterns.
Non-linear Relationships: LSTMscanmodelcomplex, non-linear relationships between input features and stockprices.
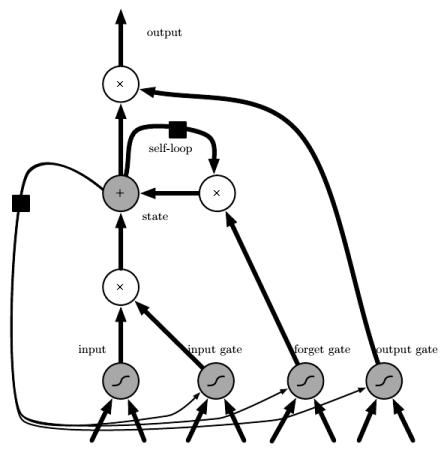
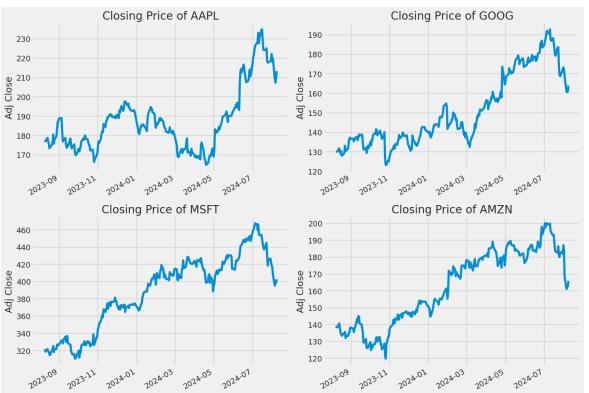
The dataset, collected from Yahoo Finance, encompasses stockdataforAmazon,Apple,Google,andMicrosoftovera one-year period. The dataset comprises seven attributes: date, volume, adjusted close, high, low, closing value, and opening value. The study emphasizes the significance of Exploratory Data Analysis (EDA) in understanding stock marketpredictionanditisdepictedinFigure4.1.
In this architecture, recurrently connected cells replace the standard hidden units found in ordinary recurrent networks.Eachinputfeatureisrepresentedasanartificial neuronunit,withitsvalueaddedtothestatebasedonthe input gate's sigmoidal activation. The forget gate dynamicallyadjuststhelinearself-loopweightofthestate unit,allowingittoretainordiscardinformation.Similarly, the output gate can deactivate the cell's output when required. All gate units use sigmoidal nonlinearity, while the input unit can utilize any type of squashing
Volume: 12 Issue: 03 | Mar 2025 www.irjet.net p-ISSN: 2395-0072
Through EDA the similarities and differences in stock trendsamongfourcompanies:Apple,Google,Amazonand Microsoft were studied and observed. This analysis revealed that Amazon, Google, and Microsoft exhibited similarpatterns,whileAppleshoweddistincttrends.
4.1.1. Similarity among Amazon, Google, and Microsoft Market Trends: These three companies may have followed similar market trends, responding in a comparable manner to macroeconomic factors such as inflation, interest rates, or market-wide events like policy announcements.
Sector Alignment: Amazon, Google, and Microsoft are primarily tech-oriented and share overlapping business domains like cloud computing, AI, and enterprise solutions. Their stock performances might reflect similar investorsentimentandmarketdynamics.
Seasonality: These companies could exhibit aligned seasonalityintheirstockprices,influencedbyfactorslike quarterlyearningsorholidayseasonperformance.
4.1.2. Apple’s Divergence
Different Revenue Streams: Apple’s business model relies heavily on consumer electronics, with significant revenue from product sales (e.g., iPhones, iPads) and an ecosystem of hardware and services. This may cause its stocktoreactdifferentlytomarketconditions.
Unique Consumer Behavior: Apple’s stock performance might reflect consumer-driven trends or product launch cycles, which are less influential for the other three companies.
Market Events: Specific events like supply chain disruptions, regulatory actions, or product controversies could disproportionately affect Apple compared to Amazon,Google,andMicrosoft.
Investors’ Sentiment: Market perception of Apple as a "hardware-first" company compared to the "software/cloud-first" models of Amazon, Google, and Microsoft might create distinct patterns in stock performance.
The EDA highlights that while Amazon, Google, and Microsoft exhibit aligned stock market behaviors, Apple’s divergencecanbeattributedtoitsuniquebusinessmodel, revenue streams, and market dynamics. Understanding these differences is crucial for accurate modeling, forecasting, and strategic decision-making, whether for investmentormarketanalysispurposes.
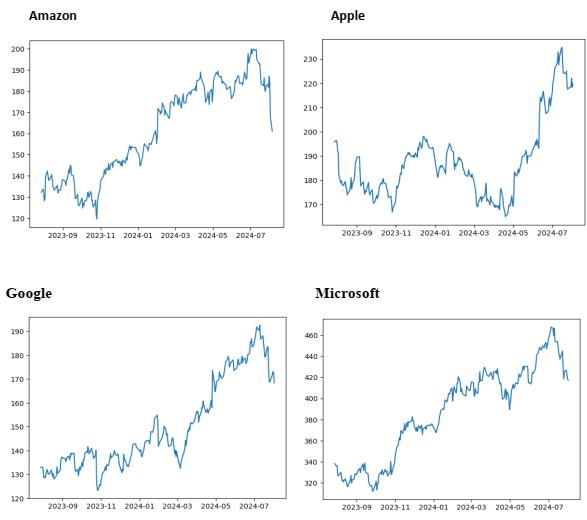
4.1.3. Analysis of Similarity in Closing Prices for Apple, Google, Microsoft, and Amazon
Through the exploratory analysis of the dataset, it has beenobservedthattheclosingpricesof AppleandGoogle exhibit similar patterns, as do the closing prices of MicrosoftandAmazon.ItisshowninFigure4.2
This insight highlights a correlation in stock price behaviors between these companies, which can be attributed to several market dynamics, as explained below:
4.1.4. Observed Similarity between Apple and Google
Apple and Google are leaders in the tech industry, both operating in sectors that are influenced by similar macroeconomic trends, technological advancements, and consumer demand. This shared market positioning may explain the observed similarity in their stock closing prices.
4.1.5. Observed Similarity between Microsoft and Amazon
Similarly, Microsoft and Amazon exhibit a pattern of correlated closing prices. While both companies are also leaders in their respective industries, they share common revenue streams and dependencies, such as cloud computing, which may drive this similarity. The paper analyzes the similarity in closing prices of Apple and Google, as well as Microsoft and Amazon, reflects their shared market environments, overlapping revenue streams,andsusceptibilitytosimilarexternalfactors.This insightnotonlyhelpsinunderstandingstockbehaviorbut also provides a foundation for better forecasting and investment strategies. By analyzing such patterns, stakeholders can gain a deeper understanding of market dynamics and the interdependencies of major corporations(HassanienA.E.,(2024).
4.1.6.
Upon analysis of the dataset, it is observed that the sales volumes of Amazon and Google exhibit similar patterns, while the sales volumes of Apple and Microsoft differ significantly.ItisshowninFigure4.3.
International Research Journal of Engineering and Technology (IRJET) e-ISSN: 2395-0056
Volume: 12 Issue: 03 | Mar 2025 www.irjet.net p-ISSN: 2395-0072
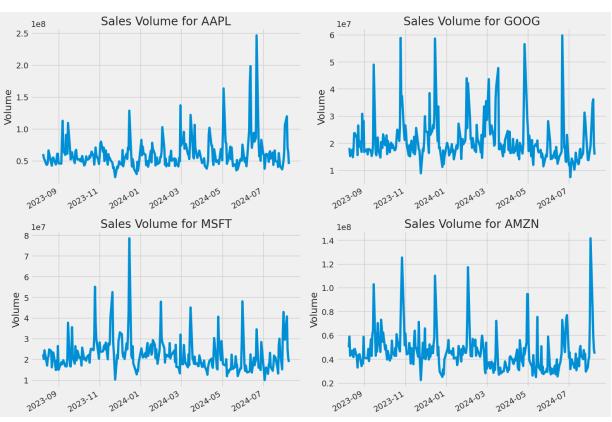
This finding reflects differences in business models, market strategies, and customer bases across these companies.
The similarity in sales volumes between Amazon and Google reflects their shared focus on digital advertising and cloud services, industries with steady growth and global demand. Conversely, the differing sales volumes of Apple and Microsoft arise from their contrasting market strategies and product focuses Apple’s cyclical hardwaredriven approach versus Microsoft’s stable enterprise software and cloud services model. These patterns providevaluableinsightsintotheoperationaldynamicsof thesecompaniesandtheirrespectivemarketstrategies.
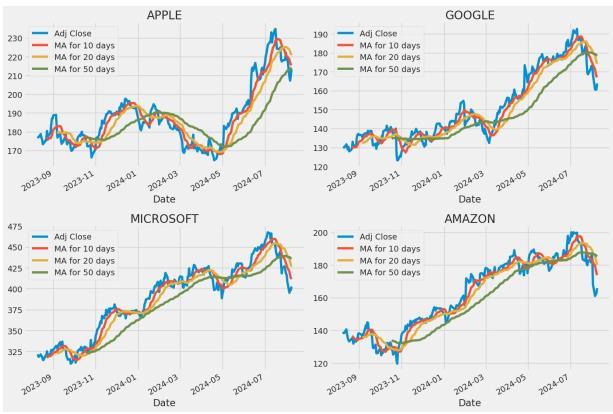
The paper examines the 10-day, 20-day, and 50-day moving averages of the stocks, finding them to be closely alignedwiththeadjustedclosingprices.Thisunderscores the utility of moving averages in identifying stock market trends. The analysis of daily returns also reveals the differences in the volatility and risk profiles of the stocks withMicrosoft exhibitingthemoststabilityandApple the highestvolatility.ItisdepictedinFigure4.4.
The close alignment of the 10-day, 20-day, and 50-day movingaverageswiththeadjustedclosepricesofAmazon, Apple, Google, and Microsoft reflects their reliable price trends over short, intermediate, and long-term periods. This observation underscores the utility of moving averages in identifying stock market trends, making them valuabletoolsforbothtradersandlong-terminvestors. 4.1.8.
The daily return distributions of the stocks of Microsoft, Amazon, Google, and Apple exhibit a bell-shaped curve, indicatingthatthemajorityofdailyreturnsclusteraround a central average, consistent with a normal distribution. However, there are notable differences in the shape and spreadofthebellcurvesandshowninFigure4.5.
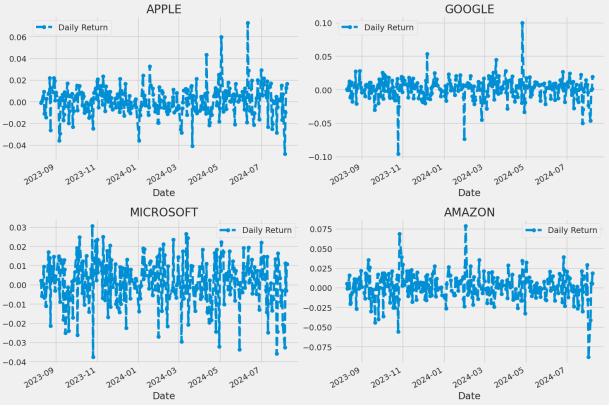
Thebell-shapedcurvesofdailyreturnsreflectthegeneral stabilityofthestockmarket'sbehavior,withmostreturns clustering around the mean. The distribution of daily returnforfourstocksareshowninFigure4.6.
Volume: 12 Issue: 03 | Mar 2025 www.irjet.net p-ISSN: 2395-0072
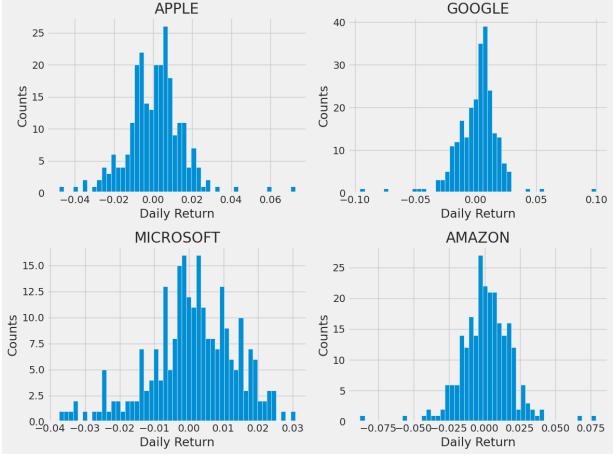
However, the broader curve for Microsoft signals its stability,whilethenarrowercurveswithtailsforAmazon, Google, and Apple highlight their higher volatility and potential for extreme returns. This distinction helps investors tailor their strategies based on risk tolerance andinvestmentgoals.
The dataset contains 7 attributes: date, opening value, high,low,closingvalue,adjustedcloseandvolume.Outof theseattributesitisfoundthatthedateandclosingvalue columns are sufficient for predicting the trends in the stock. The dataset is pre-processed by preparing data set suitable for supervised learning problems. The closing value will be the goal, and the closing value of the last three days has been taken for convenience. The dataset, containing stock market data for Amazon, Google, Microsoft,andAppleovera year,hasbeenpartitionedfor training,validation,andtestinginan80%,10%,and10% split, respectively. Exploratory Data Analysis (EDA), summarized in a figure, reveals that the stock trends for Amazon, Google, and Microsoft exhibit similar patterns, whereasApple’sstock trendsaredistinct.Itisdepicted in Figure5.1.
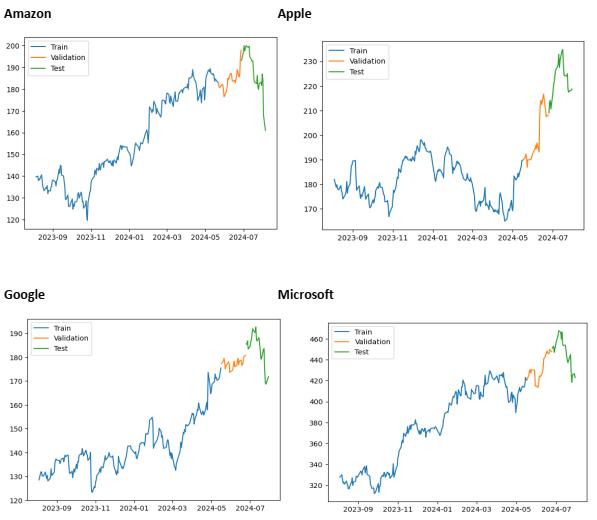
The partitioning of data into training, validation, and testingensuresarobustmodel-buildingprocess.TheEDA highlights significant similarities in stock trends for Amazon, Google, and Microsoft, reflecting their shared market dynamics, while Apple’s distinct patterns underline its unique market position and influences. Understanding these differences is critical for accurate modeling, forecasting, and decision-making in stock marketanalysis.
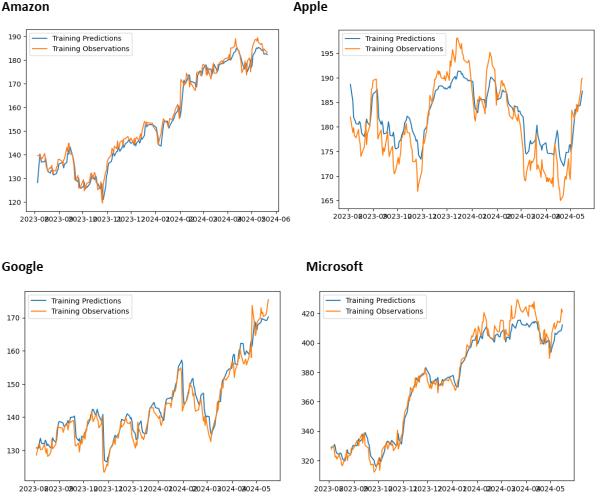
Thetrainingpredictionsandobservationsofallthesedata are compared and found to be similar in nature. So the LSTM model works significantly well for stock market prediction.
According to the paper, the Long Short-Term Memory (LSTM) model has successfully captured the temporal patterns and dependencies present in the stock market data when the training predictions and observations are compared and discovered to be similar in nature. This impliesthattheLSTMmodelcanpredictthestockmarket withaccuracy.ItisshowninFigure5.2.
International Research Journal of Engineering and Technology (IRJET) e-ISSN: 2395-0056
Volume: 12 Issue: 03 | Mar 2025 www.irjet.net p-ISSN: 2395-0072
5.1.1.
When training predictions align closely with actual observations, it indicates that the LSTM has successfully learned the key patterns and relationships in the stock market data. For example, it may have identified trends, seasonality, or correlations between features such as volumeandprice.
5.1.2.
The alignment between predictions and observations is often quantified using metrics like Mean Squared Error (MSE) or Mean Absolute Percentage Error (MAPE). Low error values suggest the model has been trained effectively.
ThefindingsoftheLSTM model'straining,validation,and testingusingstockmarketdataarepresentedinthestudy.
During the training, validation, and testing stages, the model's predictions and actual observations closely matched, indicating that the LSTM model successfully captured the temporal patterns and dependencies in the stock data. Its ability to learn sequential patterns and handle non-linear relationships makes it a significant tool for forecasting stock prices. However, further validation and testing on unseen data are crucial to ensure its reliabilityinreal-worldapplications.
5.2. Similarity between Validation Predictions and Observations
The validation predictions and observations of all these data are compared and found to be similar in nature. So the model trained is in line with validation. The paper states that the validation predictions and validation
observations are similar. It demonstrates that the Long Short-Term Memory (LSTM) model has successfully generalized its learning from the training phase to the validation phase. This is critical for ensuring the model’s robustness and reliability in real world applications. It is showninFigure5.3.
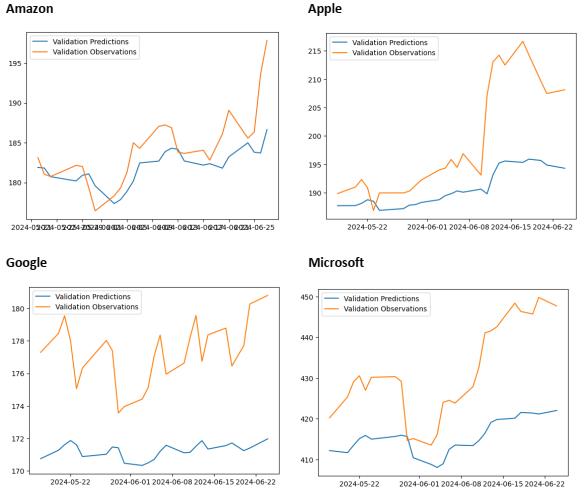
Figure 5.3 Training Predictions and its Observations of Stocks
When the model’s predictions on the validation dataset closelymatchactualobservations,itdemonstratesthatthe LSTM has effectively captured temporal patterns and dependencies in the data. For example, in a time-series scenario like stock market prediction, this means the model has learned trends, fluctuations, and correlations from the training data that are also present in the validationdata.
If validation predictions align with observations, the model is likely robust and not overly reliant on specific featuresornoiseinthetrainingdata.
This is critical for tasks like financial forecasting, where the data can be noisy and non-linear. The Training and validating the model are critical steps in improving the testing results because they establish the foundation for the model's learning and generalization capabilities. The comparisonoftestingpredictionswithactualobservations serves as a performance indicator, confirming the effectiveness of the training process and identifying areas forimprovement.
International Research Journal of Engineering and Technology (IRJET) e-ISSN: 2395-0056
Volume: 12 Issue: 03 | Mar 2025 www.irjet.net p-ISSN: 2395-0072
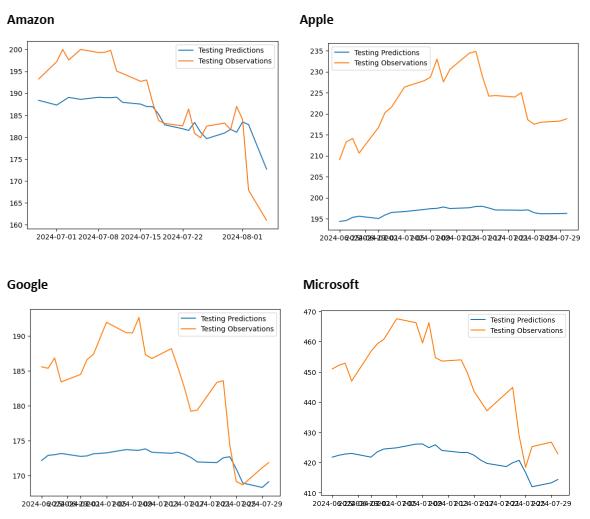
The testing predictions and observations of all these data are compared and found to be similar in nature. So the training and validating the model helps to improve the testing results. The paper states that when testing predictionsandobservationsofamodelarecomparedand found to be similar in nature. It indicates that the model has learned patterns effectively from the data. This similarityimpliesthatthemodelhasgeneralizedwelland can make accurate predictions on unseen data. It is depictedinFigure
The model learns characteristics, correlations, and patterns from the provided dataset during the training phase. In order to reduce the error (such as the loss function) between forecasts and actual results, this procedure entails fine-tuning the model's parameters. Proper training ensures that the model can capture the underlying trends in the data without over fitting (memorizing the training data) or under fitting (failing to captureenoughdetail).
5.3.2.
During training, the validation set serves as a benchmark to assess the model's performance. It guards against over fittingandguaranteesthatthemodelgeneralizesproperly to new inputs. In order to optimize the model, hyper parameters (such as learning rate, number of layers, or regularization parameters) are frequently changed in responsetovalidationfindings(HassanienA.E.,2020).
When the validation predictions and observations are similar in nature, it indicates that the LSTM model has beentrainedeffectivelyandhasgeneralizeditslearningto new data. This alignment validates the training process and suggests the model is ready for further evaluation or application. Such results reinforce the reliability of the model,especiallyindomainslikestockmarketprediction, whereaccurateforecastingiscritical.
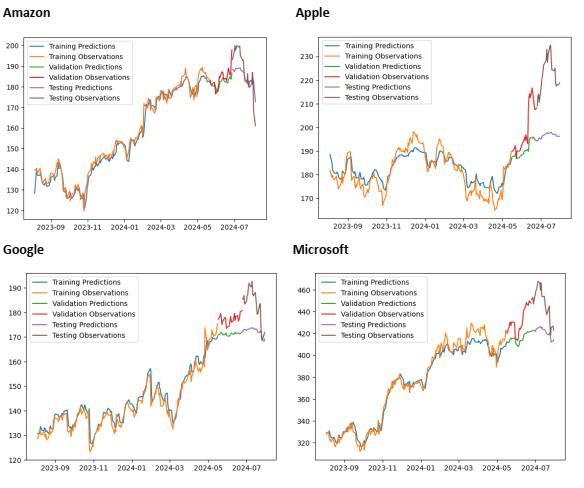
Figure 5.5 Comparison
The paper convince that the LSTM model performs consistently well across training, validation and testing phases. This is evidenced by the similarity between predictionsandobservationsinallthreephases,withonly a small flattening in the pattern during the validation phase. The comparison of three different phases are depictedinFigure5.5andFigure5.6
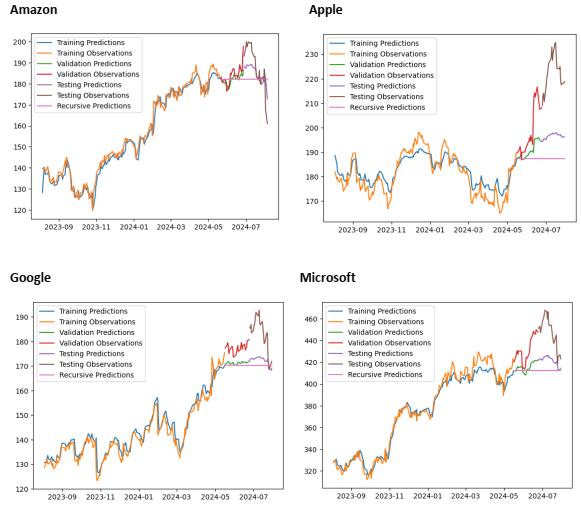
Figure 5.6 Recursive Predictions and its Observations of Stocks
International Research Journal of Engineering and Technology (IRJET) e-ISSN: 2395-0056
Volume: 12 Issue: 03 | Mar 2025 www.irjet.net p-ISSN: 2395-0072
After analyzing the daily returns, stock patterns, and behavior of these four companies, the following comprehensiveconclusionscanbedrawnanditislistedin Table5.1.
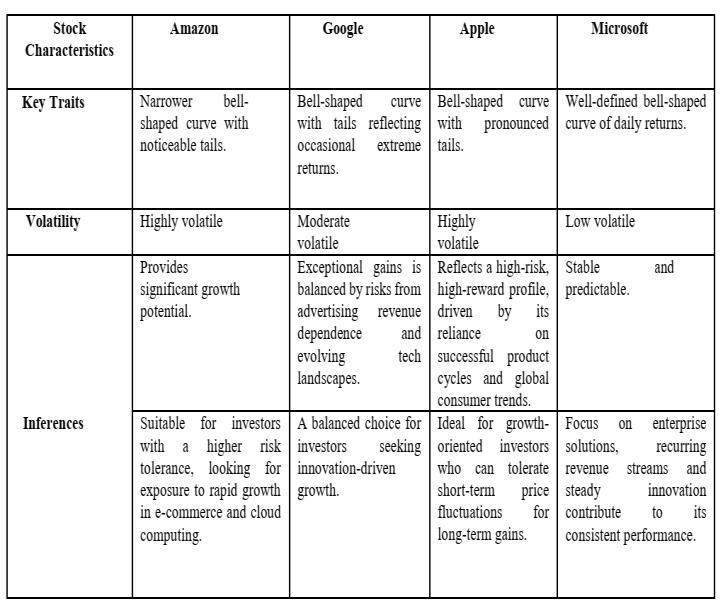
Table 5.1.
Based on the analysis of daily returns the paper provides insights into the characteristics of four different stocks. Amazon, Google, and Apple offer higher growth opportunities at the cost of increased volatility while Microsoft is the most stable and suited for conservative investment.
Together it provides a balanced investment option, appealing to a wide range of investor profiles. Incorporating these equities into an investment portfolio requirescarefulriskassessmentandstrategicplanning.
Based on a stock's historical closing prices and date patterns, the study seeks to evaluate the hypothesis that there is a substantial relationship between the date and thestock'sclosingvalue.
The paper states the null hypothesis (H₀) and the alternativehypothesis(H₁)
Null Hypothesis (H₀):
There is no relationship between the date (time-based patterns) and the stock's closing value. The closing value cannotbepredictedusinghistoricaldataanddates.
Alternative Hypothesis (H₁):
Thereisasignificantrelationshipbetweenthedate(timebased patterns) and the stock's closing value. The closing value can be predicted using historical data and timebasedtrends.
Thepaperpresentsahypothesisthatthereisasignificant relationship between historical closing values, date
patterns and future stock prices. Since the hypothesis is supported by the low error rates observed in the LSTM model’s performance indicating that historical data and time based trends can indeed be used to predict stock prices.
The LSTM-based models highlight their efficacy in stock marketprediction,thepaperalsosuggeststhatcombining these models with domain knowledge and additional market insights can significantly enhance their performance. In conclusion, because of its inherent complexityandvolatility,stockmarketpredictionisstilla challenging goal. Although many analytical techniques provide insightful information, each has unique benefits alongwithdrawbacks.Makingcomprehensivepredictions and judgments requires an exhaustive approach that incorporates a variety of techniques and takes investor behavior, financial factors, and market trends into consideration. These stocks create a balanced investment option, making them suitable for real-time applications such as diversified portfolio management, retirement planning, and risk-adjusted growth strategies to meet varyinginvestorneeds.
The study concludes with convincing evidence for the beneficial impact of LSTM networks in stock market prediction,emphasizingtheimportanceofcomprehensive data analysis, the reliability of using historical data for forecastingandthepotentialforfurtherimprovementsby integrating additional market insights with the LSTM approach.
The authors would like to thank the reviewers for reviewing the paper and providing their valuable suggestions.
1. Bollen, J., Mao, H., & Zeng, X. (2011). Twitter mood predicts the stock market. Journal of Computational Science, 2(1), 1-8. https://doi.org/10.1016/j.jocs.2010.12.007.
2. Box,G.E.P.,Jenkins,G.M.,Reinsel,G.C.,&Ljung,G.M. (2015). Time series analysis: Forecasting and control (5thed.).Hoboken,NJ:Wiley.
3. Chen, T., & Guestrin, C. (2016). XGBoost: A scalable tree boosting system. Proceedings of the 22nd ACM SIGKDD International Conference on Knowledge Discovery and Data Mining, 785-794. https://doi.org/10.1145/2939672.2939785
International Research Journal of Engineering and Technology (IRJET) e-ISSN: 2395-0056
Volume: 12 Issue: 03 | Mar 2025 www.irjet.net p-ISSN: 2395-0072
4. Das, N., Sadhukhan, B., Ghosh, R., & Chakrabarti, S. (2024). Developing Hybrid Deep Learning Models for Stock Price Prediction Using Enhanced Twitter Sentiment Score and Technical Indicators. ComputationalEconomics,1-40.
5. Eapen, J., Bein, D., & Verma, A. (2019). Novel deep learningmodel withCNNandBi-DirectionalLSTMfor improved stock market index prediction. Proceedings of the International Conference on Computational Science and Computational Intelligence, 1139-1144. https://doi.org/10.1109/CSCI49370.2019.00218.
6. Fama, E.F., 1970. Efficient capital markets.Journal of finance, 25(2),383-417.
7. Fischer, T., & Krauss, C. (2018). Deep learning with long short-term memory networks for financial market predictions. European Journal of Operational Research, 270(2), 654-669. https://doi.org/10.1016/j.ejor.2017.11.054
8. Goodfellow, I., Bengio, Y., & Courville, A. (2016). Sequence modeling: recurrent and recursive nets. Deeplearning,367-415.
9. Hassanien,A.E.,&Darwish,A.(Eds.).(2020).Machine learning and big data analytics paradigms: Analysis, applicationsandchallenges.
10. Hassanien, A. E., Anand, S., Jaiswal, A., & Kumar, P. (2024). Innovative Computing and Communications. ProceedingsofICICC
11. Jadhav, C., Ramteke, R. and Somkunwar, R.K., 2023. Smart Crowd Monitoring and Suspicious Behavior Detection Using Deep Learning. Revue d'Intelligence Artificielle, 37(4).
12. Liang,C.X.,Tian,P.,Yin,C.H.,Yua,Y.,An-Hou,W.,Ming, L.,Wang,T.,Bi,Z.andLiu,M.,2024.AComprehensive Survey and Guide to Multimodal Large Language Models in Vision-Language Tasks. arXiv preprint arXiv:2411.06284
13. Lin,C.T.,Wang,Y.K.,Huang,P.L.,Shi,Y.,&Chang,Y.C. (2022). Spatial-temporal attention-based convolutional network with text and numerical information for stock price prediction. Neural ComputingandApplications, 34(17),14387-14395.
14. Mariprasath, T., Cheepati, K.R., & Rivera, M. (2024). Practical Guide to Machine Learning, NLP, and GenerativeAI:Libraries,Algorithms,andApplications (1st ed.). River Publishers. https://doi.org/10.1201/9781003563945.
15. Pendharkar, P. C. (2018). A reinforcement learning approach for stock price prediction. International Journal of Business Analytics, 5(1), 1-15. https://doi.org/10.4018/IJBAN.2018010101.
16. Sharmila, V., Kannadhasan, S., Kannan, A.R., Sivakumar, P., & Vennila, V. (Eds.). (2024). Challenges in Information, Communication and Computing Technology: Proceedings of the 2nd International Conference on Challenges in Information, Communication,andComputing Technology(ICCICCT 2024), April 26th & 27th, 2024, Namakkal, Tamil Nadu, India (1st ed.). CRC Press. https://doi.org/10.1201/9781003559092.
17. Tay, F. E. H., & Cao, L. (2001). Application of support vector machines in financial time series forecasting. Omega, 29(4), 309-317. https://doi.org/10.1016/S0305-0483(01)00026-3.
18. Yue, C., Zhu, M., Yang, L., & Li, L. (2024). Smart Fish Passage Design and Application of Hydroacoustic Communication Technology in Aquatic Ecosystem Restoration. Scalable Computing: Practice and Experience, 25(5),4052-4060.
19. Zhang, G. P. (2003). Time series forecasting using a hybrid ARIMA and neural network model. Neurocomputing, 50(C), 159-175. https://doi.org/10.1016/S0925-2312(01)00702-0.