SECTION IV: BENEFIT & COMPENSATION INFORMATION
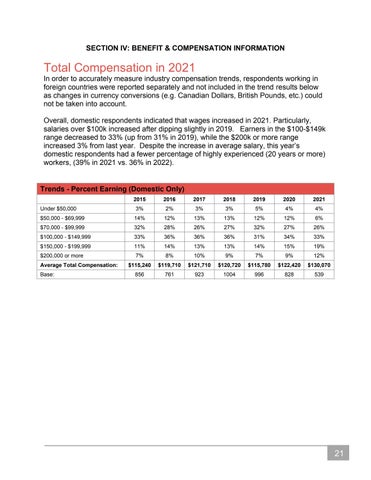
Total Compensation in 2021 In order to accurately measure industry compensation trends, respondents working in foreign countries were reported separately and not included in the trend results below as changes in currency conversions (e.g. Canadian Dollars, British Pounds, etc.) could not be taken into account. Overall, domestic respondents indicated that wages increased in 2021. Particularly, salaries over $100k increased after dipping slightly in 2019. Earners in the $100-$149k range decreased to 33% (up from 31% in 2019), while the $200k or more range increased 3% from last year. Despite the increase in average salary, this year’s domestic respondents had a fewer percentage of highly experienced (20 years or more) workers, (39% in 2021 vs. 36% in 2022).
Trends - Percent Earning (Domestic Only) 2015
2016
2017
2018
2019
2020
2021
Under $50,000
3%
2%
3%
3%
5%
4%
4%
$50,000 - $69,999
14%
12%
13%
13%
12%
12%
6%
$70,000 - $99,999
32%
28%
26%
27%
32%
27%
26%
$100,000 - $149,999
33%
36%
36%
36%
31%
34%
33%
$150,000 - $199,999
11%
14%
13%
13%
14%
15%
19%
$200,000 or more
7%
8%
10%
9%
7%
9%
12%
$115,240
$119,710
$121,710
$120,720
$115,780
$122,420
$130,070
856
761
923
1004
996
828
539
Average Total Compensation: Base:
21


