Building Future Innovators With Computer Science
NEXT GEN TECH
GRADE 5

SCHOOL:


SCHOOL:
WizKlub Futurz is an innovation platform to build Human-only skills, that are essential to succeed in school today and in career later. Wizklub Futurz offers a research-based education program designed to develop future skills across Logical Reasoning, Critical Thinking, Problem Solving, and build Inquisitiveness. This helps nurture a creator’s mindset through Technology (coding and robotics) and achieve academic success by enhancing scientific and mathematical aptitude. Our mission is to inspire minds to think a million creative thoughts, tackle real-world challenges, and shape the future.
This is a confidential document prepared by WIZKLUB Futurz. This document, or any portion thereof, should not be made available to any persons other than the authorised and designated staff of the company/institution/vendor to which it has been submitted. No part of this document may be reproduced, stored in a retrieval system, or transmitted, in any form or by any means, electronic, mechanical, photocopying, recording, or otherwise, without the prior written permission of WIZKLUB.
The Grade 4 Computer Science program introduces you to the fascinating world of technology! Through engaging lessons, you will explore interesting computer topics such as hardware and software, learn to use multimedia tools, and gain hands-on experience with different software applications. This program consists of multiple chapters with an equal focus on theory and practical classes. Through hands-on learning, students delve into the significance of computer science and coding. The program aims to foster essential skills in coding, creativity, and problem-solving, empowering students to navigate the digital world with confidence and responsibility.
In today’s digital age, early exposure to computer science is essential for building foundational skills and preparing students for the future. The Computer Science program introduces young learners to key concepts like hardware, software, and multimedia tools while fostering creativity and problem-solving through hands-on activities. This course empowers students to navigate the digital world confidently and responsibly, laying the groundwork for future success in an increasingly technology-driven world.
• Understand the basics of computer hardware and software
• Use multimedia tools and software applications to create and edit digital content
• Demonstrate foundational coding skills through simple, age-appropriate activities.
• Apply problem-solving and critical thinking skills to real-world scenarios using technology
Get ready to explore, learn, and unlock the exciting world of computers!

By the end of this chapter, you will be able to,
• Describe the importance of Windows Operating System
• List the features of Windows 11 Operating System
• Differentiate between Windows 10 and Windows 11
Have you ever noticed how your computer responds when you press buttons while playing a game, sending a message, or browsing the internet? Every time you click a button, type something, or move the mouse, your computer instantly reacts and does exactly what you ask it to. But how does it know what to do?

Figure 1.1: Girl operating a computer
That’s where the Operating System (OS) comes in. An Operating System (OS) is system software that serves as a bridge between a computer’s hardware and software, enabling them to function together seamlessly. that all processes and operations run seamlessly, making it easy for you to use the computer. It ensures takes your commands, whether it’s playing a game, opening an app, sending a message, or browsing the internet, and directs the computer to perform the right actions. Operating Systems are everywhere-not just in computers, but also in smartphones, tablets, and other devices you use daily. There are many different types of Operating
Systems such as Android and iOS for smartphones, macOS for Apple computers, and Linux, used on some computers and servers. One of the most popular Operating Systems we all use on our computers and laptops is Windows.

Table 1.1: Various Operating Systems
Windows is a widely used operating system found in computer systems at homes, schools, and workplaces around the world. It helps run your device smoothly by managing everything from applications to files. With its simple, user-friendly interface, including icons, folders, and a taskbar, it makes opening programs, switching tasks, and finding what you need easy.

Can you find out which operating system is running on your parent’s smartphone? Write it down below.
To check the operating system on a smartphone, follow these steps:
• Open the Settings app on the phone.
• Scroll down and look for About Device or About Phone.
• Tap on Software Information or Android Version to see the operating system details
In this chapter let us learn about Windows and its updated versions. Let us get started!
Windows is an operating system (OS) developed by Microsoft that helps manage and control your personal computers and laptops. It was first introduced in 1985, it has been regularly updated to keep up with advancements in computer speed, storage, and internet technology. Before Windows, computers were operated using only text commands, which made them difficult for many people to use. With its easy-to-understand and use today, it has become one of the most popular operating systems used around the world.
Key Features of Windows:
• It lets you interact with the computer using a keyboard, mouse, or microphone.
• It manages and stores your data like images, files, and music.
• It controls hardware like webcams, printers, and scanners.
• It helps open and run programs such as word processors, games, and photo editors, etc.
• It ensures the computer’s security and controls access for different users.
• It helps you to do multitask, like watching a video while writing a letter. As technology continues to advance, operating systems like Windows are updated to meet new needs and improve performance. The latest version, Windows 11, is an updated version of Windows 10. Although Windows 10 and Windows 11 share many common features, Windows 11 brings several exciting new improvements. Let’s take a closer look at them.

Let us look at some of the previous editions of Windows used by users over time.




of
October 25, 2001 January 30, 2007 October 22, 2009 August 1, 2012 July 29, 2015 October 5, 2021 Table 1.2: Various editions of Microsoft Windows

Follow the steps to find out the Windows version used on your computer/laptop, either at home or school.
Step 1: Turn on the computer
Step 2: Type Winver in the search bar

Step 3: Press Enter, and a pop-up will show your Windows version as shown.

Write the Windows name and version in the space given.
Windows 11 is the newest windows developed by Microsoft in October 2021 designed to deliver a more intuitive, efficient, and visually appealing user experience to the user.

This version is packed with innovative features like,
• Enhanced Touch Support: Smoother gestures and better responsiveness for touchenabled devices.
• Snap Layouts: Easily arrange multiple windows to boost multitasking and organisation.
• Virtual Desktops: Create separate workspaces to keep tasks organised and clutterfree.
Now, let’s dive into the features of the Windows 11 Desktop.
I. Key Features of the Windows 11 Start Menu
Study the image given in Figure 1.3. This is how Windows 11 looks on the desktop with many features and menus when you click on the start button .


Figure 1.3: Windows 11 Start Menu
Let us understand these features in detail.
• Universal Search: Helps in searching apps, and local files on computers and search web-related information.
• Pinned Applications: The applications or software used frequently by the users appear here.
• Recommended Applications: This area displays the apps or files that the user has recently opened.
• Start Button: On clicking this button, users get to see various programs that they can launch.
• Search Button: Helps to find files, and apps, and search the web for news and information.
• Task View: This option creates a virtual desktop to manage multiple applications running at the same time.
• Task Bar: Helps to view and manage running applications and files and shows the shortcuts to our favourite apps. On minimising a file or app it gets pinned to the taskbar.
• Notification Area: View notification messages, alerts, dates, time, and battery backup.
• Power Button: Allows users to restart, shut down, reboot, and sleep the computer when not required.
• Page Indicator: This indicates that there are more apps below it.
• All Apps: It shows all the programs installed on the computer.
Let’s explore some of the exciting features that make this operating system so special.
Windows 11 also comes with some special features, such as:
• Centred Start Menu: Windows 11 has a new Start Menu design that is centred, making it easier for users to find and open their favourite apps, files, and programs. However, a user can change the position of Start menu for left or center. Press Windows + I to open Settings, go to Personalization > Taskbar, and change the Start Menu alignment under Taskbar behaviors.

• Snap Layouts and Snap Groups: Windows 11 lets you organise windows in different layouts, making multitasking easier. For instance, you can position two apps side by side or arrange multiple windows. Press to quickly access Snap Layouts and select your desired setup.

• Enhanced Touch Support: If you use a touch screen, Windows 11 has improved support to make touch gestures easier and more fun.

• Virtual Desktops: This feature allows you to create multiple desktop spaces for different tasks, such as one for schoolwork and another for gaming, helping you stay organised. Use Windows + Tab to open Task View and then Windows + Ctrl + D to create a new desktop. Switch between desktops using Windows + Ctrl + Left/Right Arrow.

• Live Tiles: Live Tiles in Windows 11 are interactive icons on the Start Menu that display real-time updates and previews from apps, allowing you to get quick information without opening them. To open the Start Menu, use Win or Ctrl + Esc, and navigate between Live Tiles using the arrow keys.

Let’s explore the settings of Windows 11 operating system.
1.1.2 Understanding Windows 11 Settings
Windows 11 offers a wide range of settings options that allow users to customise and optimise their computers. Figure 1.8 illustrates the key categories within Windows 11 Settings.


Let’s explore each feature one by one to gain a better understanding of Windows 11.
1. System Settings: Windows 11 allows you to customise your computer’s performance by adjusting display settings like screen brightness, sound, power options, and storage. It also provides troubleshooting tools to help resolve issues efficiently.
2. Bluetooth & Devices: This lets you connect and manage devices like a mouse, touchpad, pen, USB, cameras, and Bluetooth gadgets such as headphones.
3. Network & Internet: You can connect to the internet using options like Wi-Fi, Ethernet, mobile hotspot, or VPN.
4. Personalisation: This helps you make your desktop look cool by changing colours, themes, wallpapers, fonts, and even customising the Start menu and taskbar.
5. Apps: Easily install, remove, or change the settings of different apps on your computer.
6. Accounts: Manage your Microsoft account, set up passwords, and adjust privacy settings for safer and easier use.
7. Time & Language: Change the time zone and set up different formats for your keyboard and microphone inputs.
8. Gaming: Explore settings designed to make your gaming experience more fun and smoother.
9. Accessibility: Customise your computer to suit different needs, like adjusting screen colours, sound settings, and how you interact with the system.
10. Privacy and Security: Protect your computer from harmful software and control what information apps and websites can access.
Now that you’ve learned about these fantastic features, you can explore Windows in your next lab session. To get started, complete the lab activity provided in your upcoming class.

Follow the steps to create a virtual desktop on your computer.
Step 1: On the taskbar, click on the task view icon or press Windows+Tab buttons.
You will get the view as shown.


Step 2: Click on New desktop
Step 3: Select the window or app that you would like to work on a virtual desktop
Step 4: Repeat the process if you need any other virtual desktop
Virtual Desktop is great when you have multiple things to do, as it helps you stay organised and saves you time. You can have a separate desktop for each task, making it easier to focus and find what you need. It’s like having your own personal workspaces that you can customise to suit your needs.
1.1.3 Difference between Windows 10 and Windows 11
Operating systems are constantly evolving through updates. Both Windows 10 and Windows 11 are widely used, each offering unique features and capabilities.
As students, it is essential to understand the basic differences between these two versions. This knowledge will help you adapt and work efficiently with any version you encounter, whether at school, home, or in the future workplace.
Let’s dive into the differences between Windows 10 and Windows 11 to better understand their features and what makes each version unique.
The Start Menu is in the bottom-left corner. The Start Menu is centered in the middle of the screen.
Taskbar icons are on the left side.
Snap Layouts allows basic window arrangements.
Virtual desktops are available offering basic functionality with limited customisation options.
Good for gaming but lacks some features.
Taskbar icons are centered for a cleaner look.
Improved Snap Layouts for organising windows easily.
Enhanced virtual desktops with customisable themes.
Improved gaming experience with Auto HDR and Direct Storage.
Table 1.3: Difference between Windows 10 and Windows 11
Windows is an essential operating system that simplifies how we use computers. Windows11, the latest version, enhances this experience with features like Snap Layouts, Virtual Desktops, and a centered Start Menu, making tasks more efficient and enjoyable. With the knowledge you’ve gained about its tools and settings, you’re now ready to explore, practice, and harness the power of Windows 11 for work, play, and learning. Keep building your skills to become a tech-savvy expert!

Operating System (OS)- Software that manages the computer’s hardware and software. Windows 11- The latest operating system developed by Microsoft.
Desktop- The main screen of the computer where you can find icons, the taskbar, and the start menu.
Start Menu- A menu that allows you to access programs, settings, and power options.
Taskbar- The bar at the bottom of the screen that shows open applications and system tools.

After the activity, explain students why it’s important to know the version of your operating system.

• Windows is an Operating System developed by Microsoft.
• Windows 11 is the updated version of Windows 10.
• Windows 11 offers many distinguishing features such as live tiles, virtual desktops, snap layouts, and many more.
• Virtual desktops are very useful as they offer extra space to work with multiple apps at the same time.
• Windows structure contains components such as a start menu, pinned applications, search bar, notification area, and many more.

I. Answer the following questions
1. Name the components of the Windows 11 desktop.
2. Name some editions of Microsoft Windows.
3. What do you need to type in the search bar to check the version of Windows on your computer?
II. Fill in the blanks with the correct answer
1. An __________ is the most important software that runs other applications on a computer.
2. The __________ allows you to access programs, settings, and power options.
3. The bar at the bottom of the screen showing open applications is called the __________.
4. The __________ helps users search for files, apps, and web-related information.
5. __________ desktops let you create separate workspaces for different tasks.
III. Decode the Secret Message
The key components of Windows 11 are hidden in this word grid. Can you find them? (Tip: Look for words like “Taskbar,” “Start,” “Search”)

Your task is to open the Windows 10/Windows 11 desktop on your computer.
1. Identify and click on three different icons or features you see.
2. Write down the names of the icons/features you clicked on.
3. Describe what each icon/feature does or opens.
4. Why do you think these icons/features are on the desktop?
5. How might they be helpful for someone using the computer?

Explore the various folders and files on the Windows11 File Explorer. Create a simple folder structure to organise files, like having a “School” folder with subfolders for different subjects.


By the end of this chapter, you will be able to,
• Define directories
• List the types of directories
• Explain the need of directories for organising files
• Learn to create directories on a computer
Have you ever lost a favourite toy because your room was too messy?
It’s so hard to find something when everything is scattered around, right?
But when you keep your toys organised in boxes, it’s much easier to find what you’re looking for!
Just like tidying your messy room helps you find things easily, computers also need a way to keep their files organised. But what if you have a lot of data to manage or need to find the exact location of a folder? That’s where directories come in!
You’ve already learned about files and folders from your previous lessons. In this chapter, you’ll learn how to create and organise folders to store and manage large
amounts of data, navigate through them easily, and simplify finding files.
Let us get started!
Directories are like containers that help you organise files and folders in a neat and structured way, making them easier to find and manage-Just like arranging your toys and belongings into boxes, making it easy to find exactly what you need! They are like a special folders on a computer that store files and other folders. For example, you might have a directory named “School Projects”, where you keep subfolders for subjects like “Math” and “Science”. In the “Math” folder, you could save your homework and project files.

Figure 2.2: Creating directories with various folders
We need directories to:
• Stay Organised: Directories enhance the organisation of files and folders by providing a hierarchical structure. For example, a directory named “Photos” with subfolders like “Vacations” and “School Events” to organise your pictures.
• Save Time: If everything is scattered, finding a specific file becomes hard. Directories make searching faster.
• Avoid Confusion: Without directories, files would pile up like a messy room, and you would have trouble remembering where everything is.
Directories can be of different types. Let’s explore them together.
Now that we understand why directories are so important, let’s explore the different types of directories and how they help keep our files and folders organised.

2.3: Types of directories
Let us understand the structure of these directories with an example given in Figure 2.4
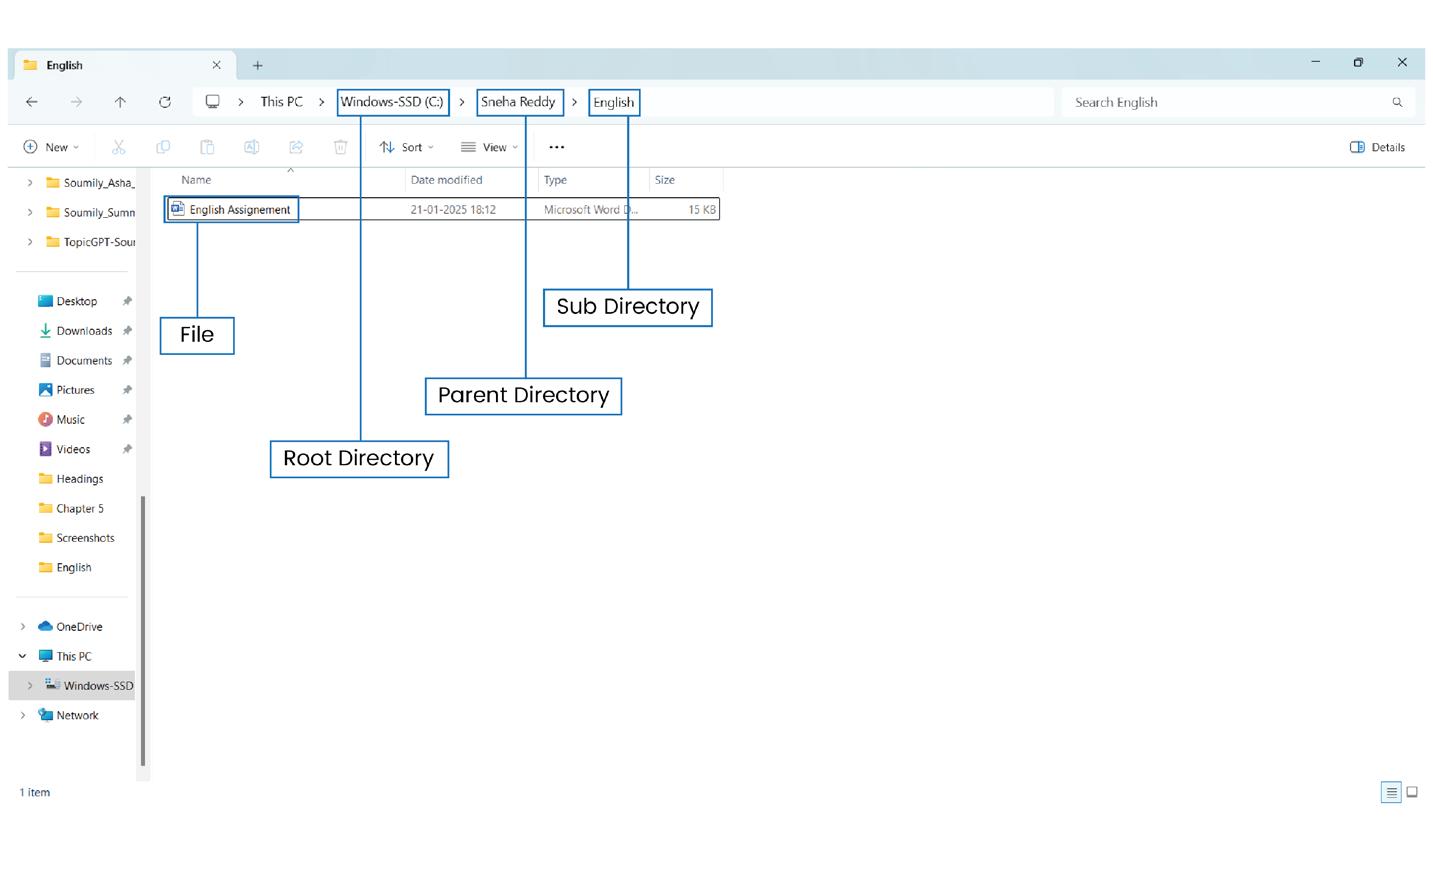
Figure 2.4: Structure of directories
• Root Directory (C:): The C drive expressed as C: is the root directory of your computer’s main partition. It holds everything in your computer’s main storage.
• Parent Directory (Sneha Reddy): Inside the C drive, we have a folder called Sneha Reddy. This is a parent directory because it’s the main folder under the root directory where we can store other folders and files related to Sneha Reddy.
• Subdirectory (English): Inside the Sneha Reddy folder, there’s another folder called English. This is a subdirectory, and it helps organise specific files related to English.
• File (English Assignment): Inside the English folder, we can have files like an English Assignment. This is a file stored inside the subdirectory, which could be a Word document, a PDF, or any other type of file.
So, the structure looks like this:
This way, you can keep all the files related to English neatly organised under the Sneha Reddy folder.
The hierarchical organisation of directories allows for easy navigation and management of files. A hierarchical structure organises items in levels, similar to a tree with branches. In computers, this means directories (folders) contain subdirectories, which can have their own subdirectories. This organisation simplifies file management, making it easy to locate, move, copy, or delete files. It keeps everything neat and organized, much like a contacts app for managing files.

Directories were inspired by office filing cabinets and first appeared in the 1960s to organise files on early computers!
Now that we understand how organising toys into boxes helps us find them easily, like files and folders in a directory, let’s take it one step further. What if, instead of putting all the toys into one box, we place them in separate boxes-cars in one, dolls in another, and blocks in another?
Yes, it’s much easier to find exactly what you’re looking for.
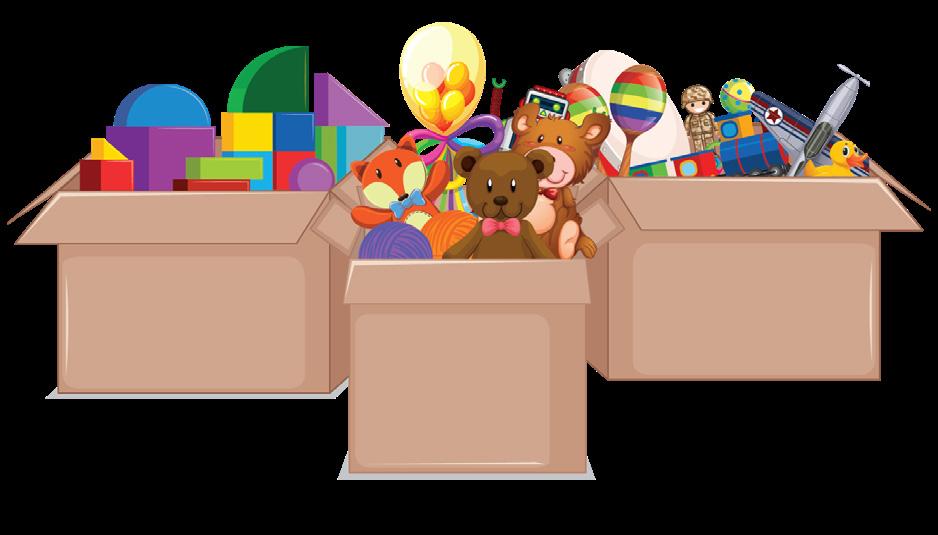
Figure 2.5: Toys arranged in different boxes
This is how directories work on a computer. Just like organising toys into separate boxes, directories allow us to organise files into specific folders, making it easier to manage and locate them. By following a logical structure and using categories, we can organise files in a
way that makes sense and keeps everything neat and accessible.
Let’s explore how we can create a well-organised directory structure that will help you find files when you need them!
A directory structure in a computer is like organising toys into labelled boxes on shelves, making it easier to find and manage items efficiently.
Let’s say we have a big folder called “School Projects”. Inside this folder, we can have smaller folders like “Science”, “Math”, and “English”. The “Math” folder could have even smaller folders like “Algebra” and “Geometry”.
Figure 2.6: Directory Structure
This way, when we need to work on a specific school project, we know exactly where to find it. We can go to the “School Projects” folder, then open the “Math” folder, and finally, find the “Algebra” folder. It’s like following a guide that helps us locate each project easily. We can keep adding more levels of folders within folders, just like stacking boxes inside each other.
There are different types of directory structures, but the ones listed below are the simplest and easiest to understand, helping you grasp the concept of directories better.
I. Single-level directories: Single-level directories, also called flat directories, are a basic method of organising files within an operating system.
Key features:
• All files are stored in a single container without subfolders, meaning every file is in the same folder.
• Finding a specific file can be time-consuming, as you may have to search through a long list.
While simple, single-level directories are less efficient for managing and locating numerous
files compared to multi-level directory systems.
II. Two-Level Directory: A two-level directory system organises files into two layers:
Top-Level Folder (Layer 1): The main folder (e.g., your name or a category like “School Work”) that holds everything.
Sub-Folders (Layer 2): Smaller folders inside the main one, used for organising files by category, like “Math” or “Science.”
This two-level system is a little more organised than a single-level directory. It helps you find your files faster because you have specific places for different types of work, just like how you organise your schoolwork in different folders in your backpack.
Go Explore

Activity 1
Let’s do an activity where we can learn more about the different types of directories. Try to find the names of other directories other than single-level and two-level directories. List down at least 3 below.

Create Your Own Directory Structure
1. Open File Explorer:
• Press the Windows Key + E on your keyboard, or
• Click the File Explorer icon in the taskbar.
2. Create a Root Folder:
• Think of a topic or subject you like (e.g., “School Projects”).
• Go to the location where you want to create the folder. For example, you can use “Documents” or “Desktop”.
• Create a folder and name it something like School Projects. This will be your root folder.
3. Create Subdirectories:
• Inside the School Projects folder, create at least three subfolders. These could be for different subjects, such as:
• Math
• English
• Science
• These folders will help you organize your projects by subject.
4. Add Files:
• Now, choose a subject and add a few files inside the corresponding subfolder. For example:
• Inside the English folder, create a text document named English Assignment.
• Inside the Math folder, add a file named Math Assignment.
• These are your files stored in specific subdirectories.

Guide students through creating a directory structure on their computers, encouraging them to organize files into root folders and subdirectories. Monitor their progress and help them understand how this organization makes finding files easier.
5. Navigate Through Your Directories:
• Open File Explorer (or Finder on Mac) and practice navigating through your directories:
• First, go to the School Projects folder (the root folder).
• Then, click on the English folder (a subdirectory).
• Finally, open your English Assignment file (your document).
So, Directories are one of the important parts of the operating system. They allow users to break down complex problems into smaller, more manageable tasks.

Directory - A folder that stores files and other folders on a computer.
Root Directory - The top-level directory in a file system.
Parent Directory - The main folder that contains subfolders or files.
Subdirectory - A folder inside another directory.
File - A document or piece of data stored on a computer.

• Directories are like containers that help organise files on a computer.
• The root directory is the topmost level of the file system, holding all other folders and files.
• A parent directory contains subdirectories and files, acting as the main folder for specific content.
• Subdirectories are folders within a parent directory, used to further organize files.
• Files are stored within directories or subdirectories, making them easy to locate.

I. Complete the Sentences: Choose the Correct Option from the Given Brackets
1. The ________ directory is the topmost level of a file system.
2. A ________ directory contains subdirectories and files.
3. Folders within a parent directory are called ________.
4. The ________ tool is used to navigate and manage directories on a computer.
5. Files stored inside directories or subdirectories are easy to ________.
1. The root directory is the same as a subdirectory.
2. A parent directory can hold both files and subdirectories.
3. Files can only be stored in the root directory.
4. Subdirectories are used to further organize files inside a parent directory.
5. Directories are not necessary for organizing files on a computer.
III. Match the following
Column A
1. Root Directory
2. Parent Directory
3. Subdirectory
4. File
Column B
A. Holds files and subdirectories
B. Topmost level of the file system
C. A piece of data or information
D. Folder within a parent directory Activity Time

Find the following words in the puzzle below:
Root, Parent, Subdirectory, File, Folder, Structure, Explorer, Organize, Drive.


By the end of this chapter, you will be able to,
• Describe the structure of an Excel workbook
• Demonstrate data formatting techniques
• Design a simple spreadsheet to record the data
• Use charts to visualise the data
Meet Aarohi, a young girl who lives in a friendly apartment building. One day, she and her friends decide to organise a Fun Fair for everyone in the society. But planning a fair isn’t easy! Aarohi has so many things to think about:
• She needs to keep track of how many flats are in the society.
• She must note who has contributed money and how much.

• She wants to figure out the total money collected and compare it with the budget for the fair.
She starts by writing everything in a notebook. But soon, her notebook gets messy, and she realises it’s hard to add numbers or make changes quickly. Aarohi wonders, “Is there an easier way to manage all this information?”
That’s when Aarohi’s elder cousin tells her about a fantastic tool called MS Excel!

Aarohi learns that with MS Excel, she can:
• Create tables to organise her data neatly.
• Quickly add numbers to calculate totals.
• Use charts to show the data visually, like a picture!

Figure 3.2: Data visualised as charts
Let us join Aarohi where she learns everything about MS Excel.
Microsoft Excel (MS Excel) is one of the most powerful tools on a computer, designed to help us work with numbers and data in an easy and organised way. It is part of the Microsoft Office suite and is used all over the world for solving problems, creating projects, and analysing information. Excel works like a smart notebook that helps you:
• Arrange your data neatly in rows and columns.
• Add, subtract, or multiply numbers in seconds.
• Turn your data into colourful visuals that are easy to understand.
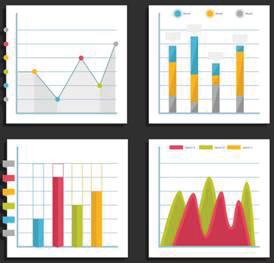

Figure 3.3: Data represented in charts, rows, and columns
In Excel, the data is stored in worksheets. These worksheets can hold a mix of numbers and words, making it ideal for everything from simple lists to complex calculations. Whether you want to plan a budget, track your allowance, or make a survey chart, Excel makes it all possible!
To start Excel in the latest version of Microsoft Office (Office 365 or Office 2019), on windows OS follow these steps:
Step 1: Click on the “Start” menu located at the bottom left corner of your screen.
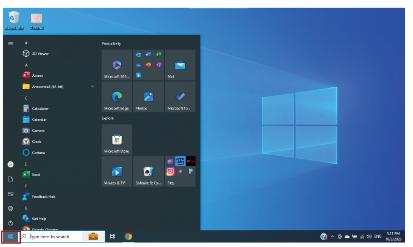
3.4: Clicking on Start button
Step 2: Type “excel” in the search bar
3.5: Typing ‘excel’ in search bar
Step 3: Click on the Microsoft Excel app icon.

3.6: Clicking on MS Excel icon
When you click on the Excel icon, the MS Excel interface appears, as shown in Figure 3.7. This figure labels the various sections of the interface. Let’s explore some of the key sections in detail.
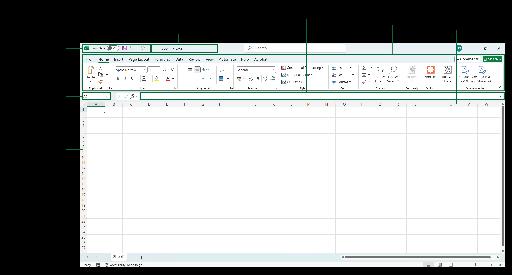
The Title bar is a place where the title (or) application name is displayed. It is located at the top of the window. Title bar contains minimise, maximise/ restore and close buttons. Figure 3.8 shows the title Flat Collection that Aarohi writes for her excel sheet.

It is present on the title bar. The commands which are used frequently are displayed in the Quick Access toolbar. The Save, Undo, and Redo commands are displayed by default on the Quick Access toolbar. You can add more tools to the Quick Access Toolbar.

3.9:
III. Ribbon
Excel displays a tabbed Ribbon format. The ribbon has multiple tabs, each with several groups of commands. Every tab contains one or more groups. Few groups are having an arrow for more options.
IV. Rows, Columns, and Cell
In Microsoft Excel, data is organised in a grid of rows, columns, and cells. Let’s understand each:
a. Rows:
Rows run horizontally and are identified by numbers (1, 2, 3, etc.).
b. Columns:
Columns run vertically and are identified by letters (A, B, C, etc.).
c. Cells:
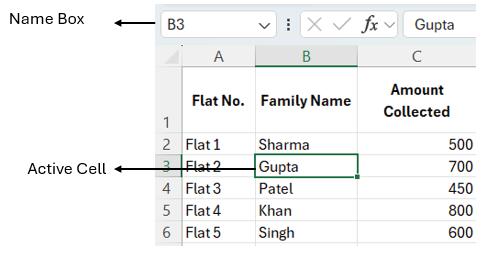
A cell is where a row and column intersect. Each cell has a unique address (e.g., A1, B2). The active cell is the one ready for input or editing, highlighted with a border.
Let’s see how Aarohi organises her data in Excel and identify the rows, columns, and cells within it.
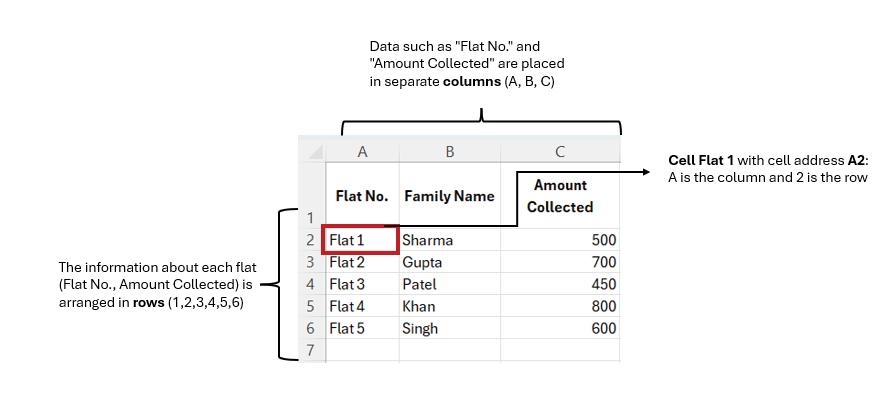

From figure 5.11, write down the cell address for the following cell values:
Gupta: _________
Flat 4: _________
700: _________
V. Name Box
The Name box displays the address of the active cell. You can also jump to a specific cell by typing its address in the Name box.
VI. Formula Bar
The Formula bar shows the content entered in a cell. It is also used to input or edit formulas and is marked with the function symbol fx.

3.13:
A worksheet is a single sheet within an Excel workbook where you can organise, calculate, and analyse data in a grid of rows and columns. Multiple worksheets can be created in a single workbook. A workbook is an Excel file that contains one or more worksheets.

3.14: Sheet 1 as a worksheet
3.2.1. To insert a new worksheet

1. Select the “New Sheet” button located at the bottom of excel screen.
2. A new blank worksheet will be created (Sheet-2)
Note:- You can press Shift + F11 to insert a New Worksheet.
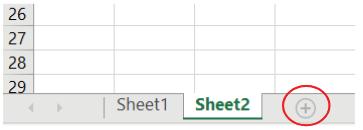
3.15: New worksheet
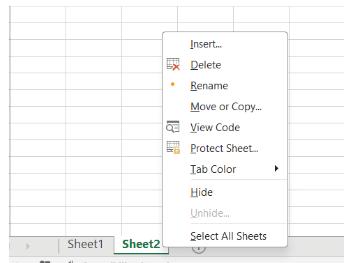
3.2.2. To rename/Delete a Worksheet
Step 1: Right-click the worksheet you want to rename/delete, then select rename/
delete from the worksheet menu.
Step 2: In case of rename type the desired name for the worksheet and delete if you wish to delete the sheet.
Step 3: Click anywhere outside the worksheet tab or press Enter on your keyboard.

Cells are the basic building blocks of an Excel spreadsheet, and understanding how to work with them is essential.
Some key concepts related to working with cells in Excel:
Selecting cells can be done in many ways. To select a single cell, click at the center of the cell. A thick green border appears around the cell which shows that it is the active cell.
• Select all Cells: To select all the cells in a worksheet, click on the select all button.

3.17: Selection of cells
• Select an entire Column: Click on the column header of the column which you want to select.

3.18: Selection of columns
• Select an entire Row : Click on the row header of the row which you want to select.

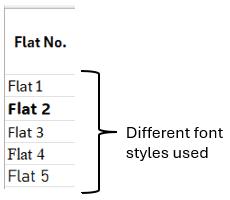
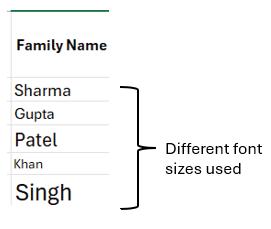
Excel provides a wide range of formatting options. You can change the font, text size, alignment, fill colour, and more by using the Font options of Home tab. This allows you to make your data more visually appealing or better organised. Let us see how Aarohi’s data can be formatted with some of the properties.
I. Font Size and Style
This feature is available in the Home tab. Using this, we can change the size of the letters, numbers, symbols used along with the style of the content.
Just like coloring with crayons, you can use colors in Excel to highlight important numbers or headings, such as making key figures red or titles blue.


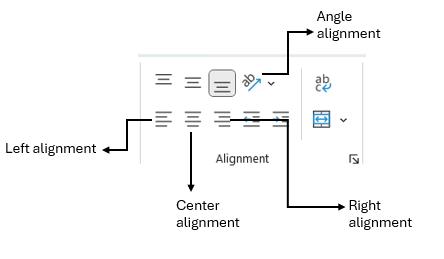
III. Alignment
This feature is also available in Home tab. It is like arranging text in your notebookyou can position numbers or words to the left, right, center, or at an angle to keep your data neat and organised.

IV. Number Formats
You can make numbers easy to read by adding symbols like ₹ and deciding how many decimal places to show, such as ₹150.50 for Aarohi’s collection data.


3.23: Applying currency number format’

Customise Your Excel Interface
Instructions:
1. Open Excel and explore the colourful’ ribbon at the top.
2. Change the color scheme by going to “File,”“Options,” and selecting a preset option.
3. Right-click on the ribbon to add or remove tools.
4. Create shortcuts by going to “Customise the Ribbon” and assigning keyboard shortcuts.
5. Take a moment to admire your personalised Excel workspace.
6. Use the customized tools and shortcuts to perform basic tasks in Excel. Have fun customizing and exploring Excel!

Create a worksheet in MS-Excel and make a list of all your friend’s information.
a. In cell A1, type “Friend name”.
b. In cell B1, type “Class”.
c. In cell C1, type “Favourite food”.
d. In cell D1, type “Favourite color”.
e. In cell E1, type “Favourite hobby”.
f. Save the workbook as “Friends data”.


In an Excel spreadsheet, enter the names of five students and their computer marks. Use the first column for student names and the second column for computer marks.
Aarohi has learned the basics of Excel. To update the apartment members about their contributions, she wanted to share the data with them. With her cousin’s help, Aarohi created charts to make the data more engaging instead of just sharing plain numbers. This inspired Aarohi to explore charts in Excel further. Let us learn about charts.

Enhance students’ data analysis and visualization skills using Excel. Students import and analyze datasets. create visualizations, and present findings to the class.
Charts in Excel are a powerful way to turn numbers and data into colourful, easy-tounderstand visuals. Instead of reading through long lists of numbers, charts help you quickly see patterns, comparisons, and trends in your data. Whether you’re tracking how much money Aarohi collects from each flat or how many books students have read, charts make it easier to understand the information immediately.
Learning to work with charts in Excel can turn your data into colourful, easy-tounderstand pictures. Let’s follow the steps to create a chart, just like Aarohi would!
Step 1: Gather Data
Aarohi begins by collecting data to track how much money she collected from each flat for the event. Here is an example of her data:

Figure 3.25: Data collection
Step 2: Select Data
To create a chart, Aarohi needs to select the data she wants to display. She clicks and drags to highlight Column A (Flat Numbers) and Column D (Amount Collected).

After selecting the data, Aarohi is ready to create the chart. She clicks on the Insert tab at the top of the Excel window. In the Charts section, she chooses the 2-D Column Chart. The chart now appears, showing bars that represent the amount collected from each flat.
Aarohi observes that taller bars mean more money was collected.


Step 4: Customise the Chart
Aarohi wants her chart to look more colourful and easy to understand. She learns that she can:
• Change the colours of the bars.
• Add a title to the chart (e.g., Money Collected from Flats).
• Label the X-axis (Flat Numbers) and Y-axis (Amount Collected). It’s like decorating her chart to make it neat and clear!

Figure 3.28: Customising chart with colours, axis titles
Step 5: Read the Chart
Aarohi now looks at the chart to understand the data: She quickly notices that Flat 4 collected the most money because it has the tallest bar!
Step 6: Share the Chart
Aarohi wants to share her chart with the apartment members. She right-clicks on the chart, copies it, and pastes it as an image in a message. The members can now clearly see the contributions made by each flat.
Saving your work in Excel ensures you don’t lose your progress. Let us learn to save the work done along with Aarohi until now.
1. Look for the “File” tab at the top-left corner of the Excel window and click on it.
2. From the menu, select “Save As” to save your work for the first time or in a new location.
3. Pick a folder or location on your computer where you want to save the file.
4. Type a name for your file in the “File Name” box to help you find it later.
5. Press the “Save” button, and your Excel sheet will be saved.
Note: To save quickly after the first time, just click Ctrl + S on your keyboard!

Imagine you and your friends conducted a survey to find out everyone’s favorite fruits. You collected the following data:
Your task is to create a chart that shows the number of votes for each fruit. Choose an appropriate chart type and customise it with colours and labels to make it visually appealing. Present your chart to your classmates and tell them which fruit received the most votes and which one received the least.
Here we come to the end of our chapter. MS Excel is a very important tool. Let’s begin practicing with it in lab with many tasks and challenges. In the next academic year, we will continue our exploration of Microsoft Excel and delve deeper into its features. We will uncover the magic of charts and learn how to create various types of charts to present data in a visually appealing and meaningful way. Additionally, we will discover more advanced functions, formulas, and tools that will further enhance our ability to handle data efficiently and tackle complex tasks.

Excel- A powerful spreadsheet software developed by Microsoft. Interface- The visual and interactive elements that allow users to interact with a program.
Workbooks- Files in Excel that contain data, formulas, and worksheets.
Worksheets- Individual sheets within a workbook where data can be entered,
organised, and manipulated.

• Excel is a powerful tool for organizing, analyzing, and presenting information.
• The Excel interface can be customized to suit your preferences and create a personalized workspace.
• You can open Excel by locating the Microsoft Office folder in the Start menu and clicking on the Excel icon.
• Workbooks hold data and worksheets, and you can create a new workbook from scratch or use pre-defined templates.
• Excel offers options to save your work using the “Save” command for regular changes and“Save As”to create copies, accessed through the Quick Access Toolbar or the File menu.

I. Fill in the blanks
1. Excel is a popular ________ software.
2. Cells are organised in _______ and _______ in Excel.
3. The intersection of a row and a column is called a _______.
4. The formula bar is located at the _______ of the Excel window.
5. The shortcut to select all the cells in a worksheet is _______.
II. State True or False
1. Excel is used primarily for word processing.
2. Formulas in Excel always begin with the equal (=) sign.
3. The SUM function in Excel is used to add up values in a range of cells.
4. Excel can only handle numerical data, not text.
5. Excel allows you to create charts and graphs to visualize data.
III.Short answer questions
1. What is the purpose of using a spreadsheet program like Excel?
2. Name two functions commonly used in Excel and briefly describe what they
do.
3. How can you format a cell to display currency values?
4. What is a formula in Excel and how is it used?
5. What is the difference between a worksheet and a workbook in Excel?
1. Describe the steps you would take to create a simple budget in Excel, including creating categories and entering values.
2. Explain how you can use Excel to create a chart or graph to represent data visually. Provide an example.
3. Discuss the importance of using formulas and functions in Excel. Provide at least three examples of situations where formulas or functions can be beneficial.
4. Explain the concept of cell references in Excel and how they are used in formulas.
5. Discuss the different types of data that can be entered into cells in Excel, including text, numbers, and formulas.

In Microsoft Excel, you have a list of animals and their respective speeds. Your task is to create a bar chart to visually represent the speed of each animal. Follow these steps:
• Open Excel and create a new worksheet.
• List five different animals in column A (e.g., Cheetah, Horse, Penguin, Elephant, Snail).
• In column B, enter the corresponding speeds for each animal (e.g., 75, 40, 5, 25, 0.03).
• Highlight the data in columns A and B.
• Navigate to the “Insert” tab and choose “Bar Chart” from the chart options.
• Observe how Excel automatically generates a bar chart representing the speeds of each animal.
Experiment with changing the speeds in column B. Update the values and observe how the bar chart dynamically adjusts to reflect the changes. Discuss what you observe and any patterns you notice.


By the end of this chapter, you will be able to,
• Define email and its importance
• List various email service providers
• Demonstrate how to write and send an email using an email service provider
Aarohi looked at her colourful chart in Excel and felt proud of her work. She decied to share it with all the apartment members. But instead of finding a faster way, she copied and pasted the chart into individual messages for each member. By the time she finished, she was exhausted. Aarohi realised there had to be a simpler and quicker way to share the chart with everyone at once. This is where Email came to her rescue!
In this chapter, we’ll explore how to compose and send emails, attach files like Aarohi’s chart, and ensure your message reaches all the right people at the same time. Let’s dive in and learn how email makes sharing and communication easy for everyone! Let us get started!
Email, short for electronic mail, is a method of exchanging messages and information over the Internet. It allows people to send and receive text, documents, pictures, and other digital files instantly to anyone with an email address, no matter where they are in the world.
For example, when you want to share your homework with your teacher or send birthday wishes to a friend who lives in another city, you can use email. It reaches
them in just seconds!
But where did it all begin?
Email was invented in the 1970s by a computer engineer named Ray Tomlinson. He created a way for people to send messages between computers using the @ symbol, which is still used in email addresses today. Back then, computers were very large and not as common as they are now.
Over time, email became faster and easier to use, allowing people all over the world to connect instantly. Today, email is an important tool for communication, helping us send messages, share pictures, and stay in touch with friends and family.

4.1.1 Parts of an Email
An email typically consists of the following parts:
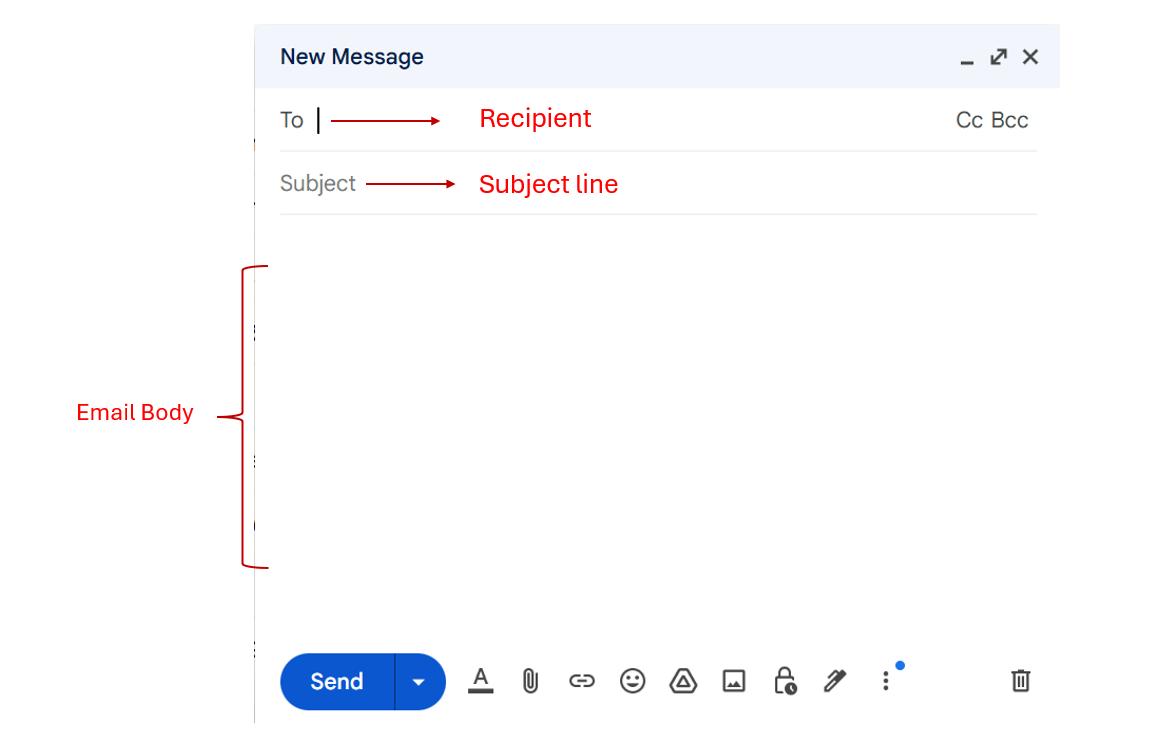
4.2: Parts of an email
1. Recipient (To):
This is where you enter the email address of the person you want to send the message
to. It ensures the email reaches the intended person or group.
2. Subject Line:
The subject line summarises the email’s content. It helps the recipient understand the purpose of the email immediately.
3. Email Body:
This is the main section where you write your message. It can include plain text, formatted text, images, links, or attachments, depending on the purpose of the email.
Email service providers are companies that give us the tools to send and receive emails. They make it possible for us to have our own email addresses. These companies have special computers and programs that help us manage our emails.
Some popular email service providers include:

1. Gmail: This is from Google, and you might have seen email addresses that end with “@gmail.com”.
2. Yahoo Mail: Yahoo provides email services, and their email addresses end with “@ yahoo.com”.
3. Outlook: This one is from Microsoft, and you’ll find email addresses like “@ outlook.com” .
These companies help us create email accounts, store our messages, and keep our emails safe. We can choose the one we like best and sign up for an email account to start sending and receiving emails.
Creating an email account is like getting your own personal mailbox on the internet. Here’s how you can do it:
Step 1: Choose an Email Service Provider
• Pick one that you like, such as Gmail, Yahoo, or Outlook.
Step 2: Sign Up
• Go to the website of your chosen provider (e.g., www.gmail.com).
Step 3: Click on “Create account”.

Step 4: Fill in Your Information
• You must enter your full name, a chosen email address, and a password. Make sure to choose a password that’s strong (at least 8 characters long and includes numbers and symbols).
Step 5: Set Up Security
• You might be asked to enter a phone number or an alternate email for security purposes (this helps if you forget your password).

Step 6: Agree to the Terms
• Read and accept the terms and conditions.

Step 7: Verify Your Account
• Check your email inbox for a verification message from your provider. Click on the link to verify your email.
Step 8: Start Using Your Email
• Once verified, you can start sending and receiving emails, organizing your inbox, and customizing settings like your profile picture.

Task: Create a Gmail Account
To create your own Gmail account for lab class, (ask your parents to help you) follow these simple steps:
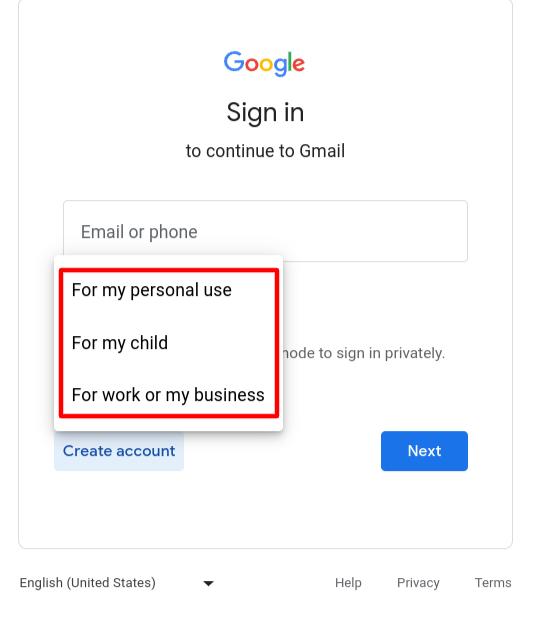
1. Go to www.gmail.com and click on “Create account”.
2. Select “For my child”.
3. Fill in your first and last name and choose a unique username (Gmail address) for you.
5. Create a strong password (at least 8 characters long with a mix of letters, numbers, and symbols).
6. Click “Next” and enter your birthdate, gender, and recovery email (if available).
7. Review and agree to the terms of service, then click “Create account”. Your parents will then be able to manage your account, and they can share the login details with you to use it in your lab class.
Email is a powerful tool that allows you to communicate, share files, and collaborate with others quickly and efficiently. Now let us explore the key operations you can perform with email and how they make communication seamless.
The first step in using email is writing your message. To send an email, you need two important things:
1. Your own email account
2. The receiver’s email address. Your email address is like your house’s address. Let us understand an email address with an example: emmaraichel123@gmail.com
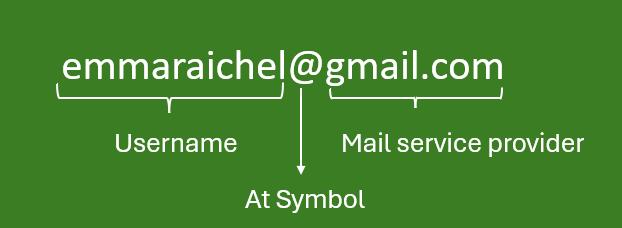
Here,“emmaraichel” is your username,“gmail.com” is your mail service provider, and “@” is the “at” symbol.
To send and receive emails there are certain steps that must be followed. Here are the steps to send a mail,
Step 1: When you need to create new mail, click on the compose button on the top left of the screen.

4.8: Compose Email
Step 2: The box in the figure 4.9 will appear. Type the receiver’s email address in the ‘To:’ section.

Figure 4.9: Compose Mail
Step 3: Write the subject of your mail in the Subject box.
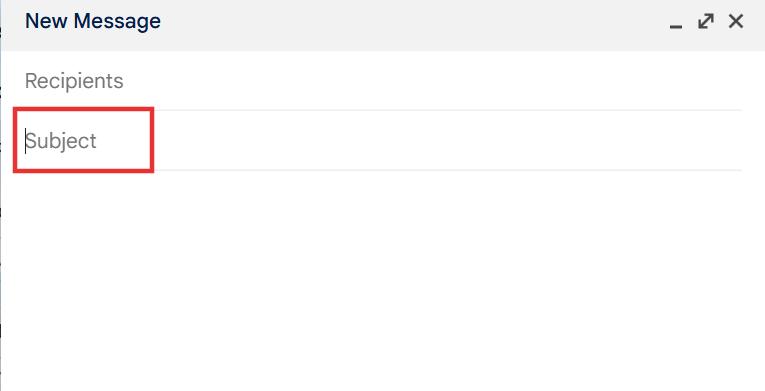
Figure 4.10: Add Subject
Step 4: Then type the content in the Message box. And to send the mail, you must click the send button.
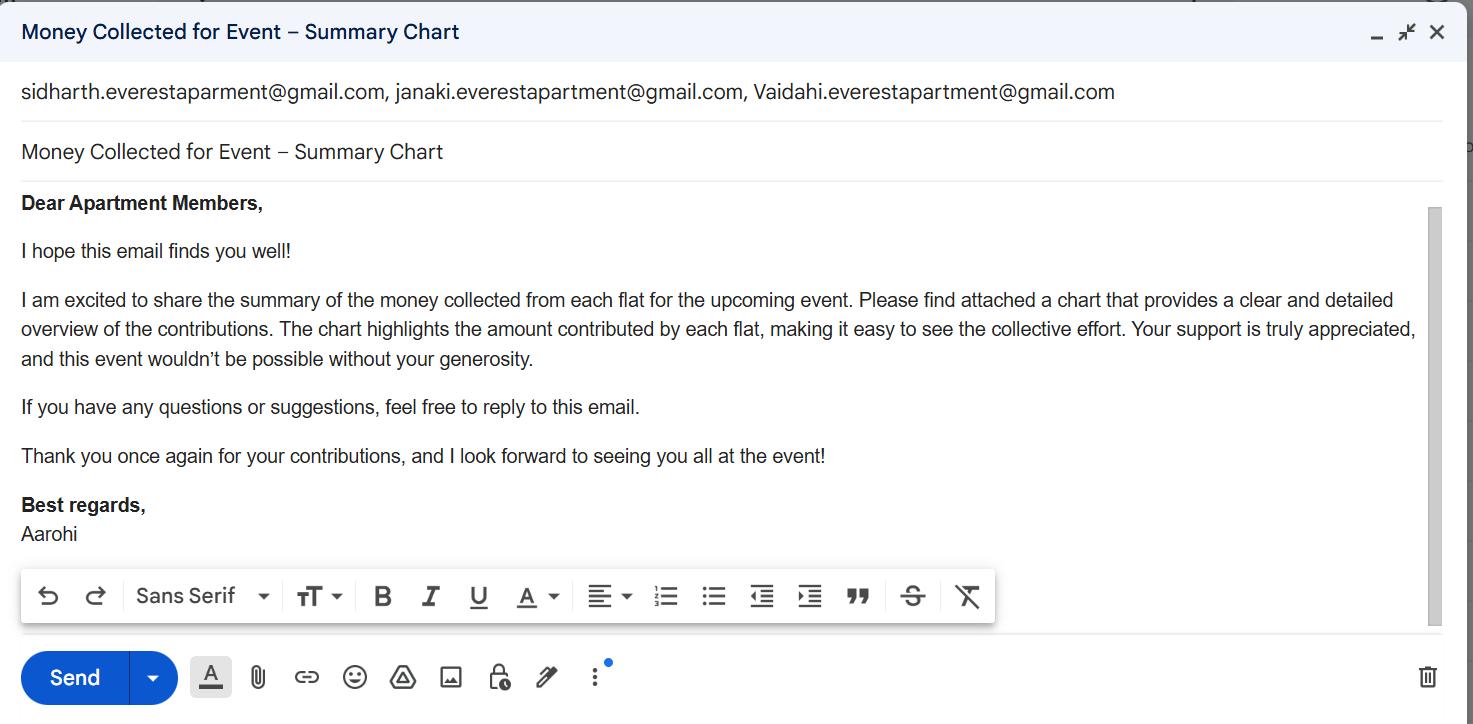
Step 5: To view the emails you have sent, go to the “Sent” folder.
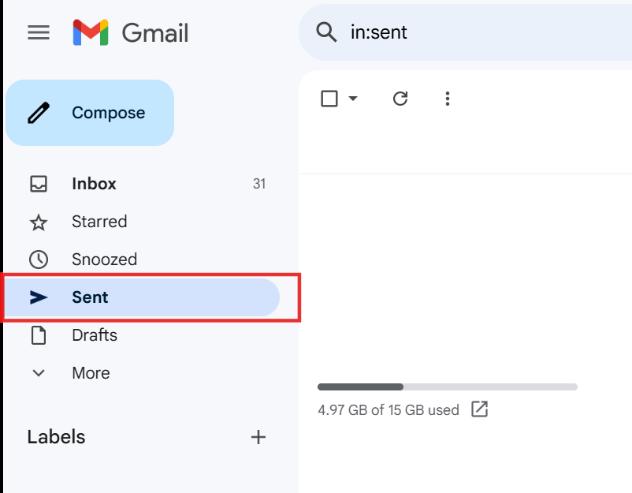
Figure 4.12: Sent box in Gmail
Step 6: To receive email, open your email Inbox and look for new messages. You can read, reply, or organise your emails into folders.

You can send the same email to many people at once using these fields:
• CC (Carbon Copy): Sends a copy of the email to other recipients who need to stay informed.
• BCC (Blind Carbon Copy): Sends a copy to recipients without revealing their email addresses to others.

Want to share documents, images, or charts? Use the Attach File option to include files in your email:
• Click the Attach button (usually shown as a paperclip icon).
• Select the file from your computer and upload it. For example, Aarohi can attach her Excel chart to share it with the apartment members.
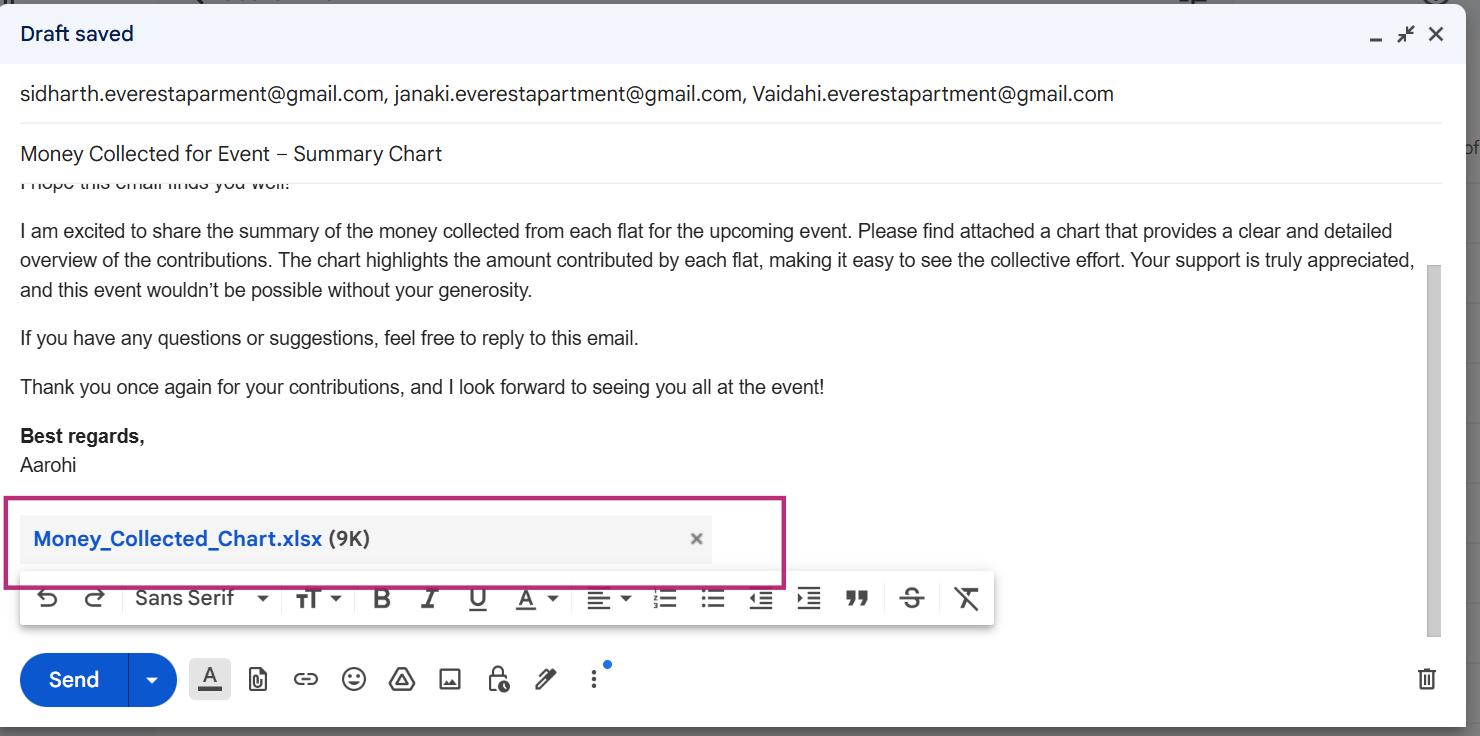
An attachment in an email is a file that you send along with your message. It can be a document, image, video, or any other type of file.
To add an attachment:
Step 1: Click on the paperclip icon while composing an email.
Step 2: Select the file you want to send from your device. Wait for it to upload, then click Send
Tip: Always check if the file is uploaded properly before sending the email!

Formatting an email is essential to make your message clear, professional, and easy to read. By using the tools provided in most email clients, you can emphasise key points, organise information, and make your email visually appealing. Let’s explore the main formatting tools:
1. Add Bold or Italic Text for Emphasis
• Bold Text: Use bold to highlight important parts of your message, such as deadlines, names, or key points.
Example: “Please submit the report by Friday, 5 PM.”
• Italic Text: Use italics to emphasise words or phrases subtly, such as technical terms or quotes.
Example: “The theme for the event is ‘Together We Achieve More’ ”.
2.
Organised text is easier to read and follow.
• Bullet Points: Use these to list items that don’t require a specific order.
Example:
The items needed for the event are:
• Decorations
• Food and beverages
• Sound system
• Numbering: Use numbers for steps or ordered lists.
Example:
Steps to access the chart:
1. Open the attached file.
2. View the “Summary” tab.
3. Contact me if you have questions.
Instead of typing out long URLs, embed hyperlinks into words or phrases to make your email more professional and user-friendly.
Example:
Instead of: “Visit http://www.eventdetails.com for more information.”
Write: “Click here for more information.”
Replying and forwarding emails are essential skills for using email effectively and communicating with others.
• Replying to Emails
The Reply option in Gmail allows you to respond only to the person who sent you the email. On the other hand, the Reply All option lets you respond to everyone who received the original email. It’s important to use Reply All carefully to avoid sending unnecessary messages to others.

Figure 4.17: Reply Option
• Forwarding Emails
Sometimes, you might receive an email that you want to share with someone else. When you forward an email, you are sending a copy of the original email to another person’s email address. To do this, you can click on the “Forward” option in your email program.

Figure 4.18: Forward
A new email window will open, and the original email’s content will be there. You can type the email address of the person you want to send it to in the “To” field. If you want, you can also write a little message to explain why you are forwarding the email. Then, click the “Send” button to forward the email to the new recipient.
Organising your emails is important to keep your inbox neat and make it easier to find what you need. Here are three simple ways to keeping your emails well-organised: 1. Folders
Folders are like digital file cabinets that help you sort emails into categories. How to Use them:
• Create folders for different topics or purposes, such as “Work,” “Family,” or “ Events”.
• Drag and drop emails into the appropriate folder after reading them.
• Example: Aarohi could create a folder called “Apartment Events” to store all eventrelated emails.

4.19: Folders to organise emails
Note: To create a folder in Gmail, click “More” on the left, select “Create new label,” name the folder (e.g., “Apartment Events”), and click “Create,” then drag and drop emails into it.
A powerful tool that helps you locate specific emails using keywords.
• Enter the sender’s name, subject, or a unique word from the email in the search bar.
• Use advanced search options, like date ranges or attachment filters, for more precise results.
Example: If Aarohi wants to find the email about the summary chart, she could search for “summary chart.”

4.20: Search option in email
3. Filters
Filters are rules that help organise your emails automatically. Filters work by looking for specific words, senders, or subjects in your emails and sorting them based on the
rules you create.
How to Use Them?
• Set up a filter to automatically move emails from specific senders or with specific keywords into designated folders.
Example: Aarohi could create a filter that directs all emails with the subject “Event Contribution” to her “Apartment Events” folder.

Figure 4.21: Filter option in email
Note: To set up a filter in your email, open the desired email, click on the three-dot menu, select “Filter messages like these,” define the criteria such as sender or keywords, choose an action like moving to a folder or assigning a label, and save the filter.
Netiquette refers to good manners and proper behaviour when using email and the Internet.
It includes being polite, using appropriate language, avoiding spam or unnecessary emails, and respecting others’ privacy.
Rules to be followed while accessing email:
• Should not provide the personal information such as address, telephone number, work address, name and location.
• Should not use abusive language while mailing or chatting.
• Do not upload pictures, images and sound files that are not acceptable.
• Avoid downloading mails from unknown senders.

Think and answer the below given question.
You received an email from an unknown sender with an attachment. What are some precautions you should take before opening or downloading the attachment? Why is it important to be cautious?

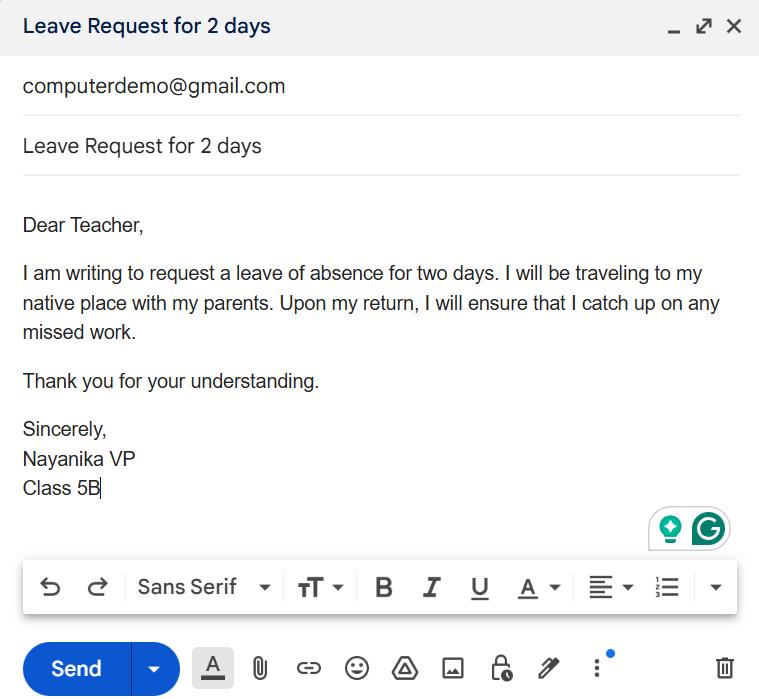
Task: Sending a Leave Request
• Log into your email account or ask a parent to help you log in.
• Use the teacher’s email ID (provided by the teacher).
• In the Subject, write: “Leave Request for 2 days”.
• In the email body, include:
• A polite greeting.
• Reason for leave.
• Your name and class.
• A polite closing, such as “Thank you for your understanding”.
In previous lesson, Aarohi has mastered using Excel to organise and present her data, like creating a colourful chart to show the money collected from each flat for an event. After completing her Excel work, she learned how to use email to share her chart with all the apartment members at once. Instead of sending individual messages, Aarohi can quickly attach her Excel file or copy the chart into the email, making it easy to communicate her work efficiently and professionally. This combination of skills-using Excel for data presentation and email for communication-helps Aarohi stay organised and connect with others in a timely manner.

E-mail - E-mail is the short form of Electronic mail. E-mail is a way of sending messages to people by means of a computer connected with another computer through the internet.
Netiquette - Netiquette means using good manners when we’re online. It’s about being polite and safe when we talk to others on the internet.

Create a demo email ID (for example: computerdemo@gmail.com) specifically for this chapter. Share it with the students so they can practice by sending emails to this ID.

• E-mail is a computer-based program that allows users to communicate with one another through the exchange of message.
• To use email or send and receive email, you must have an email account.
• Attachments in emails let you share files like pictures or documents.
Exercise

I. Fill in the blanks
1. The “@” symbol in an email address is used to separate the __________ from the service provider.
2. To create an email account, you need to go to the website of your chosen __________ and click on “Create account.”
3. The __________ option in Gmail allows you to send a copy of an email to others without revealing their email addresses to other recipients.
4. An attachment in an email can be added by clicking on the __________ icon while composing the email.
5. The concept of __________ refers to good manners and proper behaviour while using email and the Internet.
II. Choose the correct answer
1. What does CC stand for in emails?
a. Carbon Copy
b. Circular Copy
c. Computer Copy
d. Central Copy
2. Which of the following is an example of an email service provider?
a. Gmail
b. Chrome
c. Windows
Google Maps
3. What is the purpose of the “Subject” line in an email?
a. To attach a file
b. To summarise the purpose of the email
c. To add the recipient’s address
d. To write the main content
III.Answer the following
1. What is an email?
2. Explain the term netiquette with examples.

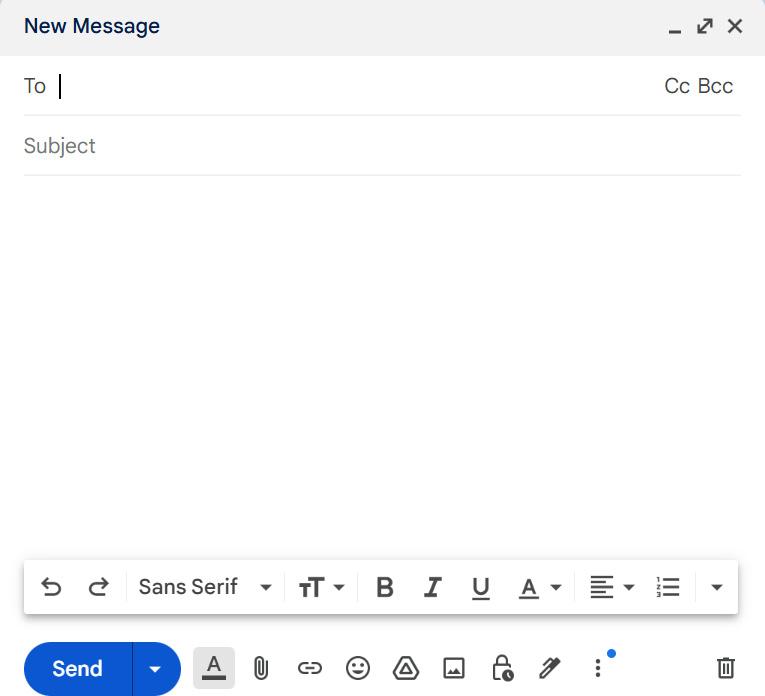
Task: Complete the email invitation for your birthday party
Look at the given picture of the email window. Fill in the required fields:
1. To: Write your friend’s email address.
2. Subject: Add an appropriate subject line, such as “Birthday Party Invitation!”
3. Email Body: Write a message inviting your friend to your birthday party. Include details like the date, time, and location.


By the end of this chapter, you will be able to,
• Identify binary numbers and their role in computer programming
• Explain programming languages and their types
• Explore Blockly as a visual programming platform
Imagine you and your friends are playing a game of Simon Says. One of you is the leader and calls out instructions like:
• Simon says, “jump!”
• Simon says, “touch your toes!”
• Simon says, “clap your hands!”
You follow the instructions only if the leader says, “Simon says”. If not instructed, you stand still. To play the game well, you need to listen carefully, understand the rules, and act accordingly.

Now, think about computers. Have you ever wondered how a computer knows what to do when you click a button, play a game, or type a message? Computers work
in a similar way to Simon Says-but their instructions are much simpler. They only understand two numbers: 1 and 0. These 1s and 0s are called binary numbers, and they are the most basic way computers operate.
Figure 5.2: Binary Numbers
But wait! If computers only understand binary, how can we tell them what to do? Imagine if you had to play Simon Says using only 1s and 0s-it would be confusing, and difficult to give instructions, right? This is where programming languages come in!
Programming languages serve as a bridge between humans and computers. They allow us to give instructions to the computer. The computer then translates these instructions into binary code and understands what to do. Before learning about computer languages, let’s first understand binary numbers.
Binary numbers are a special language used by computers, consisting of only two digits: 1 and 0, just like how flashlights are used to send signals in two ways: ON and OFF.
Computers are made up of tiny parts called transistors (You will explore these terms in higher grades.) that can either be ON or OFF. Using 1 and 0 helps computers work quickly and accurately.
Computers store and process all information using these binary digits. This system enables them to perform calculations, run programs, store data, and communicate with other devices.
Binary is the foundation of digital technology, making it possible for computers to work efficiently and reliably.
Each digit in a binary system that is 0 or 1, is called a bit. A bit is the smallest unit of digital information. The position of each bit determines its value, based on powers of 2. In our usual counting system (called decimal), we have 10 digits: 0, 1, 2, 3, 4, 5, 6, 7, 8, and 9. Once we reach 9, we add another digit to make 10. In binary, we have only two digits: 0 and 1. When we reach 1, we add another digit to make 10 (which is “two” in decimal). Here’s how binary counting looks:
Table 5.1: Binary and Decimal number system
Binary uses place values like decimal, but instead of 10s, 100s, and 1000s, binary uses 1s, 2s, 4s, 8s, 16s, and so on.
The rightmost digit is the ones place. The next digit is the twos place. Then comes the fours place, the eights place, and so on. For example, in the binary number 101, the position of each bit determines its value
based on powers of 2:
• The rightmost bit (1) is 1×2^0 = 1.
• The middle bit (0) is 0× 2^1 = 0.
• The leftmost bit (1) is 1×2^2 = 4.
Adding these values together: 4+0+1=5.
So, the binary number 101 equals the decimal number 5. The binary number 101 has three bits, when there are 8 bits binary numbers, we call it as 1 byte. That means 1 byte=8 bits
Figure 5.4: Bit and Byte representation
Computers operate using electrical signals in circuits, and binary provides an efficient way to interpret these signals:
0 represents low voltage (OFF)
1 represents high voltage (ON)
Think of it like a light bulb: when it’s off, it’s 0; when it’s on, it’s 1. This simple system forms the basis for how computers process tasks.

Think and Answer
Practice Counting in Binary: Write
numbers for 6, 7, and 8.
Binary numbers may seem like a puzzle, but they’re super simple once you understand them. They’re the foundation of everything computers do. Now, you’re one step closer to thinking like a computer genius!

Read the sentences, imagine the event in your real life, represent the output as 0 and 1 in binary state
Rahul switched on the light.
When you press the power button of a smart phone to off, the smart phone switched off.
When we start the vehicle, the engine turns on


Gottfried Wilhelm Leibniz, a German mathematician, is individually recognised as an
inventor of the modern binary system.
We now know that computers understand binary, but giving complex instructions, like displaying text or images, in binary can be difficult. To overcome this challenge, programming languages were developed to make it easier for humans to communicate with computers.
Just like how we humans use different languages like English, French, Hindi, etc. to communicate with each other, computers have their own languages too. They are called programming languages.
A programming language is a set of rules and instructions that humans use to communicate with computers. It allows us to tell a computer what tasks to perform, step by step, in a way it can understand. With programming languages, we can create games, websites, mobile apps, robots, and much more! Examples of programming languages include Python, Java, C, and Scratch. The people who write programming languages to give instructions to computers are known as programmers.
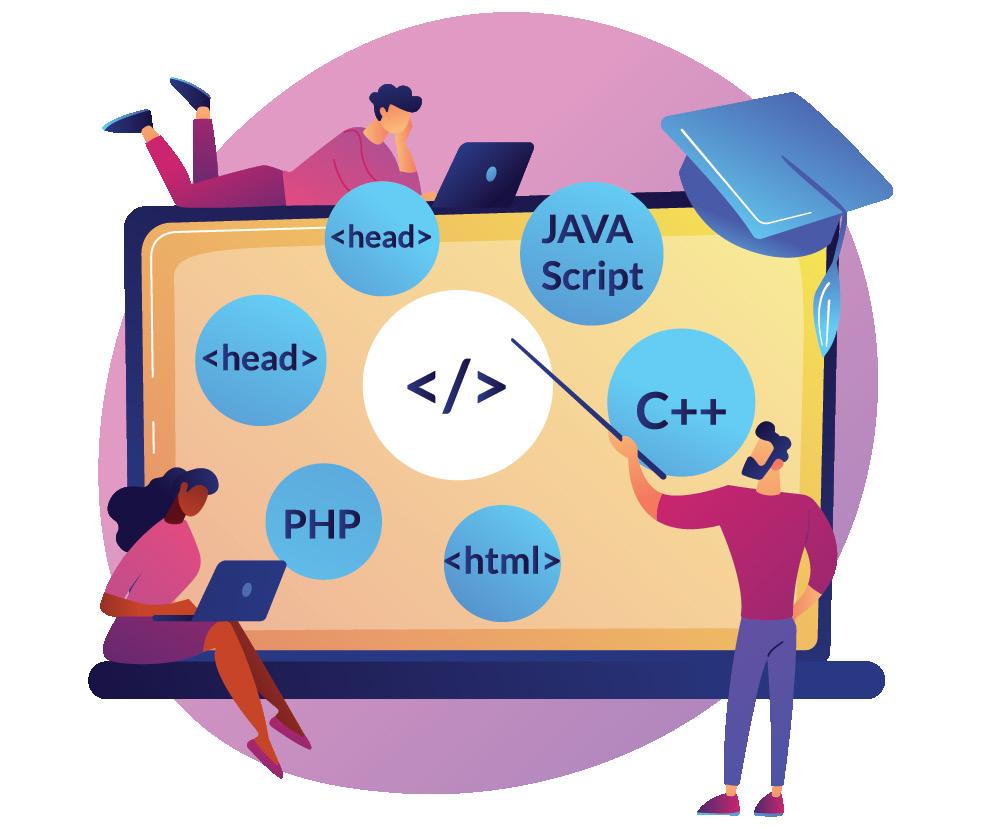
Programmers are the creators behind all the software and apps we use every day. They write the code that makes things like games, websites, mobile apps, and even robots work. By solving problems and creating useful tools, programmers bring ideas to life in the digital world.
In order to instruct a computer to perform a particular task, a computer programmer has to write a program.
5.2.1 Program
Imagine you have a robot friend, and you want it to make a sandwich for you. To do that, you need to tell the robot what steps to follow - like getting bread, putting on some peanut butter or jelly, and stacking it all together.

Figure 5.6: Robot preparing a sandwich
In the same way, a program is a set of instructions that tells a computer what to do, step by step.
Programs help us do things like browse the internet, play games, or solve math problems. Every action on your computer or phone is controlled by a program, which the computer translates into binary and follows-just like your robot friend follows steps to make a sandwich.
5.2.2 Types of Programming Languages
Programming Languages are divided into two types:
Figure 5.7: Programming Languages
I. Low-Level Languages
Low-level languages are like a secret code that computers understand easily but can be tricky for us to use because they’re closer to how computers think. These languages are designed to work directly with hardware and operate at a very
detailed level, much like giving precise, step-by-step instructions to a robot. Since they’re close to binary (the computer’s native language of 0s and 1s), they give you more control but require extra effort to use.
Low-Level Languages are divided into two types;
5.8:
1. Machine Language: This is the language of 0s and 1s that the computer’s hardware understands directly.
2. Assembly Language: This uses short codes or symbols (like ADD for addition) instead of 0s and 1s, making it a little easier for humans to use.
So, writing in low-level languages is like solving a complex puzzle—it’s tricky but powerful!
You can make numbers easy to read by adding symbols like ₹ and deciding how many decimal places to show, such as ₹150.50 for Aarohi’s collection data.
High-level programming languages are like special sets of words and rules that we can use to tell a computer what to do. It is like talking to the computer in a way that’s easier for humans.
Think of high-level languages as a way for you to talk to the computer using words and sentences that are easier for you to learn and understand but it is difficult for computers to understand.
For example, in Python, (a high level programming language) you can write print Hello, World! to make the computer display “Hello, World!”. However, this code needs to be translated into machine language for the computer to understand it. This translation is handled automatically by special programs called compilers or interpreters.
So, high-level languages are like a bridge between what we want the computer to do and what the computer can understand.
Examples of high-level languages: Python, JavaScript, C++ and more.
Differences between Low-Level and High-Level languages
Low-Level Languages
Hard for humans to read and write
Easy for computers to understand
High-Level Languages
Easy for humans to read and write
Requires Compiler or Interpreter to translate
Ex: Machine Language, assembly Language Python, JavaScript, C++ etc.
Table 5.2: Differences between Low-level and High-Level Languages
As mentioned, in high level languages, computers first need the instructions converted into a form they can understand. This is done by translators called compilers and interpreters. Let’s explore them!
A compiler is like a language teacher who translates an entire book from one language to another. Here’s how it works:
I. Reading the Book: Imagine you have a book written in one language, and you want it in another language. The compiler reads the entire book, understands it, and then writes a new version in the other language.
II. One-Time Job: The compiler does this translation job once, and it creates a new book in the other language that you can keep and read again and again. So, it’s like making a permanent copy of the book.
III. Faster Reading: When you want to read the book in the new language, you read the translated version, which is much faster to understand because it’s already in the language you know.

5.9: Compiler
A compiler translates a whole program into a language the computer understands all at once, and you can run the program later as many times as you want.

You have written a computer program in a high-level programming language, but the computer can’t understand it. What do you need?
An interpreter is like a language teacher who translates a book for you, sentence by sentence, as you read it. Here is how it works:
I. Reading Sentence by Sentence: With an interpreter, you read a sentence from the book in one language, and the interpreter tells you what it means in another language.
II. On-the-Fly: This happens while you’re reading. So, you don’t get a whole new book; you get the translation as you go along.
III.Slower Reading: Since you have to wait for the interpreter to translate each sentence, reading the book takes a bit longer compared to reading a book that’s already in your language.
An interpreter translates and runs a program line by line, which is a bit slower but more flexible because you can make changes and see the results immediately. Now that we’ve explored low- and high-level programming languages, let’s step into a programming environment to bring your programming skills to life with an exciting project.
Imagine you are creating a game where you give instructions to a character to move around. To do this, instead of writing complicated codes, you can simply use colourful blocks to guide it. Sounds exciting, doesn’t it? Well, it’s not just a dream-it’s real! That’s exactly how Blockly works-a programming
environment that makes coding simple and fun to learn! Blockly is a visual programming tool. It’s designed to help beginners, understand coding concepts without having to type. Instead of writing lines of code, you create programs by dragging and dropping colourful blocks together, like solving a puzzle!
How Blockly Works?
1. Blocks Represent Code: Each block has a specific command or function, like “move forward” or “turn left”.
2. Drag and Drop: You drag the blocks and connect them to create a flow of instructions.
3. Creates Real Code: Blockly converts your blocks into actual programming languages like Python or JavaScript, so the computer can follow your instructions. You’ve been doing great learning programming concepts like sequences, loops, and logic building through Blockly! It’s more than just fun—it’s the foundation of realworld coding. Blockly is a fantastic, visual way to start your coding adventure. Ready to try it out? Let’s start creating with Blockly!

1. Workspace Area- This is where we drag and drop code blocks to develop our code.
2. Output screen- This is where we view the results of running the code.
3. Maximize button- When pressed, the workplace area extends and maximises.
4. Blockly code blocks- This part will include all of the code blocks required for your task.
5. Delete icon - If you need to erase any code, drag and drop the code block into this bin.
6. Run button - When your code is finished, you must run and execute it to get the output. This button helps in the execution of code blocks typed in the workspace
area.
7. Menu list - This panel has icons for storing, deleting, and opening your workspace, as well as tips and help buttons
8. Preview panel - To view the output, click on it and the output screen will display.
Let us assist the panda to reach his destination using blockly codes.
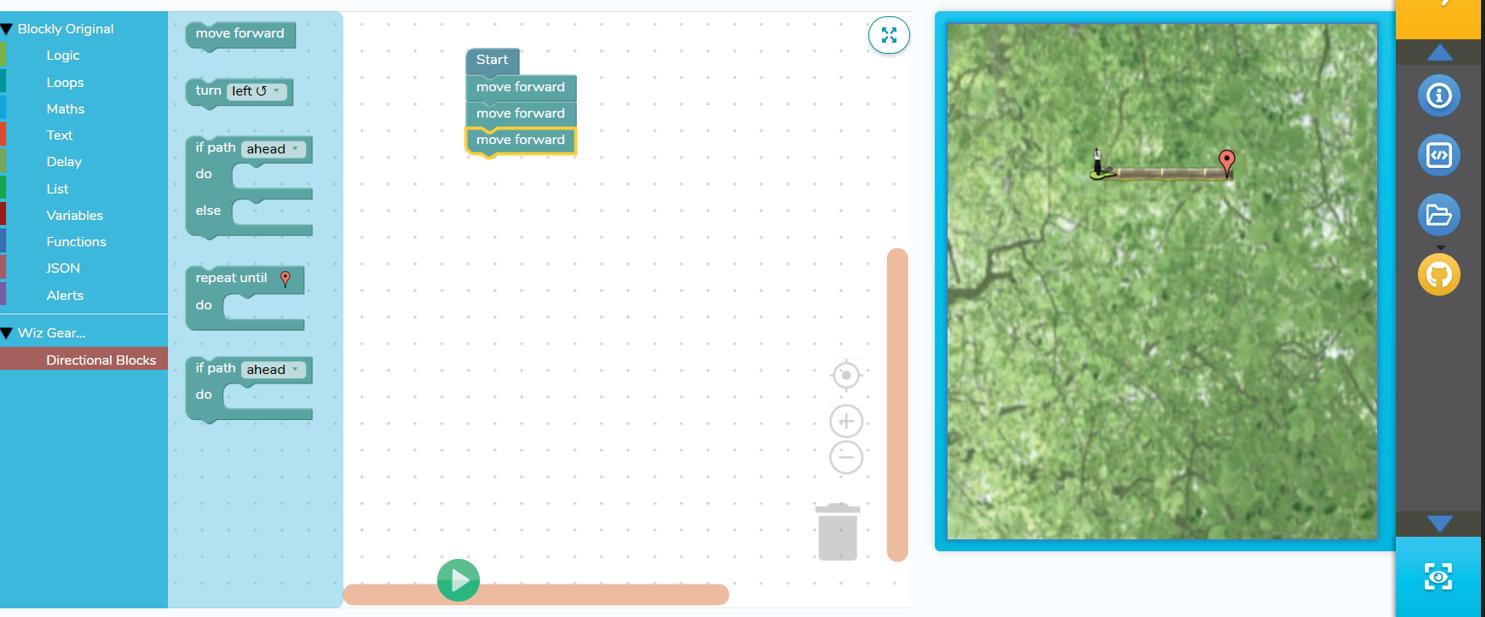
Steps 1: Drag the Move Forward block from the Directional Blocks
Step 2: Drop the Move Forward block below the Start block
Step 3: Repeat the same actions twice
Step 4: Click on the Run Button to run the program
In your practical sessions, you’ll get to create similar projects and help the panda find its way!

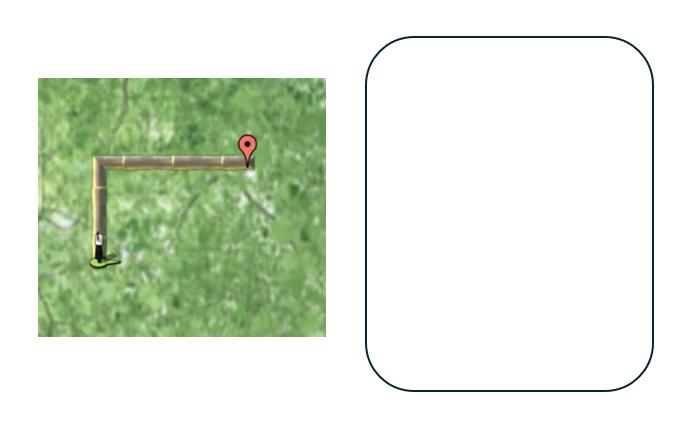
In your next lab session, assist the Panda to reach his destination using code blocks. Fill in the space given below using the same set of code blocks as required.
You’ve learned about binary numbers, which are the basic language of computers, and how programming languages help us communicate with them, you’ve also tried out Blockly, a fun visual programming tool.
Remember, programming is a powerful tool to bring your ideas to life and solve realworld challenges. In your next classes, get ready to explore more about programming languages!

Programming Language - A language used to communicate instructions to a computer and create computer programs.
High-Level Language - A programming language closer to human languages and easier for humans to understand.
Low-Level Language - A programming language closer to the computer’s binary language and more challenging for humans to understand.
Program - A well-defined set of instructions that tells a computer how to perform a specific task.
Compiler - A translator that converts an entire high-level code into machine code before execution.
Interpreter - A translator that converts high-level code into machine code line by line during execution.

Recap
• Binary is a type of number system consists of only 0 and 1.
• Programming languages provide instructions for computers to perform tasks.
• Programs are sets of instructions that tell computers what to do.
• There are high-level and low-level programming languages with different levels of complexity and human readability.
• Compilers and interpreters translate high-level code into machine code for execution.
• Blockly is a visual programming tool allow users to code by dragging and dropping blocks.

I. Fill in the blanks
1. To instruct a computer to perform a task, a computer programmer has to write a ____________.
2. High-level programming languages are like special sets of words and rules that make it easier to communicate with the ____________.
3. Low-level languages are designed to operate and handle the entire ____________.
4. A ____________ translates an entire program from one language to another all at once.
5. A computer program is a well-defined set of ____________ to achieve a particular task.
II. True or False
1. A program is like a set of instructions given to a computer.
2. High-level programming languages are challenging to use because they are close to how computers think.
3. A compiler creates a permanent translated copy of a program
4. An interpreter translates an entire program at once.
5. Assembly language is an example of a low-level programming language.
III.Short answer questions
1. What is a program in the context of computers?
2. Why do we need programming languages to communicate with computers?
3. How does a compiler differ from an interpreter in translating a program?
4. Name a high-level programming language.
5. What type of programming language is closer to how computers think?

Find examples of high-level languages (like instructions or scripts) and low-level languages (like machine-like operations) in your surroundings.

Find examples of high-level languages (like instructions or scripts) and low-level languages (like machine-like operations) in your surroundings.
• Design characters that symbolize high-level programming concepts (e.g., commands, functions) and low-level concepts (e.g., basic operations, conditions).
• Include in your story settings that act like compilers and interpreters, guiding the characters to perform actions based on the story’s plot.
• Illustrate how the story progresses with the characters executing their tasks, mirroring how programs run through high-level and low-level operations.


By the end of this chapter, you will be able to,
• Define an algorithm and a flowchart
• Explain the importance of algorithms and flowcharts in problem-solving
• Draw flowcharts representing algorithms
Every day, you follow a sequence of steps from the moment you wake up until bedtime. For example, you wake up, brush your teeth, eat breakfast, go to school, and play in the evening. These steps happen in a specific order to make your day smooth and organised.
Similarly, when solving problems or completing tasks, we need to follow a clear sequence of steps. These step-by-step instructions are called algorithms. They help us plan and carry out tasks easily and efficiently. To make these steps easier to understand, we can draw flowcharts, which use pictures and arrows to show the steps visually. Flowcharts help us see the process at a glance, just like a roadmap helps us find the right way.
In this chapter, you’ll learn how to write algorithms and draw flowcharts to solve problems
in an easy and fun way! Let us get started!
An algorithm is a set of clear, step-by-step instructions used to complete a task or solve a problem. Remember making a sandwich? It followed a specific sequence of steps. Let’s revisit it:
This is an algorithm because it gives you clear instructions, so you know exactly what to do. In the same way, algorithms tell computers what to do in order to complete a task. Whether it’s adding numbers, sorting a list, or playing a game, algorithms give computers instructions to follow, step by step, to get the right result.
An algorithm is a step-by-step set of instructions to solve a problem or complete a task.
Everyday examples of algorithms include Google Search, where algorithms determine the most relevant websites for your queries; social media platforms, which use algorithms to suggest posts and content based on your interests; and YouTube, where algorithms recommend videos, you might enjoy based on your viewing history.

Can you think of moments in your daily life where algorithms work behind the scenes without you noticing? Here are some hints—identify the event and fill in the blanks below!

The word “Algorithm” comes from a scholar named Al-Khwarizmi, who lived over 1,000 years ago. He created a method for solving math problems, and that’s where the term “Algorithm” came from!
To write an algorithm, follow these steps:
1. Define the Problem: What do you want to solve?
2. Analyse the problem: Break down the problem into smaller parts.
3. Write Steps: Create clear and logical steps.
4. Test: Try it out to see if it works.
Let us study an example to write an algorithm to find the Sum of Two Numbers. Step-by-Step Algorithm
1. Define the Problem: Find the sum of two numbers provided by the user.
2. Analyse the Problem:
a. You need to take two numbers as input.
b. Add the numbers together.
c. Return the sum.
3. Write Steps:
a. Step 1: Input the first number.
b. Step 2: Input the second number.
c. Step 3: Add both numbers.
d. Step 4: Output the sum.
4. Test:
a. Example numbers: 5 and 3.
b. The algorithm will add 5 + 3 and return 8 as the sum.
Algorithm to find the sum of two numbers:
Step 1: Input first number (num1).
Step 2: Input second number (num2).
Step 3: Calculate sum = num1 + num2.
Step 4: Output the sum.

Think and Answer
Write an algorithm to find the smaller number between two given numbers, A and B.
Algorithms are powerful tools for solving problems but understanding them through just text can sometimes be challenging. That’s where flowcharts shine! Flowcharts provide a visual representation of an algorithm, making it easier to understand complex processes. By using shapes and arrows, they clearly show the sequence of steps, decisions, and actions, helping us quickly grasp the flow of logic.
A flowchart is a graphical representation of an algorithm or process. Flowcharts visually represent algorithms, showing the flow of control in a program. They help programmers understand an algorithm’s logic. Let’s learn the symbols used to draw them!
6.2.1
Creating a flowchart is like drawing your idea on paper. Here are the basic symbols used for creating a flowchart:
Symbol Name
Oval
Parallelogram
Rectangle
Diamond
Arrows
Symbol
Function
Used to represent start and end of flowchart
Used for input and output operation
Processing: Used for arithmetic operations and data-manipulations
Decision making: Used to represent the operation in which there are two/three alternatives, true and false etc
Flow line: Used to indicate the flow of logic by connecting symbols
Table 6.1: Symbols used in flowcharts
6.2.2 Rules for drawing flowcharts:
1. Start with an Oval: Begin with a “Start” symbol.
2. Use Correct Symbols:
• Oval: Start/End
• Rectangle: Action
• Diamond: Decision
• Arrow: Flow direction
3. Keep the Flow Clear: Connect steps logically with arrows.
4. One Start, One End: Always have one starting and ending point.
5. Decisions Need Two Paths: Use arrows for “Yes” and “No” from decision diamonds.
6. Add Labels: Write short descriptions inside symbols.
7. Keep it Neat: Use straight lines and proper spacing.
8. Check Your Flow: Ensure the steps make sense.
Example 1: Flowchart for Making Tea

Design a flowchart that explains how to make lemonade step by step. Use simple flowchart symbols to represent each part of the process.
1. Start.
2. Gather lemon, sugar, water, and a glass.
3. Cut the lemon in half.
4. Squeeze lemon juice into the glass.
5. Add water and sugar to the glass.
6. Stir the mixture.
7. Taste the lemonade:
• If sweet enough, go to the next step.
• If not, add more sugar.
8. End.
Flowchart:

Encourage students to create their own flowcharts and algorithms for simple tasks to practice logical thinking and problem-solving skills.
Now that you know how to write algorithms and draw flowcharts, let’s put these skills to use!
Algorithms and flowcharts help solve problems step-by-step and make the process clear and organised.
Aspect
Understanding the Problem
Organising Thoughts
Communication
Identifying Problems Early
Algorithms
Breaks a problem into smaller steps to make it easier to solve.
Helps you think clearly and plan out the steps.
Helps explain your idea to others in a simple way.
Let you see if something might go wrong before trying it out.
Flowcharts
Shows a simple picture of how the steps work together.
Makes it easy to see the order of steps with shapes and arrows.
Helps others understand your idea with pictures and symbols.
Helps you spot mistakes in the plan before starting.
Efficiency Helps you find the quickest way to solve the problem. Helps you see the whole process and make it faster.
Reusability and Adaptability
Can be used again for similar problems.
Can be changed easily for different problems.
Table 6.2: Algorithms and Flowcharts in Problem-Solving
Task: Write an algorithm and draw a flowchart to check whether a given number is even or odd.
Here’s how you can approach this problem:
1. Algorithm to check if a number is even or odd:
Step 1: Start
Step 2: Read number
Step 3: Check if number is divisible by 2
• If yes, Print “Even”
• If no, Print “Odd”
Step 4: Stop
Figure 6.4: Flowchart to check the number is even or odd.
Algorithms are a crucial part of computer programming, and they are used to solve various problems efficiently and accurately. By following the steps mentioned above, you can design, analyse, and solve problems using algorithms.
Flowcharts can also be used to represent algorithms graphically, making them easier to understand and communicate. So, keep practising and exploring new algorithms to enhance your problem-solving skills.

Algorithm- An algorithm is a set of step-by-step instructions or rules to solve a problem or complete a task.
Flowchart- A flowchart is a graphical representation of an algorithm or process.

• An algorithm is a sequence of steps or instructions designed to solve a specific problem. It is a precise and systematic approach to solving a problem or performing a task.
• Flowcharts are a graphical representation of an algorithm or process, which can help programmers to understand the logic of the algorithm.

I. Fill in the blanks
1. An algorithm is a ________ set of instructions to solve a problem.
2. A flowchart is a ________ representation of an algorithm.
3. The symbol used to represent the start and end of a flowchart is called a ________.
4. In a flowchart, a ________ symbol is used to show actions or tasks.
5. A ________ symbol in a flowchart is used to represent a decision-making point.
II. Re-arrange the jumbled letters to form the correct terms:
1. HOMTRIGAL
(Hint: Set of steps to solve a problem)
2. FLOHARCTW
(Hint: Visual representation of an algorithm)
3. TRAST
(Hint: A symbol representing the beginning of a process)
III. Match the correct answer
shape is used to indicate the process.
shape is used to indicate the decision taken,
shape is used to indicate the start and end.
shape is used to indicate the input and the output.

Identify and describe an algorithm from your everyday life situation (such as making a sandwich or brushing teeth etc.).
Algorithm:
Step 1: Start
Step 2:
Step 3:
Step 4:
Step 5 :
Step 6 :
Step 7:
Flowchart:

Task Description:
Write an algorithm and draw a flowchart to find the difference between two numbers.
Steps:
1. Open Microsoft Word.
2. Write an algorithm using clear and simple steps to calculate the difference between two numbers.
3. Use shapes (such as ovals, rectangles, and arrows) to draw a flowchart that visually represents the steps in your algorithm.
4. Ensure your flowchart includes:
a. Start symbol to begin.
b. Input steps to take the two numbers.
c. A process step to subtract the second number from the first.
d. An Output step to display the result.
e. End symbol to finish.
5. Save your work or keep it ready for submission.


By the end of this chapter, you will be able to,
• Use conditional statements to make decisions
• Perform calculations using arithmetic operators
• Write blockly programs that make decisions and solve math problems
In the last chapter, we learned how algorithms and flowcharts help us solve problems step by step. Remember the diamond shapes in flowcharts? Those are decision points where we ask questions like “Is it raining?” and choose a path based on the answer (Yes or No). This chapter takes that idea further by teaching how computers make decisions using conditionals and how they perform calculations with operators. These tools will help you create smarter and more interactive programs using blockly programming. Blockly is a visual programming language that uses blocks to represent code concepts, making it easier for beginners to learn programming logic and structures.
Let us get started!
Before we learn how computers make decisions, let’s see how good you are at making them!
Imagine these situations:
1. If it’s raining, what will you wear?

2. The weather is very cold and you are hungry, what will you eat?
Mark (✔) your answers.
In each situation, you made a decision based on the conditions. Computers do the same thing using conditionals. Let’s see how!
7.1
In our daily lives, we constantly make decisions based on certain conditions. For example, “What should I wear today?”, “What should I eat?”. These decisions are based on certain conditions that help us decide what to do next.
Now, imagine a computer needs to make similar decisions, like whether to display a message or choose a certain path in a game. This is where conditional statements come in. In programming, conditional statements are instructions that tell the computer to make decisions based on specific conditions, just like we do in real life. A conditional statement asks, “Is this condition true or false?” and based on the answer, the computer performs a certain action, like:
1. If a condition is true, do this.
2. If not, do something else.
For example, in activity 1 while you’re deciding what to wear you took decision based on the weather.

Now that you understand how decisions work, let’s explore the different types of conditional statements.
There are three main types of conditional statements, each allowing the computer to make decisions in different ways:
Conditional Statements If Statement If-else Statement Nested Conditional Statement
7.2: Types of Conditional Statements
I. If Statement
If statement executes a block of code only if the condition is true. If the condition is false, the program will do nothing.
Example: If it is raining, then wear raincoat otherwise do nothing.

II. If-else Statement
Figure 7.3: If Condition
If-else statement executes one block of code if the condition is true and another if it’s false.
Example: If it’s raining, wear raincoat; otherwise, wear sunglasses.
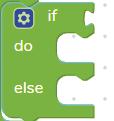
7.4: If-else Condition

World Programming Day is celebrated on October 15th every year. It honours the incredible work of programmers around the world and encourages people to learn about coding.
Sometimes, decisions are more complicated, and one decision depends on another. Nested conditionals are used when one conditional statement is placed inside another. Nested conditionals help computers handle multiple layers of decisions.
Example: Is it sunny? Yes-is it hot? if yes then wear t-shirt if not wear light jacket. If it’s not sunny then rainy? If rainy wear raincoat, if not rainy wear sweater.

Create a flowchart for the example above to decide what to wear based on the weather conditions.

Discuss where conditional statements are used in real life, such as traffic lights or games.
Great job learning about conditional statements! But let’s pause for a moment and think: how do we decide things like “Is it sunny?” or “ What to eat?”
To make these decisions, we need tools that help us compare, calculate, and evaluate. These tools are called operators!
Operators are special symbols or keywords that tell the computer to perform specific actions like calculations or comparisons. There are different types of operators used in programming. We will learn few of them.
Arithmetic operators are used to perform basic mathematical operations like addition, subtraction, multiplication, and division. Following table shows different arithmetic operators and their blockly blocks to perform basic mathematical operations.




Relational operators are used to compare two values and determine if they are equal, greater, or less than each other. These comparisons are helpful when you want the computer to make decisions based on whether certain conditions are true or false. Following table shows different relational operators and their blockly blocks to perform comparison.


Logical operators are used to combine multiple conditions to create more complex decisions. For example, you can use “and” to check if two conditions are both true, or “or” to check if at least one condition is true. There’s also the “not” operator, which reverses a condition. For example, “not (5 > 3)” would be false because the condition “5 > 3” is true, and “not” reverses it. Logical operators allow you to create more detailed and specific rules for your programs.
Operator Blockly
Meaning Example Result and Both conditions are true (5>3) and (10>5) True or At least one is true (5>3) or (10>5) True not Reverses the condition not (5 > 3) False


Table 7.3: Logical Operators
It’s time to practice what you have learned so far by performing some calculations.

Use conditional statements and arithmetic operators to perform different operations based on the comparison of two variables.
Instructions:
1. Create two variables x and y.
2. Assign random values to them (e.g., x = 10 and y = 20).
3. Use if, else-if, and else statements to compare the values of x and y and perform the following operations:
• If x < y: Calculate and print the sum of x and y (x + y).
• If x > y: Calculate and print the difference (x - y).
• If x == y: Calculate and print the product (x * y).
Blockly Code:
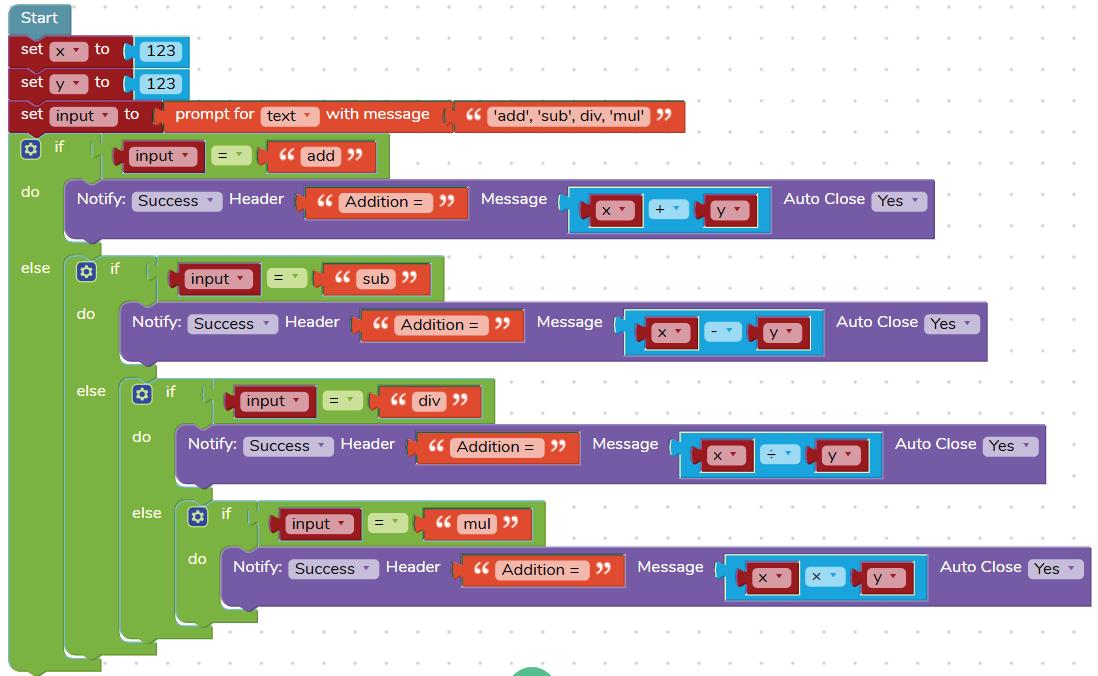

Here, we used variables ‘x’ and ‘y’ to store two different numbers. Do you know what is a Variable?
Variable is like a box where you can store any information which can be used later. You can change the value of the variable as per the requirement.
In lab activity program, we use nested conditional statements to make decisions based on the values of two variables, x and y. Nested conditional statements help the program choose different arithmetic operations depending on whether certain conditions are true or false. For example, if x is less than y, the program adds x and y. If x is greater than y, it subtracts y from x. If both values are equal, the program multiplies them. We also use relational operators such as <, >, and == to compare the values of x and y, and arithmetic operators like +, -, and * to perform calculations. Nested conditionals allow us to check more specific conditions inside another condition, creating more complex decisionmaking. By combining these concepts, the program can make decisions and perform different actions based on the values provided, demonstrating how control structure logic and operators work together.
Congratulations! You’ve now learned how computers make decisions and solve problems using conditionals and operators. Just like how we make choices based on conditions, computers use “if” statements to decide what to do. You also explored how operators help the computer do math and compare values. With these new skills, you can start building your own programs that can make decisions and solve problems. Keep practicing, and you’ll continue to unlock more exciting possibilities with coding.

• Conditional Statements- Used to make decisions based on conditions.
• Nested Condition Statement- One if-else block inside another to handle multiple decisions.
• Arithmetic Operators: Symbols for mathematical operations like addition, subtraction, division, and multiplication.
• Variable: Variable is like a box where you can store any information which can be used later.

• Conditional statements allow programmers to make decisions based on whether certain conditions are true or false.
• Nested condition statement helps in making multiple decisions by placing one if-else block inside another.
• Arithmetic operators such as addition, subtraction, multiplication, and division are used to perform basic mathematical operations.
• Blockly is a visual programming language that uses drag-and-drop blocks to make coding easier and more accessible.

I. Fill in the blanks
1. The symbol for subtracting one number from another is ______.
2. To check if two values are equal, we use the ______ operator.
3. The result of dividing 10 by 2 is ______.
4. In Blockly, you can use the ______ block to repeat a set of actions until a condition is met.
5. A ______ is like a container that stores a value, such as a number or text, in a program.
II. Match the Following Column A Column B
1. If Statement
2. Arithmetic Operators
3. Nested Conditionals
a) Used to perform mathematical operations
b) Placing one if-else block inside another
c) Used to check if a condition is true
III. Write the use of the following blocks


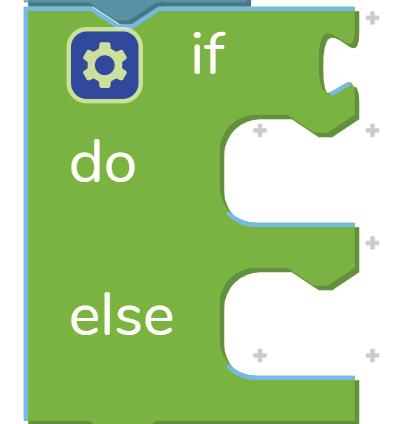

Create a flowchart to decide what to do on the weekend based on weather and mood.
Instructions:
Imagine it’s the weekend and you have to decide what to do based on the weather and your preferences.
1. Check if it is sunny or rainy:
• If sunny, decide whether to go outside or stay inside.
• If rainy, decide whether to watch a movie or read a book.
2. If it’s sunny, then:
• If you want to go outside, you can play outside.
• If you want to stay inside, you can relax or do something else.
3. If it’s rainy, then:
• If you want to watch a movie, decide between action or sci-fi.
• If you want to read a book, decide between fictional or comic.

Create a calculator in Blockly that performs addition, subtraction, multiplication, and division based on user input.
Instructions:
1. Take two variables, x and y.
2. Use the ‘Prompt for text with message’ block to get user input for the operation (“add”, “mul”, “div”, or “sub”).
3. Use nested conditionals to check the input and perform the corresponding operation:
• If the input is “add”, calculate x + y
• If the input is “sub”, calculate x - y
• If the input is “div”, calculate x ÷ y
• If the input is “mul”, calculate x × y


By the end of this chapter, you will be able to,
• Define Machine Learning
• Categorise machine learning
• Describe the working of image classification
• Build your first machine-learning model
If someone tells you that machines can identify a dog, or a cat, or even read text from an image, would you believe them? Well, you should, because we live in a world where not only humans, but machines are also learning from experiences and the data they observe around them. Isn’t that amazing?
Let us explore these wonders of machines and dive into a fascinating topic called Machine Learning. This chapter will help you understand the basic details of what Machine Learning means.
Machine Learning is the science of teaching computers to learn from data and make decisions or predictions without being explicitly programmed. It involves giving computers the ability to learn and make decisions without being told exactly what to do. Imagine you have a friend who loves solving puzzles. You show them how to solve one puzzle, and they learn the method. Later, they can solve similar puzzles on their own.
That’s how Machine Learning works - by learning from examples. Instead of programming every step, we provide the computer with lots of examples and let it learn the rules from those examples.
Machine Learning is an application of Artificial Intelligence wherein the system gets the ability to automatically learn and improve based on experience. Real-world examples of machine learning and AI, you probably use:
• Siri /Cortana /Alexa (voice recognition assistant)
• Facebook (Tags prompt, face recognition, etc.)
• Google Search (Search recommendations)
• Google Maps (Traffic speed analysis)
Machine learning works with the help of a model. A model is the algorithm used to observe patterns in the data to predict the outcome. The properly we train the model, with greater accuracy it can predict the object given. Let’s understand the process with an example: training a machine to recognise fruits.
Data is the starting point for machine learning. It’s like clues the computer uses to learn. Data can be numbers, words, pictures, sounds, or lists. A list is an ordered collection of items. It is like a container where you can store multiple pieces of information together. Example: We collect data about fruits and their features, including shape, color, size, and texture.
fruits = [“apple”, “banana”, “orange”] features = { “apple”: [“round”, “red”, “medium”, “smooth”], “banana”: [“long”, “yellow”, “medium”, “smooth”], “orange”: [“round”, “orange”, “small”, “bumpy”] }
These features will help the model differentiate one fruit from another.
In this step, the raw data is cleaned, organized, and transformed so the computer can understand it. Think of it as preparing a recipe before cooking—the data must be in the right format for the model to learn effectively.
Example: We clean and organize the data to ensure accuracy. If any fruit has missing information, we fill in the blanks: Missing data for orange: “size”: “”
Corrected data: “size”: “small”
A model is like a smart friend who studies the data to find patterns. During this phase, the model uses examples (called training data) to learn relationships between inputs and expected outputs.
Example: During training, the model learns to identify fruits based on features like shape, colour, size, and texture:
• For an apple:
• Shape: Round
• Colour: Red
• Size: Medium
• Texture: Smooth
• For a banana:
• Shape: Long
• Colour: Yellow
• Size: Medium
• Texture: Smooth
• For an orange:
• Shape: Round
• Colour: Orange
• Size: Small
• Texture: Bumpy
The model observes these patterns to predict the fruit when new data is introduced.
After training, the model is evaluated using new examples, known as testing data. This step checks how well the model has learned. Usually, 80% of the data is used for training, and 20% is reserved for testing.
Example: We test the model with new data to see if it can predict correctly:
• Input: “round, orange, small, bumpy”
• Expected Output: “orange”
Once the model is trained and tested, it can make predictions. For example, if you show it a new fruit, it might say, “This is an apple!”
If the model isn’t accurate enough, adjustments are made to improve its performance. Example: After successful training and testing, the model can predict fruits based on features:
Machine Learning is categorized into different types based on how the machine learns from data. These categories exist because not all problems are the same, and different approaches are needed to solve them effectively. There are three different types: Supervised, Unsupervised, and Reinforcement.
Supervised learning is a type of machine learning where we train a machine using labeled data. This means that the data provided to the machine already includes the correct answers or classifications.
For instance, imagine you have a basket of fruits and need to sort them into groups. Since the machine has already been trained with information about different fruits and their characteristics, it can easily categorize them. It might organize the fruits based on features like size, color, or shape.
In simple terms, supervised learning involves learning from labeled training data and then applying that knowledge to new, unseen data to make predictions or classifications.
8.3:
In contrast, unsupervised learning does not involve a trainer or “supervisor.”The machine learns independently based on its ability to identify patterns and relationships.
For example, imagine providing an image that contains a group of animals. Since the machine hasn’t been trained with details about the features or characteristics of these animals, it doesn’t know what they are. However, it can still categorize the animals by observing their similarities, patterns, and differences.
This approach is called unsupervised learning. A key concept within unsupervised learning is clustering, which involves grouping data based on shared features or characteristics.

Figure 8.4: Unlabelled training data in unsupervised learning
Reinforcement learning can be compared to a trial-and-error method of learning. The machine receives a reward or penalty for each action it takes. If the action is correct, it earns a reward, but if it’s incorrect, it incurs a penalty.
For example, it’s like training a dog. If your dog fetches the ball for you, you praise it or give it a treat as a reward.
We briefly introduced the three types of machine learning: supervised, unsupervised, and
reinforcement learning. Each type plays a significant role in making predictions and solving real-world problems. However, for this grade, we will focus on supervised learning to build a strong foundational understanding.
In your future studies, you will have the opportunity to explore the other types in more detail. Supervised learning is widely used in various applications, making it an exciting and important area to learn first. Supervised Learning finds its application in Sentiment Analysis, Text Classification, Image Classification, and Emotion Recognition.
To understand image classification, let’s start with an activity!
Activity 1:
Look at the images below, observe them carefully, and try to categorise these images. How many categories of image did you find? _______ And how many images were there in each category? ________. Let’s see.


There are 3 categories of images: fruit, flower and vegetable. There are a total of 3 fruits, 3
flowers and 4 vegetables.
Did you realise what you just did in the activity?
You observed the images, and based on the features and characteristics of each image you were able to categorise each one of them. This ability to categorise the images comes quite easily and naturally to us. But what if we want the computers to do the same?
Computers can also categorise images by using a machine learning algorithm called image classification. This algorithm involves teaching the computer to recognise certain features or patterns in the images and associate them with different categories.

Figure 8.6: Objection detection through image classification
Imagine there are countless categories into which images can be classified, such as colour, size, brand, and more. Initially, you could manually examine each image and assign it to a category. This approach works well when dealing with a small number of images. However, what if you had to handle 10,000 or more? It would be an incredibly tedious and nearly impossible task. But, imagine the benefits if we could automate this entire process and swiftly label images according to their respective classes.
Here enters image classification! Image classification is a way to teach a computer how to recognise different things in pictures, just like you can recognise different things in your surroundings. For example, if you show the computer a picture of a dog, it will recognize it as a dog, just like you would. This can be useful for things like identifying objects in medical images or in self-driving cars.
When working on image classification, we use a method called Logistic Regression. You will be working on this method in your upcoming lab classess. Let us now move ahead to explore the task you would perform in the lab that involves logistic regression.
In your upcoming lab session, you will come across the ML blockly environment as shown in the figure. The code blocks required to train and test the model are available. Have a look at the lab activity and perform this in your upcoming lab sessions.

We will create a ML model which will be able to identify different birds.
We will train our model to differentiate between pigeon, parrot and peacock. So, let’s start by gathering images of these birds and train our machine learning model.
Step 1: Search ‘Google’ for images of pigeons. Select and download four images. Similarly, search and download four images of parrot and peacock each
Note: Make sure the Image file is of type png/jpg/jpeg.
Step 2: Now that our data has been collected, create a class called “Pigeon”. Upload all the images of pigeons and assign their URLs to the dataset
Similarly, create classes called “Parrot” and “Peacock” and upload the respective images as their dataset.

8.8:
Step 3: The next step will be to train the model by choosing the algorithm and assign the train/test percentage split. First select the image classification as the problem type. Assign a value for train/test percentage split, usually it’s kept as 15%. It means that 85% of the data will be used to train the model, and 15% data will be tested on. Select the algorithm as Logistic Regression. Finally, select a name for your model.
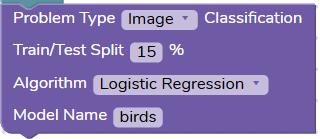
Step 4: Now it’s time to test our model for its accuracy. Switch to the “test” mode. Create a new variable and use it to store the result of your machine learning model. Enter the correct name of the model along with the URL of an image (used for testing). Finally, use the Notify block to display the result on the screen


We now have a good idea about what image classification is and how it actually works. So let’s generate results for an image through image classification and understand the concept even better. We will test an image classification model by using Google’s API. Follow the steps:
1. First, ensure that you are in the “Test” mode
2. Create a new variable to store the result of image classification from Google’s API
3. Select an image, upload it using the upload button, click on the copy button and paste the url in Google’s API call
4. Finally, display the result of image classification on the screen
Note down the displayed result in your notebook to compare it with the results from the upcoming tests.

Well, you have learned quite a lot of things on Machine Learning and also you have explored what image classification is. In the practical session, you will be doing hands-on to create a model of your own. Get ready to be amazed. Before we end, let us summarise the key points.

• Machine Learning- Machine Learning is a type of computer technology that lets a computer learn and improve on its own.
• Image Classification- Image classification is a computer technique used to recognize and label different objects or things in pictures.
• Train Data- The percentage of the data that is fed to the model used for predicting images to train it. Mostly 80% of the data is utilised for this purpose.
• Test Data- The percentage of data that is used to test the model if the model is providing the correct output according to the training data.

Recap
• Machine Learning: Teaching computers to learn from data and make predictions or decisions.
• Types of Machine Learning: Includes supervised (learning from labeled examples), unsupervised (finding patterns in unlabeled data), and reinforcement learning (learning through rewards).
• Applications: Includes voice assistants, recommendation systems, gaming, image recognition, and autonomous vehicles.
• Data and Its Role: Data, in various forms, is essential for machine learning, with train data teaching models and test data checking their accuracy.

I. Fill in the blanks:
1. ____________ is a computer program that learns from examples to make predictions or decisions.
2. In ____________ learning, the computer is given examples with correct answers to learn from.
3. ____________ learning is when the computer tries to find patterns or groups in data without being given specific instructions.
4. ____________ is the information or facts that can be collected and stored, and it comes in various forms like numbers, text, images, audio, and video.
5. ____________ is like the special ingredient that helps machines learn and do useful things for us in machine learning.
II. State “True or “False”
1. Machine Learning is a way for computers to learn from data and make predictions based on patterns found in the data.
2. In supervised learning, the computer is given examples with correct answers and learns to make predictions on its own.
3. Unsupervised learning involves the computer being given data without labels and finding patterns or groups on its own.
4. Data is like the fuel that powers machine learning algorithms, and having more and better quality data results in more accurate models.
5. Reinforcement learning is like playing a game, where the computer is rewarded for good actions and learns from its mistakes to improve.
III. Name the following:
1. What type of machine learning is where the computer is given examples with correct answers to learn from?
2. In which type of machine learning, the computer is given data without labels and tries to find patterns or groups on its own?
3. What is the type of machine learning that involves teaching a computer through rewards and guidance, similar to playing a game?
4. This type of machine learning is used to identify objects and faces in pictures, and it can recognize your face to unlock your phone. What is it called?
5. Name the type of machine learning used in voice assistants like Siri or Alexa, where the computer learns from the way we speak and gets better at helping us over time.
IV. Answer the following
1. What is machine learning, and how does it work?
2. What are the three types of machine learning?
3. Explain supervised learning with an example.
4. What are some real-life applications of machine learning?
5. Explain the concepts of “test data” and “train data” in machine learning.