
2 minute read
Lesson 1: Local maps and street maps

LESSON 1: LOCAL MAPS AND STREET MAPS
The types of maps below contain different details and are used to communicate specific information to the user. Each type of map will be discussed in detail during the lesson. The lesson will outline what each map is used for, as well as what type of information it provides to the user.
Advertisement
1.1 Types of maps
A map is a picture or representation of the earth’s surface, showing how things are related to each other by distance, direction, and size.
There are many different types of maps and each map is used for a specific purpose.
• Political maps show international, national and provincial boundaries of a place and usually include the locations of cities, depending on the detail of the map.
A political map of South Africa Source: https://goo.gl/6nH9o Border between provinces, e.g., borders between Limpopo, Gauteng, Mpumalanga, the Free State and North West. Capital cities of Gauteng are indicated: Pretoria and Johannesburg.
• A physical map shows the physical landscape features of an area such as mountains, rivers and lakes. Changes in altitude are usually shown using different colours and shades.
Rivers are indicated using thin blue lines, and mountains using brown. Different shades of brown are used to indicate the height of the mountain range.
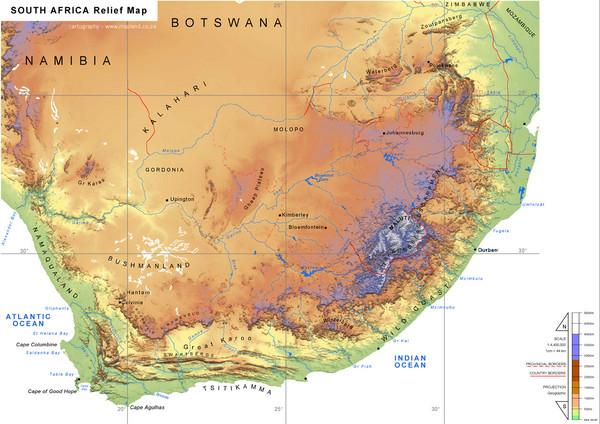
Physical map of South Africa Source: https://goo.gl/wnkMPU
• A topographic map also shows some physical features, however it uses contour lines and shows man-made attributes too. All topographic maps use symbols to show different attributes such as roads, dams and power lines.
Legend at the bottom of the topographic map indicates which symbol is used for each attribute on the map, e.g.:

Main road
Trees
Topographic map of Cape Town Source: https://goo.gl/6PtMke
• Climate maps use colour to show information about the climate in a specific region.
The climate of an area is the basic weather pattern and precipitation over a period of time.

Winter temperatures in South Africa Source: https://goo.gl/FBNj9N
• Road or street maps are the most commonly used. They show highways, roads, hospitals, parks and various places of interest. People generally use these types of maps to find their way to or from a specific place.
Street map of Pretoria city centre Source: https://goo.gl/Q9Sq49 The colours give an indication of the temperature in a specific region over a specified period of time, e.g.:
Red: indicates average temperatures of 7,5 °C and less in a specific region. Blue: indicates average temperatures of between 7,5 °C and 10 °C in a specific region. Brown: indicates average temperatures of between 10 °C and 15 °C in a specific region. White: indicates average temperatures of 15 °C and higher in a specific region.
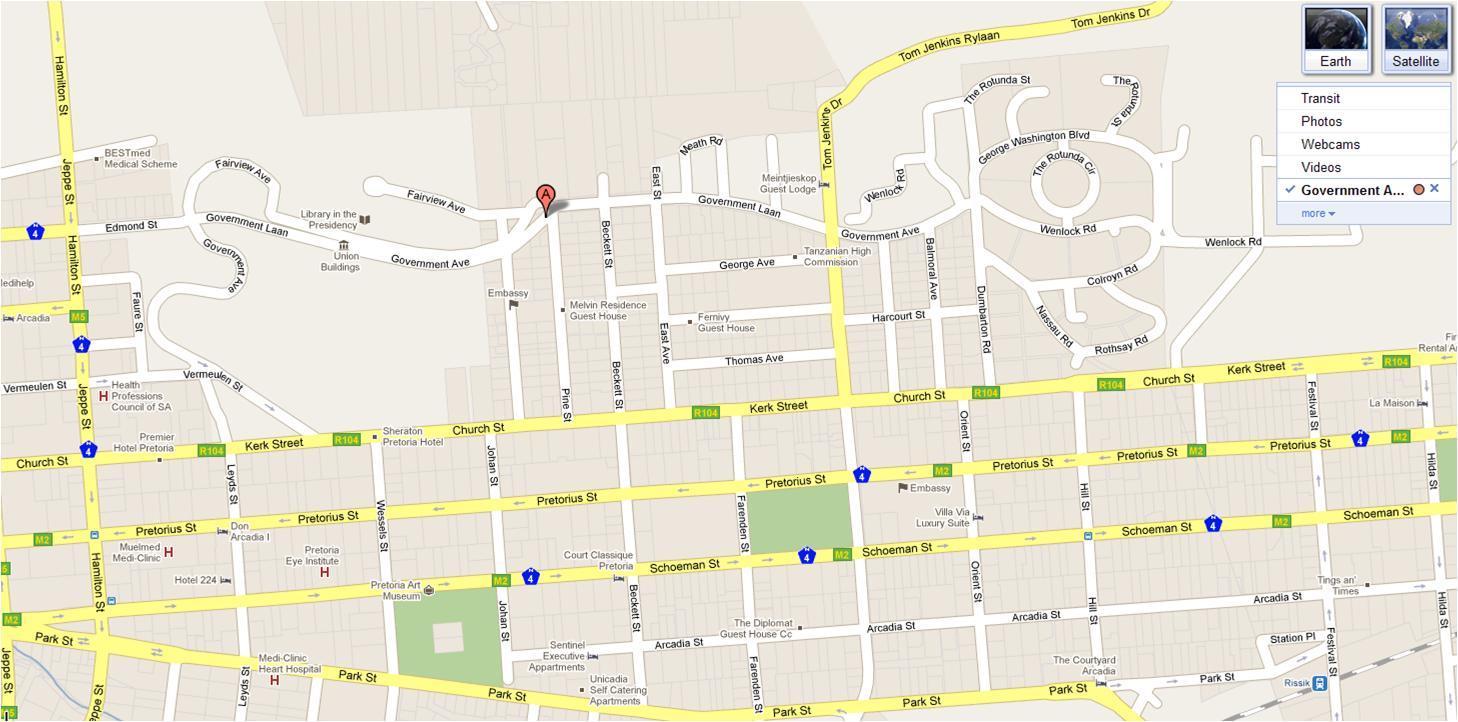
Shows highways and roads, e.g., indicates different street names.
• Economic or resource maps show a specific type of economic activity or natural resource in an area, using symbols and colours depending on what is being shown on the map.
Agricultural map of South Africa Source: https://goo.gl/3KWHJt Resources cultivated and/or produced in a specific area, which brings about economic activities, e.g., in Cape Town, Western Cape: • Oil refinery • Engineering works • Vehicles • Textiles/clothing • Chemicals and fertilisers • Food/drink/tobacco

