


and a giant leap for infrastructure
Sizabantu Piping Systems launches Africa’s first locally manufactured pipes, with capability from 710mm to 1200mm, now in full production.
In a landmark moment for local manufacturing, Sizabantu Piping Systems and Molecor have successfully produced large-diameter PVC-O pipes, with future capability of up to 1200mm.
MANAGING EDITOR Alastair Currie
Email: alastair@infraprojects.co.za
DESIGNER Beren Bauermeister
DISTRIBUTION MANAGER Nomsa Masina
DISTRIBUTION COORDINATOR Asha Pursotham
SUBSCRIPTIONS
Email: distribution@infraprojects.co.za
ADVERTISING SALES
KEY ACCOUNT MANAGER Joanne Lawrie
Tel: +27 (0)82 346 5338
Email: joanne@infraprojects.co.za
PUBLISHER
IMESA (Pty) Ltd
P O Box 2190, Westville, 3630
Tel: +27 (0)31 266 3263
Email: info@infraprojects.co.za
ISSN 0257 1978 IMIESA, Inst.MUNIC. ENG. S. AFR.
© Copyright 2025. All rights reserved.
ISBN: 978-1-0492-0651-6
IMESA CONTACTS
HEAD OFFICE:
Manager: Ingrid Botton
P.O. Box 2190, Westville, 3630
Tel: +27 (0)31 266 3263
Email: admin@imesa.org.za
Website: www.imesa.org.za
BORDER
Secretary: Celeste Vosloo
Tel: +27 (0)43 705 2433
Email: celestev@buffalocity.gov.za
EASTERN CAPE
Secretary: Susan Canestra
Tel: +27 (0)41 585 4142 ext. 7
Email: imesaec@imesa.org.za
KWAZULU-NATAL
Secretary: Narisha Sogan
Tel: +27 (0)31 266 3263
Email: imesakzn@imesa.org.za
NORTHERN PROVINCES
Secretary: Lethale Magagane
Tel: +27 (0)72 059 7444
Email: np@imesa.org.za
SOUTHERN CAPE KAROO
Secretary: Henrietta Oliver
Tel: +27 (0)79 390 7536
Email: imesasck@imesa.org.za
WESTERN CAPE
Secretary: Michelle Ackerman
Tel: +27 (0)21 444 7112
Email: imesawc@imesa.org.za
Wilma Van Der
Tel: +27 (0)83 457 4362
Email: imesafsnc@imesa.org.za


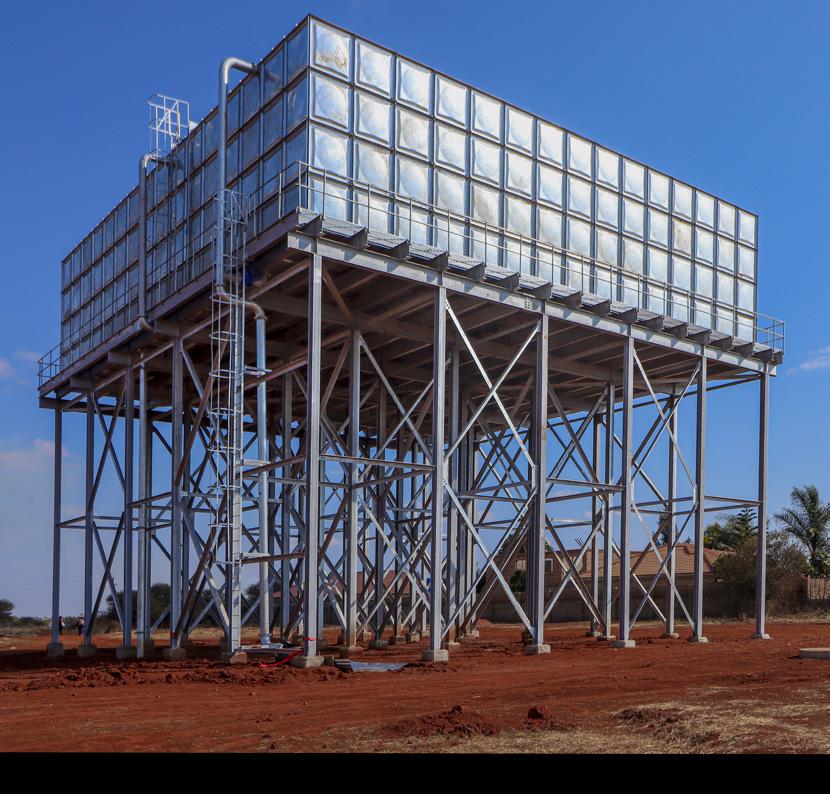
Structa Technology, based in Meyerton, Gauteng, is a proudly South African company and part of the Structa Group founded in 2002. A Level 1 B-BBEE entity, the business has built a strong reputation as a leading manufacturer of custom-built steel structures for electrification and telecommunications, water storage solutions, and infrastructure products that serve municipalities, utilities and industry nationwide.
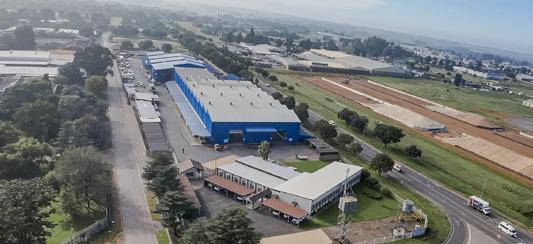
Aleader in its field, Structa Technology operates a 28 000 m2 manufacturing facility, equipped with advanced steel fabrication technology to deliver best-in-class process efficiencies and quality. The strategic focus is on turnkey execution, from design and manufacturing through to galvanising, transport and site erection on projects throughout South Africa and Africa.
This capability is backed by an in-house engineering team responsible for research and development (R&D), product design optimisation, plus erection recommendations. The latter include foundations for tanks and towers. Across the board, Structa operates under ISO 9001:2015 and meets all relevant SANS standards, ensuring durability, safety, and compliance.
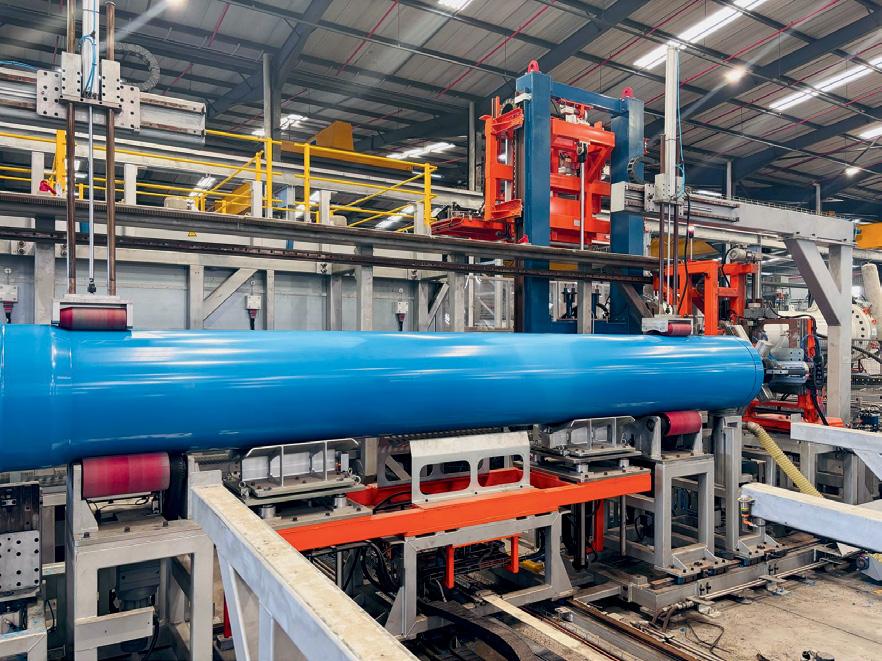
Cutting-edge fabrication techniques
Central to its focus on engineering innovation is an ongoing investment in world class fabrication technologies. In this respect, Structa Technology has recently acquired a state-of-the-art 700 tonne automated CNC tandem press with 14 m bending lengths, which will further enhance its ability to handle large-scale steel forming projects.
Within the Group, we have further strengthened our capabilities through investment in the latest cutting-edge laser technology. A prime example is the recent acquisition of a 15 m long, 20 kW tube laser cutting machine with a 3,5 m wide bed – which like the 700 tonne CNC bending press –is believed to be the first of its kind installed in South Africa.
“The new laser machine further strengthens our market offering in terms of fabricating products such as telecommunications and power transmission towers,” explains Hercules Rossouw, Managing Director of Structa Technology. “This investment has also significantly improved production throughout the Group, enabling
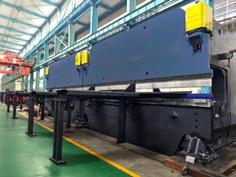
us to deliver within faster timeframes with unprecedented accuracy.”
In terms of cutting technology, Structa employs laser, plasma and angle processing for both thin and heavy plate and structural steel. This is followed by key processes that include semiautomated long seam welding, beam drilling, and assembly. For its water storage lines, Structa employs specialist 6 kW laser cutting machines for fabrication of the tank plates.
“Each product line has its own specific production set-up, backed by specific technologies,” adds Rossouw. “The employment of the latest CAD software enables a seamless transition from design to the factory floor. Here the software is directly linked to CNC drilling lines and angle workers, as well as to laser and plasma cutters, with every component marked with a specific fabrication code for quality control.”
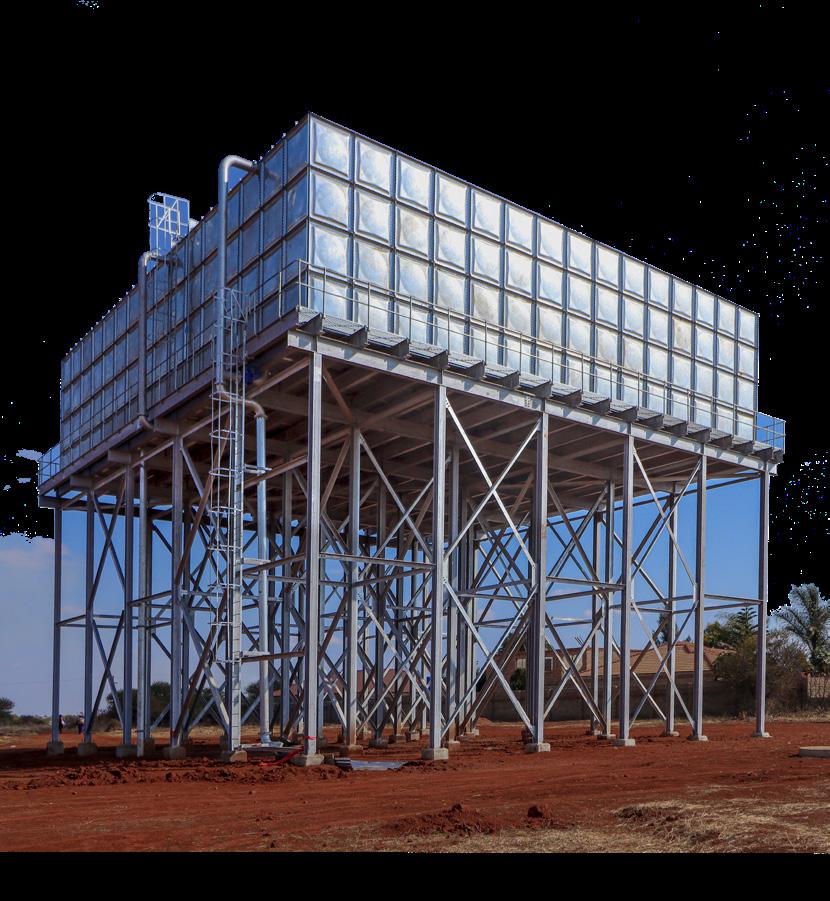
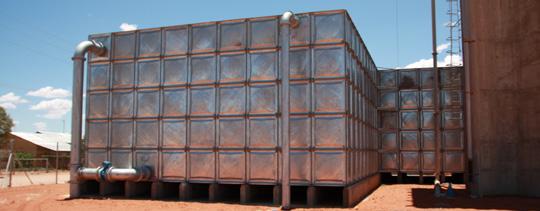
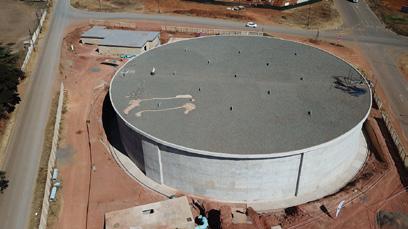
Alongside its mast range, Structa is well known for its Prestank sectional steel water tanks, proven in municipal, industrial, mining and power projects. An iconic example is the 4.2 Mℓ firefighting tank installed at Eskom’s Medupi power station. Designed, fabricated and commissioned by the Group in 2014, this tank represented a major milestone in Prestank R&D as it is the largest unit produced by Structa to date.
Prestank models range in size from around 1,5 Mℓ up to 4.2 Mℓ or higher and are designed in accordance with SANS 10329:2004 guidelines. In turn, the steel truss stands on which they are mounted are fabricated strictly in accordance with SANS 10160 for wind and SANS 10162 for Structural Steel Work.
To perfect these designs, Structa’s engineering team employ finite element structural analysis to optimise plate design and positioning of internal

bracing, and computational fluid dynamic (CFD) analysis to optimise wind resistance. Then as part of the final quality control protocol, laboratory testing confirms ultimate leak-free structural integrity.
“As a demonstration of our design innovation, we custom design our Prestanks to meet specific customer requirements. Past examples include the development of L-shaped tanks to fit around building footprints,” says Rossouw.
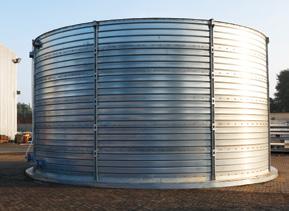
In parallel with its Prestank series, Structa also fields round modular tanks in the form of the Circotank Maxi (100 kℓ to 1 500 kℓ) and Midi (1 000 to 20 000 litres). The former meets the needs of industrial water storage and bulk rural water supply schemes, while the latter is well-suited for markets like schools, clinics, offices and small-scale rural water storage.
Erection of Maxi tanks is performed using a strake lifting system that requires no craneage. In turn, the Midi tanks are easily assembled on site in kit form with a small crew and can be mounted on a tower if required.
In every instance, electrification is the essential enabler for water network performance and
reservoir supply, alongside all other industrial and municipal energy demand requirements.
As part of its integrated solutions, Structa Technology is a leading supplier of transmission and distribution powerline pylons in Southern Africa, with Eskom being one of its largest clients.
Typical products manufactured for Eskom and municipal use include monopole pylons (11k V –220 kV); double pole pylons (132 kV – 220 kV); lattice pylons (132 kV – 400 kV); and utility poles for low voltage (11 kV) distribution.
The utility pole range has now found wide application as a long-term reliable replacement for wooden poles. These structures offer a much lighter, easily transportable option, resistant to fire and rot, as well as ease of maintenance.
In addition, Structa Technology manufactures specialised tower products for the wireless telecommunications sector – including the current 5G roll-out – and provides area high mast lighting solutions, supporting safer communities and enhanced connectivity.
“Through the supply of high masts, lattice towers and specialist structures, Structa plays a direct role in strengthening South Africa’s power network, ensuring reliable electricity delivery to millions of households and industries,” Rossouw explains.

Working across all 257 municipalities in South Africa, Structa has proven itself to be a trusted partner and a key interface for municipal engineers in devising flexible solutions. These extend across the full spectrum from mega infrastructure developments to community-level projects.
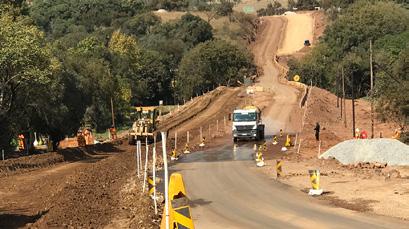
A recent example in the water segment is a 1,7 Mℓ Prestank designed and delivered in Bosplaas, North West province. Installed on a 10 m high steel truss stand, the installation was commissioned in May 2025 and provides vital potable water supply for the surrounding rural community.
Value engineered for the long-term “Upgrading our electrification networks nationally and within our towns and cities is a top priority. However, even more pressing is the need for water security. We’re dedicated to providing solutions in both areas with 100% locally manufactured products that combine cost-effectiveness with long-term durability, making them a strong fit for South Africa’s service delivery needs,” adds Rossouw.
“Leading from the front, Structa will continue to invest in our proudly South African team and the world’s best technologies to provide sustainable one-stop solutions,” Rossouw concludes.

To promote excellence in the engineering profession for the benefit of municipalities and their communities.
Since 1961, The Institute of Municipal Engineering of Southern Africa (IMESA) has been committed to the pursuit of excellence in all facets of infrastructure, pushing boundaries and driving innovation. Our unwavering dedication extends to the professionals who form the backbone of this industry.
IMESA creates a platform for the exchange of ideas and viewpoints on all aspects of municipal engineering with the aim of expanding the knowledge and best practices in all local government municipalities. This is made up of a community of pioneers, professionals, and enthusiasts united by a singular purpose: to reshape the landscape of infrastructure engineering.
Municipalities are key role-players in identifying needs, prioritising funding, and implementing integrated development planning for community-based programmes.
The Institute advises Councils on municipal engineering matters and serves the broader community through representation on a number of national bodies, where it provides input from the municipal engineer’s perspective. As a member of the International Federation of Municipal Engineering (IFME), IMESA contributes to and gains a wealth of global experience in the infrastructure engineering field. Partnering with both local and international organizations IMESA not only to raises awareness but redefines perceptions, strengthening our image and reputation among diverse audiences. Strategic partnerships with government bodies, academic institutions, research entities are pivotal in the quest to benefit the institute, its members, and the entire engineering profession. Together, we can navigate a course towards a brighter, more innovative future for infrastructure engineering.
Members of IMESA are granted free subscription to the IMIESA journal, a highly informative monthly publication that serves as a mouthpiece for the engineering fraternity by disseminating cutting-edge technical news and developments. The journal has received the prestigious PICA Award for the best publication of its kind in the Urban Management, Civil Construction and Infrastructural Development categories.
Branches organise regular full- and half-day seminars/training sessions, which often include site visits and technical product updates and are accredited with ECSA for CPD points. These events provide opportunities for members to network and share knowledge on all aspects of municipal engineering throughout the year.
IMESA conferences are hosted by a different branch each year for everyone involved in infrastructure engineering to gain valuable information and insight into issues that relate to municipalities as well as local and national government agencies. The papers presented are always relevant and topical, and exhibitors are on-site to showcase their products and services. The conference is ECSA CPD accredited.
Bursaries are awarded each year to selected students who are studying for a qualification in a field that falls under infrastructure engineering at any ECSA accredited tertiary educational institution in South Africa and have successfully completed 1st year studies. The aim of the scheme is to recognise achievements of students who would not otherwise be able to continue studying or who are dependents of IMESA members.
IMESA collaborates with experts in the field and industry partners like the Water Research Council to develop guidelines and training for all aspects of infrastructure asset management to address capacity building priorities in the engineering and municipal environments. The information is disseminated via workshops and presentations that are rolled out nationally.
Visit: www.imesa.org.za for information about IMESA, its management structure, its branches and all its activities in support of members and potential members.
The IMESA coat of arms was designed by Alan Woodrow and was registered with the South African Bureau of Heraldry in 1972.

PRESIDENT VICE PRESIDENT TECHNICAL
TECHNICAL DIRECTORS
– Director: Infrastructure
– Director: Environment
– Director: Training & Skills Development
– Director: Asset & Business Management DEPUTY PRESIDENT
- Candidate Engineer
- Candidate Engineering Technologist
- Candidate Engineering Technician
- Candidate Certified Engineer
• Are admitted as such by the Executive Committee
• Have been admitted by Council on the unanimous recommendation of the Executive Committee based on their opinion that such persons have the experience, employment responsibility or involvement in infrastructure engineering or have made a contribution to public sector engineering that, in the interests of the Institute, justifies such admission.
They shall be persons who are:
– Director: Constitution, By-Laws & Ethics – Director: Head O ce Support – Director: Finance
Director: Conferences
– Director: Marketing & Communications
Director: IMESA PTY
Director: Young Professionals Portfolio
ADMINISTRATION MEMBER OPERATIONS DIRECTORS
PROFESSIONAL MEMBERS
They shall be persons who:
• Are registered by ECSA or an equivalent engineering council recognised by ECSA as full professionals in at least one of the following categories:
- Professional Engineer
- Professional Engineering Technologist
- Professional Engineering Technician
- Professional Certified Engineer
- Registered Engineering Technician
• Have at least three years infrastructure engineering experience after achieving a qualification recognised by ECSA or an equivalent engineering council recognised by ECSA for registration
• Have been admitted as such by the Executive Committee
• Having failed to comply with the requirements of the clauses above, have been admitted by Council, on the unanimous recommendation of the Executive Committee based on their opinion that such persons have the experience, employment responsibility or involvement in infrastructure engineering or made such a contribution to infrastructure engineering that, in the interests of the Institute, justifies such admission.
GRADUATE MEMBERS
They shall be persons who:
• Are registered/eligible for registration by ECSA or an equivalent engineering council recognised by ECSA in at least one of the following categories:
• Enrolled students at a local or international university/technical university recognised by ECSA
• Studying towards a degree/diploma in engineering
• Admitted as such by the Executive Committee.
They shall be persons who:
• Have satisfied the Executive Committee that they are involved in an aspect of infrastructure engineering
• Are admitted as such by the Executive Committee.
They shall be those academic, research, consulting, commercial, industrial or other undertakings who:
• Are in the opinion of the Executive Committee, involved in business related to infrastructure engineering
• Are admitted as such by the Executive Committee.
Affiliates shall be those consulting, commercial or industrial undertakings that have been admitted as such by the Executive Committee.
Any consulting, commercial or industrial undertaking may be admitted as an Affiliate, provided, in the opinion of the Executive Committee, it is involved in business related to municipal engineering.
This type of membership offers 4 categories:
• Platinum: Recommended for larger corporates operating countrywide with and/or ties abroad (20+ offices or outlet points).
• Gold: Recommended for medium-sized corporates operating in the major regional centres (10-20 offices or outlet points).
• Silver: Recommended for smaller corporates operating locally (<10 offices or outlet points).
• Professional: Reciprocal complimentary membership for synergy between associated organisations.
An Affiliate Member may request a change to its membership category once a year, when the renewal of its annual subscription becomes payable.
IMIESA magazine
Official journal is published monthly. This prestigious technical journal has won a number of awards, including SAPPI-PICA and other Mondi awards, since its launch in 1975. It also has a strong online presence through websites and social media pages.
Citings and editorial
A citing is compiled by IMIESA's editorial staff, and is valued at least twice that of a paid advertorial of the same size. The following is offered to Affiliates: Note: Company logos are omitted in editorial/citings, as it will lead to losing its value
as an editorial/citing. In order to retain editorial integrity, Affiliates will be entitled to expect exposure on this basis, which provides "clean exposure" in that it is not paid for. New appointments, contracts or important projects will receive attention.
Discount on advertising
All Affiliate Members will automatically receive Most Valued Client status, meaning that advertisement positions are prioritised.
In addition to this, IMIESA offers a discount on all advertisements on submission of publishable technical material by Affiliate Members. The discount is also applicable to other advertorial products such as inserts and inside cover positions of the journal.
Free copies
Affiliate members will receive free copies of the IMIESA journal:
Affiliate showcase
This is a dedicated full page in each issue of IMIESA journal identifying Affiliate Members. Their logos are presented in colour and company names are listed.
Sponsorship at conference “First refusal right” towards sponsorship at the annual IMESA Conference. The conference organising committee/professional organisers will contact all Affiliates in advance, prior to seeking sponsorships from the rest of the industry.
Exhibition stand cost at the annual IMESA Conference
The following discounts are afforded on the cost of exhibition stands at the conference:
Conference registration fees
Delegates representing Affiliate Member Companies can register at the Member rate for the IMESA Conference.
IMESA’s website is one of the main communication mediums. IMESA Affiliates can receive exposure with their logos displayed on the Affiliate Membership sub-site and a link to their website. Additional advertising benefits are being explored.
Affiliate Members will be supplied with a framed certificate from IMESA for their head office, reflecting their Affiliate Membership status. Additional certificates may be requested for other offices of the Affiliate Member.
An IMESA Affiliate may send attendees to branch meetings and similar proceedings. Affiliates will be included on the contact lists of IMESA branches countrywide.
IMESA HEAD OFFICE
Street address: Unit 3 The Summit, 2 Derby Place, Westville, 3629, KwaZulu-Natal, South Africa
Postal address: PO Box 2190, Westville, 3630, KwaZulu-Natal, South Africa
Contact numbers: t +27 (0)31 266 3263/266 0943


Ihave the pleasure of welcoming you all to our 88th IMESA Conference in the beautiful city of East London.
This year’s conference offers all the services and opportunities that our delegates, exhibitors, sponsors and various stakeholders should expect. We hope that all the representatives from national, regional and local authorities/agencies who are attending will have ample opportunity to network and work together with our exhibitors and sponsors who are showcasing their products and innovative solutions. I am sure that everyone will benefit from the opportunities to gain valuable knowledge and to expand the network of contacts.
The conference theme this year is “Sustainable Engineering Solutions” which acknowledges the ongoing challenge for all municipalities to find new and sustainable ways to manage and maintain their infrastructure to meet the ever-growing demands for service delivery. It is a challenge that requires all our shared experience, ingenuity and resourcefulness to achieve success.
The Border Branch LOC members and head office staff are to be commended for their dedication and hard work in organizing an excellent conference program. The papers being presented this year cover topical and relevant aspects of municipal infrastructure engineering.
Municipal projects will also be showcased in the IMESA/CESA Excellence Awards which recognise exceptional achievements in municipal engineering. Three categories are presented, namely Engineering Excellence In Structures & Civils, Community Upliftment & Job Creation and Environment & Climate Change.
I invite you to participate in all that is on offer and to take full advantage of your time at this year’s IMESA
Tooley, Pr Eng Hon FIMESA,
It is good to look back over this first year of my term as IMESA President and be able to note a few achievements.
One of my objectives was to re-establish an IMESA branch in Bloemfontein. The Free State/Northern Cape Branch became dormant after retirement, relocation and emigration of key members. With interest shown at the 2024 IMESA Conference and at capacity building workshops held in Bloemfontein earlier this year, I was encouraged to hold a branch seminar in June 2025. From that event we had enough people to hold a formal branch meeting on 15 August 2025, at which a Chair and Treasurer were elected to kick-start further branch activities. We look forward to seeing the branch grow and become the integral part of IMESA that it used to be.


Our #IMESAseesyou social media campaign has been well supported and gives recognition to a few of our very many engineering colleagues who are crucial to the industry but often go unnoticed. The month of August was assigned to women in engineering and showcased the amazing skills and talent we have access to.
It has been an honour to represent IMESA throughout the year at various events and to interact with high level stakeholders on the crucial issues that continue to challenge all our local municipalities. In February 2025, IMESA responded to the State of National Address (SONA) by sending an open letter to the Office of the President addressed to President Cyril Ramaphosa to express support for the infrastructure measures that were highlighted.

IMESA continues to engage with the CIDB National Shareholders Forum and has members actively involved in both CBE and CIDB.


The Excellence Awards presented jointly by CESA and IMESA will once again take place at this year’s annual IMESA Conference and we are looking forward to the recognition of excellence projects in each of the three categories.

Mr Kasserchun has been appointed as IMESA’s representative for ECSA’s Biennial Engineering

Symposium Advisory Board. He attended the first meeting held on 29 January 2025 in Johannesburg and was elected to chair the advisory committee. ECSA needs help to set up and run the symposium and was looking for one VA to co-host the event. The first symposium will be held in March 2026 in Gauteng.
IMESA has had engagements to consult on the proposed changes on Identificaiton of Engineering Work (IDoEW) proposals. Our Northern Provinces Branch was actively involved in the rollout of ECSA workshops in Limpopo, Mpumalanga and North West.
As a strategic priority for 2025/2026, the executive committee have committed to compiling a needs and numbers analysis, previously provided by Allyson Lawless at SAICE. The challenges include obtaining accurate and comprehensive information as well as assigning resources to handle the large quantity of data analysis that is required.

IMESA raises municipal supply chain management challenges and issues related to interpretation of policy on behalf of the municipalities at every opportunity.
In work that I was doing with COGTA and University of KwaZulu-Natal to establish disaster management approaches for local government, a possible collaboration with IMESA to rollout the study results into workshops at branches was discussed.

It is appreciated that SALGA continues to endorse the IMESA conference and interact with the members and delegates on a range of interventions.

Water Research Commission (WRC)
IMESA is continuing to roll out workshops on flood guidelines and water related capacity building requirements under the five-year agreement signed with WRC. The commitments to the end of the financial year (June 2025) have been met successfully and the second year (July 2025 – June 2026) is in place with capacity building workshops scheduled for Limpopo, Northern Cape, Eastern Cape and Western Cape.
Other opportunities for collaboration are being considered.

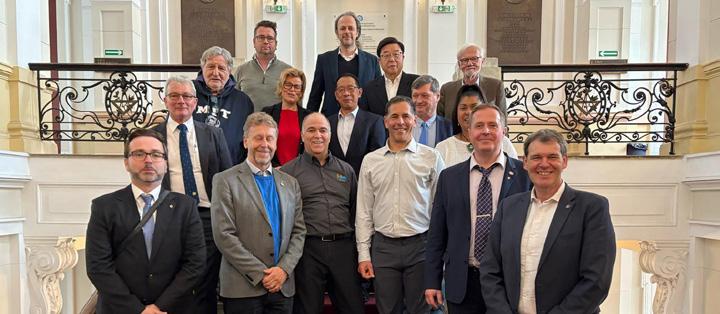
We were unfortunately not able to attend the most recent IFME Board Meeting held in Chicago, USA in August 2025 but I attended the IFME Board Meeting that was held in Warsaw, Poland on 25th-29th March 2025. It is an interesting city that opted to replicate the original structure after 85% of the city was destroyed in the two world wars. It is now a vibrant and clean city.
IFME wants to do more to improve civil engineering in communities globally and to increase awareness of the member services available within IFME. The member countries can share resources, like green building standards and share articles from their magazines for other organizations to publish. It was interesting to hear that China has only one VA organization nationally, but it has 2 761 member units.
From IFME networking, IMESA is working with Australian representatives on the possibility of making available the comprehensive infrastructure asset management training platform that has been compiled by the Institute of Public Works Engineering Australasia (IPWEA). Their Asset Management Pathway provides a lifelong learning program from
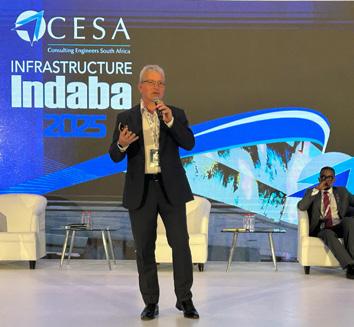
CESA Infrastructure Indaba held on 18-19 March 2025, at the Indaba Hotel, Johannesburg


foundation and skill application to recognition and leadership strategic development, in the context of sustainable service delivery requiring integrated planning between customers, assets and finance.
As mentioned earlier, it is good to have the Free State/Northern Cape Branch back on the list of active branches and to see the energy and enthusiasm in all our branches which is generating more events for local members with good attendance of both members and nonmembers to network and learn from each other. In August this year, the Woman’s Day events held in Johannesburg, Cape Town and Durban were well attended and the feedback was very positive. Golf Days, site visits, training workshops and road shows have added to the activities made available to members.
Another of our strategic priorities for 2025/2026 is to extend our reach and establish branches in our neighbouring countries. If you have an interest in assisting, do let us know.
IMESA has branches covering the following regions:
• Northern Provinces (Gauteng)
• Free State/Northern Cape (Bloemfontein/Kimberley)
• KwaZulu-Natal (Durban)
• Border (East London)
• Eastern Cape (Port Elizabeth)
• Southern Cape/Karoo (George/Mossel Bay)
• Western Cape (Cape Town)
EXCO and Council
Our executive committee has expanded to 15 members with the addition of an Operations Director to oversee the Young Professionals

Portfolio (YP2) which includes driving new membership. After the successful implementation of activities to support graduates and promote ECSA registration in KwaZulu-Natal Branch, our other branches are establishing committees to focus on this aspect. The main aim is to enhance professional and personal growth of younger members and to attract graduates to the municipal engineering environment.
Our regional council representatives continue to drive all IMESA operations and ensure that the institute meets its objectives. I personally am very grateful for the input and support that our institute management team has provided this year.
The institute continues to maintain a secure financial position thanks to careful management of income and expenditure for membership and conferences.
The dedicated team of Alastair Currie, Joanne Lawrie and Asha Pursotham supported by additional resources continue to ensure that our magazine maintains high standards as the official business-tobusiness communication platform for the Institute and all its members. Newsletters and additional facilities for communication between all infrastructure stakeholders will be expanded over the coming year.
It was very sad to receive news of the passing of Mr David (Dawie) Benjamin Botha in September 2025. He joined IMESA in July 1976 and was an active member throughout, providing key support in several projects from 2010-2013. He and other members will be commemorated at our AGM on Tuesday, 04 November 2025.
On behalf of the Local Organising Committee and the Border Branch of IMESA, it gives me great pleasure to welcome you all to the 88th Annual IMESA Conference here in East London. It is an honour to host you in our beautiful city this October, and we are delighted to see delegates gathered from every corner of South Africa to share knowledge, ideas, and expertise that will shape the future of our engineering profession.

I wish to extend my heartfelt gratitude to the dedicated members of the Local Organising Committee, who have worked tirelessly to ensure that this conference is a success. Our thanks also go to the IMESA Head Office team, whose commitment and meticulous planning year after year allow us to deliver an event of this extremely high calibre. Together, this partnership between the local committee and Head Office is what makes the annual IMESA conference a true highlight on our industry calendar.
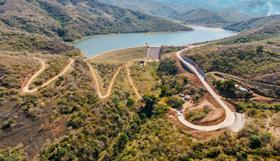
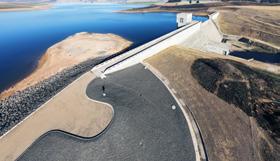
East London, as you will experience over the next few days, is a city rich in engineering heritage and opportunity. From the iconic Port of East London, South Africa’s only commercial river port, to the Bridle Drift and Nahoon Dams, which have supplied water to our communities for decades, engineering is woven into the very fabric of this region. The city stands as a testament to how civil engineering can overcome challenges of topography and infrastructure to support growth, industry, and the lives of its people.
The dolos is one of East London’s most iconic engineering contributions to the world, the dolos is a uniquely shaped concrete block designed to dissipate the energy of waves and protect harbour walls and coastlines from erosion. Its interlocking design makes it incredibly effective in absorbing the force of the sea, and today dolosse (plural) are used in harbours and coastal protection projects all over the world. For East London, the dolos is more than just an engineering marvel –it is a proud symbol of local ingenuity, resilience, and innovation, showing how engineering can have a lasting impact far beyond its place of origin.
We hope you take the time not only to engage fully with the technical programme, but also to experience the warmth of our city and the hospitality of its people. Join us on the Thursday evening at our Social Evening on the picturesque Olivewood Golf Estate with a variety of entertainment planned for everyone. May this conference be a platform for learning, networking, and building lasting professional connections.
Thank you for being here and may your time in East London be both rewarding and memorable.
Chairman: IMESA Border Branch and LOC
Ayanda Skwebu – Vice Chairman / Technical Tours
Deon McQuirk – Finance
Celeste Vosloo – Secretariat / Companions Programme
Debbie Anderson – Head Office
Melanie Stemmer – Head Office


Oliver Ive – Technical Advisory Committee Chair
Adrian van der Merwe and Andre Naude – Golf Day
Kim Hensberg – Companions Programme
Lee Mellin – Transport & Accommodation
Jonathan Clarke – Technical Tours


On arrival at East London Airport, please arrange your own Uber or taxi to the East London International Convention Centre (ELICC) to complete your delegate registration.
The Premier Hotel and the Regent Hotel are on-site and within walking distance of the conference venue. Other hotels listed on the IMESA Conference website are either nearby or will be served by shuttles from the ELICC.
For off-site hotels, you can use the booking link provided by IMESA to reserve a shuttle seat in advance. Please note that seats cannot be guaranteed if the shuttle is full. Daily shuttles will run to and from the conference, and on Tuesday evening, return shuttles will also be available after the Opening Function, departing the ELICC between 20h15 and 21h15.
Friday, the day of departure, delegates must check out of their hotel and bring their luggage to the ELICC. A secure lock-up facility will be provided at the conference venue at the Registration Desk, which is situated at the entrance of the ICC. Leave your luggage at the Registration Desk; it, it will be clearly marked Luggage Drop-off.
On Friday, a free shuttle service will run from the ELICC to the airport, departing at 10h00, 12h00, 13h00, 14h00 and 15h30. Please ensure that all luggage is collected from from Luggage Drop-off at Registration by 14h00.
Everyone attending the conference (members and non-members) is invited to the IMESA AGM. The AGM, which will run for approximately one hour, will take place in the Plenary on Wednesday, 29th October 2025 (after close of the last session).

The Continuing Professional Development (CPD) points will be allocated to those who scan on entering each of the plenary sessions. Scanning before boarding the Technical Tour bus or entering the Plenary for the on-site technical tours for those who don’t want to go off-site.
Registration for CPD accreditation will be done via the IMESA registration staff at the entrance of the Plenary. The onus is on the delegate to ensure he/she scans their name tag which has a unique barcode to log on their CPD points. The system is accurate as long as you tap your name tag with the bar code onto the scanner at the entrance of the Plenary or on departure for the off-site tech tours. Three weeks after the Conference you may contact IMESA via email (Att: Debbie Anderson at conference@imesa.org.za) for an attendance certificate.
Safe parking is available on-site at the East London ICC. IMESA will provide shuttles to the hotels listed on the IMESA website, with some hotels also within walking distance of the venue. Shuttle services will operate from the Tuesday evening Opening Event, in the mornings to the ICC, and in the afternoons back to the hotels. Shuttles will also run between the hotels and the social events.
On Friday, IMESA will provide a shuttle service from the ELICC to the airport. Bookings are essential, and a booking link was sent to you in October to secure your seat in advance.
Smoking is not permitted within any closed area or within close proximity to the exit. There are demarcated areas outside the venue.
BANKING FACILITIES
There are no ATMs on-site.
FNB: 500m from the complex – Promenade, SCT Kennaway Court, Kennay Building, Beach Front, East London
NEDBANK: 1km – Windmill Roadhouse
ABSA: 1km – Spar Light House
MEDICAL FACILITIES & HOSPITALS
In the Exhibition Hall, there will be a medic on-site for the duration of the conference, for minor medical issues.
Medicross: 6km
Life Beacon Bay Hospital: 2km
Life St Dominic’s: 5km
SHOPPING CENTRE
Vincent Mall: 8km
Hemmingways Mall: 12km
WI-FI
Wi-fi is available. The password will be conveyed to delegates on-site.
BRIEFCASES, LAPTOPS & VALUABLES
Do not leave your valuables unattended at your stand or in the conference venue. Delegates are requested to keep their valuables with them at all times.
REGISTRATION
Delegates will be able to register at the Registration Desk, which is conveniently situated at the entrance of the East London ICC. There is FREE parking on-site at the ICC. Registration will open on Tuesday at 11h00. Delegates will receive their delegate bag, and conference programme together with their name badge. Note that proof of identification will be required when registering.
REGISTRATION TIMES
Tuesday: 28th October 2025 from 11h00 to 21h00
Wednesday: 29th November 2025 from 07h00 to 11h00
Thursday/Friday 30th & 31st October 2025 from 07h30 to 08h30
* IMPORTANT: Access to the conference venue will only be permitted once FULL payment has been received. If payment has not been made on arrival, the delegate will still be accepted but must complete an indemnity form, taking personal responsibility for the full account should their company fail to settle it afterwards.
Members of working team will have IMESA branded shirts. The IMESA Info Desk can be found at the Exhibition Hall (on the lower lever) for membership or any other conference related queries. All financial queries will be resolved at the Registration Desk..
All meals and refreshments will be served in the Exhibition Hall, on the lower level of the ELICC. We encourage delegates to visit our exhibitors, who have invested significant effort into their displays and are eager to share their expertise. This is a great opportunity to gain valuable insights into industry challenges and discover new products that could benefit your projects.
Additionally, during the lunch breaks, the KNOWLEDGE Bar, located in the Exhibition Hall, is open to all attendees free of charge. This offers a further opportunity to engage with ongoing industry discussions and stay updated on relevant topics. During the plenary sessions, the MC will update you on the topics that will be discussed.
Your name badge will allow you access to ALL events. Please ensure that you wear it at all times. Should you lose or forget your name badge, proof of identification will be required before a new name badge can be issued to you at a cost of R250 cash.
GOLF DAY @ Olivewood Private Estate & Golf Club
Date: Tuesday 28th October 2025
Venue: Olivewood Golf Club (35.7km from East London ICC)
Time: Registration opens at 09h00 & Shotgun start at 11h00, followed by prize-giving at 17h00
Address: Schafli Road, East London
OPENING FUNCTION & IMESA/CESA EXCELLENCE AWARDS
Date: Tuesday 28th October 2025
Venue: East London ICC
Time: 17h30 for 18h00 in the Plenary (followed by Cocktails in the Foyer of the ICC)
Dress Code: Smart Casual
THURSDAY SOCIAL EVENING
Date: Thursday 30th October 2025
Venue: Olivewood Golf Club
Time: 18h30 for 19h00 until 23h30 (book your transport at the INFO/REGISTRATION desk before 10h00 on Thursday)
Theme: Funky Tekkies
Dress Code: Gear up for a dazzling night! Rock your favourite takkies and not forgetting those FUNKY socks, and your favourite denims, and then add a splash of bling to shine like never before. Let us make it a night to remember!
This event is one of the highlights of the Annual IMESA Conference. Please remember to bring your name badge – and for Exhibitors, your tickets – as these are required for entry.
Wine, beer, and soft drinks will be served (with a set limit), after which a full cashless bar will be available, accepting debit and credit cards only for security reasons.
Transport will be provided from the hotels listed on the IMESA Conference website. To make use of this service, you must book your seat in advance Once booked, you will receive a ticket that will be required to board the shuttle to the Social Evening. The last shuttle will depart from the venue at 23h00. For those using their own vehicles, please note that the venue will close at 23h30.
Tuesday, 28 October 2025
11h00 – 18h00 IMESA Golf Day
11h00 – 21h00 Conference ONSITE REGISTRATION sponsored by uMngeni-uThukela Water
17h30 for 18h00 OPENING FUNCTION & EXCELLENCE AWARDS
Wednesday, 29 October 2025
07h00 – 08h00 Onsite Registration Open sponsored by uMngeni-uThukela Water
08h10 MC opens the 1st day of Conference SESSION 1
08h20 Opening by IMESA President: Geoff Tooley
08h30 ADDRESS by SALGA Representative
08h40 – 09h40 KEYNOTE SPEAKER: Lizelle Maurice (Border-Kei Chamber of Business – Executive Director) sponsored by Mezzanine
09h40 ADDRESS BY DIAMOND SPONSOR: Shawn Gama (CEO of Zimile)
09h55 IMESA YP2
10h05 Promotion of 2026 IMESA Conference
10h10 REFRESHMENTS SERVED IN EXHIBITION HALL
SESSION 2
10h50 MC welcomes delegates to Session 2
11h00 – 11h30 PAPER 1 – David Still
Lessons from a review of rural water and sanitation services in South Africa: 2003-2022
11h30 – 12h00 PAPER 2 – Prof JA du Plessis
A case study analysis on municipal water pipe failures
12h00 – 12h30 PAPER 3 – Dr Kevin Wall
How sound are the municipal foundations laid in 1998, and why is this important to local service delivery?
12h30 Questions from the floor
12h40 LUNCH SERVED IN EXHIBITION HALL
SESSION 3 sponsored by KMSD Engineering Consultants
13h40 MC welcomes delegates to Session 3
13h50 – 14h20 ECSA Presentation
14h50 Questions from the floor
15h00 – 16h00 PANEL DISCUSSION: Quo Vadis? Updating the Local Government White Paper
16h00 REFRESHMENTS SERVED IN EXHIBITION HALL
SESSION 4
16h40 MC welcomes delegates to Session 4
16h50 – 17h20 PAPER 4 – Dr.-Ing. Manuel Krauss & Mkhuseli Nongogo Water Reuse and Energy Optimization at the East Bank WWTP in Buffalo City – Insights into the South AfricanGerman R&D-Project ‘ecReUse’
17h20 – 17h50 PAPER 5 – Giselle Pillay & Thembekile Mdiya
Flowing Forward: Sustainable Engineering Solutions Through Strategic MIG-Funded Refurbishments
17h50 Questions from the floor
18h00 Close of Conference Day 1
Thursday, 30 October 2025
07h00 Coffee in the Exhibition Hall
08h10 MC opens 2nd day of Conference
EVENING AT LEISURE
SESSION 5
08h20 – 08h50 PAPER 6 – Mike Wiese & Karen King
Sustainability of Flood Studies: From Inundation Mapping to Holistic Risk Management in Prospecton, Durban
08h50 – 09h20 PAPER 7 – Chris Wilcock
Sustainable Engineering Solutions need an effective Public Procurement system – will the new Public Procurement Act have a positive effect on municipal procurement?
09h20 – 09h50 PAPER 8 – Jan Palm & Chris Koch
Regionalisation of Waste Disposal: The Weskus District Case Study
09h50 – 10h20 PAPER 9 – Graeme Taylor
Access to Clean Water: Lessons from the Hammanskraal Emergency Water Treatment Project
10h20 Questions from the floor
10h30 REFRESHMENTS SERVED IN EXHIBITION HALL
SESSION 6
11h10 MC welcomes delegates to Session 6
11h20 – 11h50 PAPER 10 – Bhavna Soni & Truman Hardon
Turn Around strategy of eThekwini Water & Sanitation Unit (as per National requirements) and Implementation Action Plan
11h50 – 12h20 PAPER 11 – Melanie Geyer
Transforming Waste: Sustainable Sewage Sludge Management in George Municipality
12h20 – 12h50 PAPER 12 – Phillip Majeke
Sustainable engineering sanitation innovations for improving municipal sanitation service delivery
12h50 Questions from the floor
13h00 LUNCH SERVED IN EXHIBITION HALL
TECHNICAL TOURS for the afternoon
13h45 Delegates depart for Technical Tours and return from Technical Tours at 17h00
14h00 WORKSHOP: Understanding Flood Risks (presented at Premier Hotel Regent)
14h30 PLENARY TECH TOUR SESSION
18h30 to 23h30 SOCIAL EVENING
VENUE: Olivewood Golf Estate
Friday, 31 October 2025
07h00 Coffee in the Exhibition Hall
08h10 MC opens last day of Conference
SESSION 7
THEME: Funky Tekkies DRESS CODE: Casual
08h20 – 08h50 PAPER 13 – Andria Munien & Noelene Rangasamy
Advancing Sustainable Water Management through Smart Metering, AC Pipeline Replacement, and Infrastructure Catalysts in UMDM
08h50 – 09h20 PAPER 14 – Maria Dorothea Giliomee & Ione Loots
Improving Culvert Capacity through Inlet Modifications for Sustainable Adaptation to Increasing Flood Risks
09h20 – 09h50 PAPER 15 – Frankie A’Bear Water Monitoring System for Data-Driven Operations in Barrydale
09h50 – 10h20 PAPER 16 – Matt Braune & Munyaradzi Rupende
Improved municipal stormwater and flood management in changing climatic conditions
10h20 Questions from the floor
10h30 REFRESHMENTS SERVED IN EXHIBITION HALL
SESSION 8
11h10 MC welcomes delegates to Session 8
11h20 – 11h50 PAPER 17 – Ashiel Rampersad
Municipal readiness level for an ageing and deteriorating pavement network for maintenance prioritization
11h50 Questions from the floor
12h00 Presidential Conference Closing Remarks
12h20 CLOSE-OFF FORMALITIES – Best Paper & Best Exhibition Stands
12h40 FINAL Lucky Draw sponsored by Magalies Water
12h45 – 14h00 LUNCH SERVED IN EXHIBITION HALL CONFERENCE CLOSE
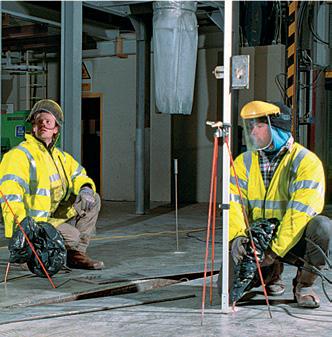

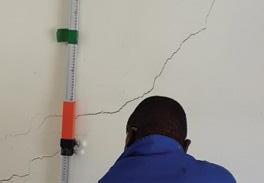


URETEK is your go-to expert for fast, non-disruptive repair of sunken or unstable ground, concrete slabs and foundations. Whether industrial, commercial or residential, URETEK’s patented geopolymer technology lifts, stabilises and strengthens with minimal mess or downtime – no excavation needed.
From roads and highways to homes and factories, URETEK Deep Injection and Slab Lifting methods restore structures to their original levels, while improving the strength of the sub-base and soil beneath.
Whether your problem is routine or complex, we love a challenge and tailor every solution to your needs – quickly, cleanly, and precisely.


22 DIAMOND SPONSOR
Zimile
23 GOLD SPONSOR
uMngeni-uThukela Water
23 SILVER SPONSOR
Kabe Consulting Engineers
24 BRONZE SPONSORS
KMSD Engineering Consultants
Magalies Water
25 MEDIA PARTNER IMIESA Publications
30 EXHIBITOR FLOORPLAN
31 EXHIBITOR PROFILES
Makhaotse, Narasimulu, and Associates (MNA)
25 Mezzanine
South African Value Education (SAVE)


Building pathways. Empowering progress.
At Zimile, we believe infrastructure is more than concrete and steel – it is the foundation for opportunity, dignity, and human connection. Since 2009, we have been on a mission to engineer solutions that build the nation while uplifting its people. Every road we pave and every community we serve reflects our commitment to bridging gaps in access, equity, and resilience.
We are proudly South African – a 100% black-owned and managed Level 1 B-BBEE company – deeply rooted in transformation and committed to meaningful impact. Nearly 45% of our team is made up of women, as we continue to challenge industry norms and empower diverse voices in engineering. We blend experience with fresh talent, guided by mentors who are passionate about developing the next generation.
The name Zimile, derived from isiZulu and referring to resilient hopes, embodies our steadfast aspirations and enduring commitment to growth and progress. It symbolises infrastructure that not only supports economies, but also empowers communities and unlocks opportunity.
Unbounded engineering
“Unbounded engineering” is more than a tagline – it is our philosophy. It means no limits on innovation, no boundaries between disciplines, and no restrictions on who can lead. It reflects our drive to push technical and social boundaries and create inclusive, future-focused solutions.
Our services
As a multi-disciplinary consulting engineering and built environment firm, Zimile provides a full suite of project, engineering, and construction management services. We deliver technology-led solutions across the infrastructure lifecycle – from concept and design to commissioning. Our key focus areas include:
Transport infrastructure
We engineer mobility that connects people to opportunity. From rural access roads to urban corridors, our expertise includes road rehabilitation, maintenance, geometric and pavement design, and reseal projects. Our solutions support social inclusion and economic growth.
Water infrastructure
Water is life – and access is essential. We deliver bulk water supply projects, reservoirs, flood studies, dams and system modelling. Our municipal services include design and oversight of water and wastewater treatment plants, pump stations, sewers, and sanitation systems.
Built environment
We design and deliver schools, offices, housing, and community facilities that uplift and inspire. Our work spans feasibility, design, procurement, and monitoring – creating functional, accessible spaces that promote well-being.
Innovation and technology
Innovation is core to our DNA. We apply digital tools, modern construction methods, and data-driven planning to fast-track quality outcomes. Through collaboration with clients and communities, we bring fresh thinking to complex challenges.
Our people, our purpose
At the heart of Zimile is a diverse, passionate team. We are committed to skills development, mentoring, and building a more inclusive engineering sector. Our success is measured by the positive impact we make – delivering infrastructure that transforms lives.
Rooted in African ingenuity
Zimile is where bold ideas meet practical solutions. Rooted in African ingenuity, we engineer with purpose, passion, and impact. We are not just building infrastructure – we are building a legacy that empowers progress and creates lasting value.
W: www.zimile.co.za

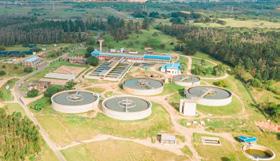
uMngeni-uThukela Water (UUW) is one of South Africa’s largest and most strategically positioned water boards, delivering bulk water services that sustain communities, industries, and municipalities across KwaZulu-Natal. Established in 1974 and renamed in 2023 following the incorporation of Mhlathuze Water into the former Umgeni Water, UUW has become a cornerstone of water security and economic resilience in the province.
The organisation operates within a vast geographical footprint of 94,359 km², providing services to over 12.42 million people and 2.9 million households. Its customer base includes local, metropolitan and district municipalities such as eThekwini, iLembe, Ugu, Harry Gwala, uMgungundlovu, Msunduzi, and Mhlathuze Local Municipality, as well as private bulk water suppliers like Siza Water and industries.
Supporting Industry and Growth
KwaZulu-Natal’s industrial heartland, particularly the Port City of Richards Bay in King Cetshwayo District Municipality, relies heavily on UUW. The organisation supplies water to globally recognised industrial leaders including Mondi Paper, Richards Bay Minerals (RBM), Hulamin, Mpact, Foskor, Tronox, South 32, Richards Bay Titanium, and Wilmar. This reliable water supply not only secures day-to-day operations but also enhances investor confidence, ensuring KwaZulu-Natal remains a competitive hub for manufacturing, exports, and job creation.
UUW’s bulk water services are anchored by an extensive infrastructure portfolio designed and maintained to the highest engineering standards. These assets include: 981km of pipelines and 53km of tunnels; 14 impoundments; 53 water treatment works; 1 effluent pump station; and 23 wastewater treatment works. This infrastructure reflects decades of engineering innovation, continuous investment, and a commitment to operational excellence.
As a National Government Business Enterprise, UUW operates in compliance with the Water Services Act (1997) and the Public Finance Management Act (1999). It reports directly to the Department of Water and Sanitation (DWS), through the Board and the Chief Executive, ensuring transparency, accountability, and alignment with South Africa’s long-term water security goals.
With climate change, urbanisation, and rising industrial demand placing increasing pressure on water resources, UUW continues to prioritise infrastructure development, water reuse, and sustainable supply. Its engineering expertise positions the organisation as both a reliable service provider and a partner to municipalities, industries, and communities striving for resilience and growth.
W: www.umngeni-uthukela.co.za

Kabe Consulting Engineers provides civil, structural engineering & project management. It has a level B-BBBEE 1 and ISO 9001: 2015 Certification. We are committed to Infrastructure development, the development of social & economic projects to the benefit of people and advancement of civil engineering progress across Africa.
Our track record has enabled us from evolving from being a traditional Civil Engineering Consulting firm to a wide range infrastructure development and Civil engineering. Our solutions includes providing smart city infrastructure solutions, Project Management, Planning and design, Risk management, Project Financing and specialist procurement of municipal Infrastructure, Bulk Infrastructure, Roads and storm water, water Infrastructure, structures, energy and mining infrastructure projects.
With over 20 years’ experience, our skills mix and a combined experience of over 150 Years makes Kabe Consulting Engineers your ideal implementing engineering partner.
W: www.kabe.co.za

KMSD Engineering Consultants (Pty) Ltd is a multi-disciplinary consulting engineering firm established in 2009. Our core expertise in the civil engineering field is in water & sanitation, roads & stormwater, structural engineering, and human settlements projects.
By embracing the dynamism that is in the built environment through technological advancement, KMSD seeks to offer value-adding and innovative engineering solutions. Highly qualified professionals with substantial consulting engineering experience and exceptional educational qualifications are the foundation of the company’s service delivery effort.
W: www.kmsd.co.za

Vision: To be the leading provider of quality water and sanitation services in Southern Africa
Mission: To provide sustainable, safe and reliable quality bulk water, sanitation and other related services to Water Services Authorities and other users in order to positively impact the quality of life and economic growth for communities in our area of operation.
Magalies Water is one of the 8 water boards in South Africa mandated to provide bulk water and sanitation services. The Board provides potable water to municipalities, mines and other private consumers within, but not limited to North West, Limpopo and Gauteng provinces. Magalies Water is an organ of state reporting to the Minister of Water and Sanitation and currently stretched over the Pienaars and Crocodile rivers which are the two major catchment areas. With a total staff compliment of +- 700, Magalies Water owns and operates four water treatment plants, namely, Vaalkop (Rustenburg), Klipdrift, Wallmansthal and Cullinan (Pretoria) with the combined capacity of 340Ml/d, as well as a state-of-the-art scientific services laboratory in Brits.
W: www.magalieswater.co.za

Makhaotse, Narasimulu, and Associates (MNA) proudly celebrate 25 years of serving the industry and uplifting communities. Founded by visionary directors Martin Makhaotse and Sagren Narasimulu. MNA has become a symbol of progress dedicated to advancing communities through expertise in civil, structural and electronic engineering.
Leading the team is Managing Director Sagren Narasimulu, supported by the Board of Directors: Martin Makhaotse, Nerave Moodley, and Agilen Moodley. Their leadership is strengthened by a dynamic and talented workforce, Team MNA.
The organizational vision is to be a continental leader in innovative civil engineering solutions, empowering our people through continuous development and transforming communities across the regions we serve through sustainable and cutting-edge infrastructure development.
At MNA, our core values define us: Innovation and Technology, Professionalism, Sustainable Business Practices, Integrity, and Quality Service, guiding our commitment to excellence and impact.
The foundation of MNA has been built on serving people, uplifting communities through our projects, mentoring staff, and nurturing growth within our organizational structure. The legacy of MNA shall always be building with purpose, empowering with vision, and leaving behind a footprint of sustainable progress that future generations can proudly inherit.
W: www.mna-sa.co.za

Mezzanine, established in 2012, designs, develops, and deploys scalable solutions in resource-constrained environments using an SLA-backed SaaS model. Through these solutions, Mezzanine empowers businesses, policymakers, and service providers by digitally transforming their operational models. Increasingly, Mezzanine is investing in the development of AI-driven products that enhance decision-making, improve efficiency, and unlock new value across its solution areas.
Our capabilities and track record: Mezzanine has extensive experience supporting government, donor and private sector enterprises in complex environments. We have deep expertise in governance, stakeholder engagement, and public/donor sector operations. We prioritise discretion, effective stakeholder management, and provide dedicated support to ensure seamless service delivery.
W: www.mezzanineware.com

SAVE provides occupational skills development, community facilitation and advisory services for most related areas in the infrastructure and build environment including on projects in, public transport, human settlements, civil and building construction.
SAVE is accredited with the CETA, is registered as a Private Further Education and Training (FET) college and is in the process of accrediting with the QCTO. Training programmes are customised and localised to each client’s project needs and optimise skills transfer by theoretical classroom training as well as practical on-site workplace training for learners. SAVE has been in business for over 25 years and continues to grow and offer new services to clients and communities we serve.
W: www.savegroup.co.za


IMIESA is the official magazine of the Institute of Municipal Engineering of Southern Africa (IMESA) and is the definitive publication on public infrastructure. It has been in circulation since 1976 and is published by IMESA (Pty) Ltd. The magazine reaches IMESA members as well as decision-makers across all related engineering and built environment disciplines within the construction industry. This provides the ideal business-to-business interface for both readers and advertisers.
Our content is published on different platforms to organically maximise our reach. In addition to our websites, these include:
• Print and digital versions of the magazine, which is published ten times a year.
• Digital newsletters.
• Webinars, videos and e-learning.
• Communication via social media.
The digital version of IMIESA magazine is fully downloadable, shareable and hyperlinked, which extends our audience beyond the confirmed distribution statistics. Your message is delivered on a platform that is optimally formatted to both desktop and mobile devices.
W: www.imesa.org.za
At Zimile, we believe that infrastructure is more than concrete and steel – it is the foundation for opportunity, dignity, and human connection. Since our inception in 2009, we have been on a mission to engineer solutions that build the nation while uplifting its people. Every road we pave, every pipeline we lay, and every community we serve reflects our commitment to reshaping how infrastructure serves society – bridging gaps in access, equity, and resilience.
We are proudly South African – a 100% black-owned and managed Level 1 B-BBEE company – deeply rooted in transformation and committed to meaningful impact. With nearly 45% of our team made up of women, we are actively challenging industry norms and empowering diverse voices to shape the future of engineering. Our team blends experienced professionals with dynamic young talent, guided by seasoned mentors who are passionate about nurturing the next generation.
The name Zimile, derived from isiZulu and referring to resilient hopes, embodies our steadfast aspirations and enduring commitment to growth and progress. It symbolises the promise of infrastructure that not only supports economies but also uplifts communities, unlocks opportunity, and contributes to sustainable development.
Unbounded engineering
Unbounded engineering is more than a tagline – it is our philosophy. It reflects our belief that true engineering knows no limits. No boundaries between disciplines. No barriers to innovation. No restrictions on who can lead or what is possible. It speaks to our commitment to break new ground, push technical and social boundaries, and create solutions that are imaginative, inclusive, and future-focused.
We approach every project with this mindset – using creativity, collaboration, and compassion to develop infrastructure that responds to real needs and makes a measurable difference in people’s lives.
As a multi-disciplinary consulting engineering and built environment firm, Zimile offers a full suite of project, engineering, and construction management services. We provide technology-driven solutions across the entire infrastructure lifecycle – from concept development and design to project commissioning.
Our work is rooted in excellence and impact. We do not just design infrastructure – we design systems that enable communities to grow, economies to function, and people to thrive. Our approach integrates technical rigour with community engagement, ensuring that our solutions are responsive, resilient, and responsible.
Our core areas of expertise include:
Transport infrastructure
We see transport not just as a means to move people and goods, but as the veins of a thriving society. Our transport solutions range from rural access roads to urban mobility corridors. With a strong portfolio in road rehabilitation, maintenance, geometric and pavement design, and reseal design, we engineer mobility that connects communities to schools, clinics, economic hubs, and each other.
Transport plays a critical role in shaping economic opportunity and social inclusion. Whether designing new transport links or maintaining existing infrastructure, we prioritise accessibility, safety, and long-term value. Our teams work closely with government, municipalities, and communities to ensure the infrastructure we deliver supports regional integration and sustainable development.
Water resource and infrastructure development
Water is life, and equitable access is non-negotiable. Our water engineering division specialises in bulk water supply projects, reservoir design and construction, flood studies, hydrological modelling, hydraulic and system analysis, as well as the planning and development of bulk infrastructure.
In municipal services, we offer planning, scoping, design, procurement, contract administration, and construction monitoring
We are not just building infrastructure. We are building a legacy – one that empowers progress, inspires change, and makes a difference where it matters most.
for water and wastewater treatment plants, pump stations, rising mains, catchment systems, outfall sewers, and onsite sanitation systems. We take a holistic view of water infrastructure – combining environmental stewardship, engineering precision, and social responsiveness. Our goal is to improve water security, reduce service delivery backlogs, and contribute to healthier, more resilient communities.
Our capabilities in property development and vertical infrastructure include the design and implementation of schools, offices, housing developments, recreation centres, and community facilities. We apply our expertise across design, documentation, procurement, and construction monitoring to deliver spaces that uplift communities and create long-term value.
The built environment is central to how people live, work, and connect. At Zimile, we design buildings and facilities that promote well-being, inclusivity, and accessibility. From feasibility studies to final delivery, we bring together architecture, engineering, and project management to create functional and inspiring environments.
Innovation is in our DNA. We embrace the dynamism of the built environment through the application of digital tools, modern construction methodologies, and data-driven planning. Our teams use environmental screening and mapping technologies to fast-track quality outcomes.
We believe the future of engineering lies in collaboration – not only across disciplines, but also between engineers, communities, and technology. By co-creating with clients and stakeholders, we bring fresh perspectives to complex challenges and unlock smarter, more resilient solutions.
Our innovation extends beyond tools and techniques. It is a mindset that drives us to question the status quo, explore new frontiers, and develop solutions that are fit for the future. Whether through digital twins, predictive modelling, or sustainable materials, we continuously seek to deliver better outcomes for people and the planet.
At the heart of Zimile is our people. We are a team of engineers, project managers, designers, and support professionals bound by a shared purpose and a passion for excellence. Our diversity is our strength – combining different backgrounds, experiences, and perspectives to generate holistic and innovative solutions.
We are committed to developing talent and promoting inclusion at every level. Through mentorship, skills development, and knowledge sharing, we create pathways for growth and leadership. We are especially proud of our track record in advancing women in engineering – not as a token effort, but as a strategic imperative.
We measure success not only by technical performance, but by the positive impact we have on people’s lives. From the rural roads that connect learners to schools, to clean water systems that reduce health risks, our projects tell a story of transformation and hope.
We partner with government, private sector clients, development agencies, and community organisations to deliver infrastructure that is sustainable, inclusive, and aligned with national development goals. Our work contributes directly to several Sustainable Development Goals, including clean water and sanitation, industry innovation and infrastructure, and reduced inequalities.
We are Zimile – where bold ideas meet practical solutions. We fuse technical excellence with imaginative thinking to design infrastructure that serves today and shapes a sustainable tomorrow. Rooted in African ingenuity, we engineer with purpose, passion, and a commitment to meaningful impact.
From our headquarters in South Africa and regional offices across the country, we continue to grow our footprint and deepen our impact. Each project is a testament to our values – integrity, collaboration, excellence, and transformation.
We are not just building infrastructure. We are building a legacy. One that empowers progress, inspires change, and makes a difference where it matters most.

www.zimile.co.za
As one of South Africa’s largest and most strategically positioned water boards, uMngeni-uThukela Water (UUW) delivers bulk water services that sustain communities, industries, and municipalities across KwaZulu-Natal.
Established in 1974 and renamed in 2023 following the incorporation of Mhlathuze Water into the former Umgeni Water, UUW has become a cornerstone of water security and economic resilience in the province.
The organisation operates within a vast geographical footprint of 94,359 km², providing services to over 12.42 million people and 2.9 million households. Its customer base includes local, metropolitan and district municipalities such as eThekwini, iLembe, Ugu, Harry Gwala, uMgungundlovu, Msunduzi, and Mhlathuze Local Municipality, as well as private bulk water suppliers like Siza Water and industries.
KwaZulu-Natal’s industrial heartland, particularly the Port City of Richards Bay in King Cetshwayo District Municipality, relies heavily on UUW. The organisation supplies water to globally recognised industrial leaders including Mondi Paper, Richards Bay Minerals (RBM), Hulamin, Mpact, Foskor, Tronox, South 32, Richards Bay Titanium, and Wilmar. This reliable water supply not only secures day-to-day operations but also enhances investor confidence, ensuring KwaZulu-Natal remains a competitive hub for manufacturing, exports, and job creation.
UUW’s bulk water services are anchored by an extensive infrastructure portfolio designed and maintained to the highest engineering standards. These assets include:
• 981 km of pipelines and 53 km of tunnels;
• 14 impoundments;
• 53 water treatment works;
• 1 effluent pump station; and
• 23 wastewater treatment works.
This infrastructure reflects decades of engineering innovation, continuous investment, and a commitment to operational excellence.
As a National Government Business Enterprise, UUW operates in compliance with the Water Services Act (1997) and the Public Finance Management Act (1999). It reports directly to the Department of Water and Sanitation (DWS), through the Board and the Chief Executive, ensuring transparency, accountability, and alignment with South Africa’s long-term water security goals.
With climate change, urbanisation, and rising industrial demand placing increasing pressure on water resources, UUW continues to prioritise infrastructure development, water reuse, and sustainable supply. Its engineering expertise positions the organisation as both a reliable service provider and a partner to municipalities, industries, and communities striving for resilience and growth.
Kabe Consulting Engineers is proud to celebrate 20 years in business. With over two decades, Kabe Consulting Engineers has grown from establishing itself as one of the homegrown names with a track record in the civil engineering and infrastructure development industry. Our company has become one of the few success stories that started with an entrepreneurial vision and the quest for African greatness.
Our company provide professional services in civil engineering, structural engineering, project and construction management and has an ongoing commitment to the belief that all it takes is implementing a proper civil infrastructure to improve lives of communities we operate in.
We cover projects across small to large scale civil infrastructure and can deliver on any assignment. With a broad track record of clientele ranging from Municipalities, Road Agencies, Water Authorities, Provincial Departments, State Owned and enabler entities across the country and over the years we have led and implemented appointments from simple
to complex projects which 40% of our project are in Municipalities, 27% Development Agencies and 23% are in private Clients.
Our brand stands for success and the last two decades proves as a testament to our mission and commitment to providing our clients with services to enable them to improve lives. Our track record speaks, and we are proud of our history.
We look forward to a great future “said Mpho Malefane, Marketing and Business Development Officer” Through our alliance the company is now making inroads into the SADC and East Africa Markets and endeavour to make a meaningful impact in these African markets and advance Africa’s infrastructure.

www.kabe.co.za

The Anton Paar Group develops, produces, distributes and provides support for analytical instruments used in research, development and quality control worldwide. Located in South Africa, Anton Paar Southern Africa (Pty) provides sales, application support and service to users across Southern Africa.
Anton Paar produces high-end measuring and laboratory instruments for industry and research. It is the world leader in the measurement of density, concentration and CO2 and in the field of rheometry. Other areas of specialty are: Petroleum testing, microwave synthesis, viscometry, polarimetry, refractometry, X-ray scattering, sample preparation and surface characterization.
Representative: Lorin Hosken
T: +27 (0)82 900 5623
E: Lorin.hosklen@anton-paar.com
W: www.anton-paar.com
Stand: 41
Civil engineering remains a cornerstone of infrastructure development and economic growth, embodying a wide range of projects from roads and bridges to dams and urban development. The Bargaining Council for the Civil Engineering Industry (BCCEI) plays a pivotal role in maintaining harmony, setting standards and ensuring fair practices. Membership is not just a legal requirement but should be seen as a strategic asset for businesses operating within this space. There are multifaceted benefits of belonging to the BCCEI, both for employers and employees in the civil engineering industry, including establishing and enforcing industry standards ensuring sustainability in civil engineering projects.
Representative: Lindie Fourie
T: +27 (0)11 450 4966
E: Lindie.fourie@bccei.co.za
W: www.bccei.co.za
Stand: 6


With a proud heritage of over 57 years, BVi has cultivated a trusted and respected brand, both locally and internationally. We proudly serve medium to large corporations across South Africa and beyond, offering integrated, professional engineering services tailored to each client’s needs.
At BVi, our brand is more than a visual identity – it is a reflection of our purpose and principles. Our motto, “Big enough to make a difference, small enough to care,” speaks to our ability to deliver high-impact solutions while maintaining close, meaningful relationships with clients and communities.
At BVi, we are continuously evolving to meet the challenges of tomorrow, growing our business, enriching our culture, and ensuring that our people, our clients, and our communities remain at the heart of everything we do.
Representative: Primala Singh
T: +27 (0)82 887 8804
E: primalas@bvi.co.za
W: www.bvi.co.za
Stand: 14

Construct Executive Search (CES) is a specialist recruitment agency headquartered in South Africa with a growing presence in Zambia. We provide tailored talent solutions across key sectors including engineering, construction, mining, healthcare, ICT, finance, and renewable energy.
With deep industry knowledge and strong headhunting capabilities, CES connects businesses with high-impact professionals across Africa. As a female-owned and people-driven firm, we pride ourselves on professionalism, integrity, and agile service delivery.
Our success lies in understanding both client needs and candidate potential delivering placements that go beyond CVs to build long-term partnerships and empower workforce growth across the continent.
Representative: Kabwe Gondo
T: +27 (0)78 866 9305
E: kmulolo@constructexec.co.za
W: www.constructexec.co.za
Stand: 52

Consulting Engineers South Africa (CESA) is a voluntary association of Consulting Engineering firms with a member base across the country totaling in excess of 580 companies. CESA is the custodian of the wellbeing of the industry supported by member firms who employ approximately 17 000 people. CESA members are compelled to subscribe to upholding the integrity of the industry by adhering to a professional code of ethics providing quality and cost-effective professional consulting engineering services.
Member companies offer consulting engineering services that include a comprehensive range of planning, design and project delivery services across all engineering disciplines including Civil, Structural, Mechanical, Electrical, Industrial and Mining etc.
The organisation serves as a channel for Clients to address industry concerns while at the same time providing a platform for the sharing of information with the aim of assisting in optimising the planning and delivery of infrastructure projects both in the public and private sector.
Representative: Bonolo Nkgodi
T: +27 (0)11 463 2022 | +27 (0)79 687 4565
W: www.cesa.co.za
Stand: 29

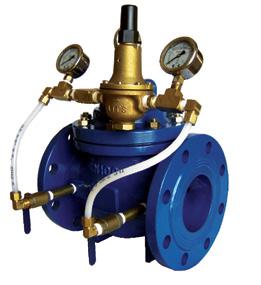
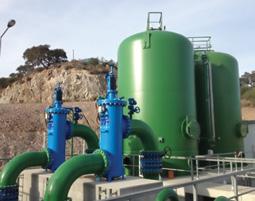
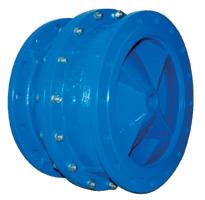
Dynamic Fluid Control (DFC), established in 1947, is a leading global manufacturer of high-performance industrial valves. Headquartered in South Africa, DFC operates internationally across the USA, Australia, Brazil, and Finland. With over seven decades of engineering excellence, DFC delivers reliable valve solutions for water, effluent, mining, and industrial applications. The company prides itself on superior product quality, advanced manufacturing capabilities, and comprehensive technical support. DFC’s commitment to innovation, talent development, and customer satisfaction drives its mission to be a trusted partner in fluid control, offering tailored services including valve repair, site audits, and pipeline design optimization
Representative: Charon Maseka
T: +27 (0)63 624 9401
E: Charon.maseka@dfc.co.za
W: www.dfc.co.za
Stand: 19

Drone Labs is a pioneering, women-owned Level 1 B-BBEE company leading the integration of advanced drone solutions across key sectors. With nine specialised divisions, including agriculture, construction, infrastructure inspection, public safety, environmental monitoring, real estate, and education, Drone Labs empowers industries with cost-effective, data-driven aerial intelligence and operational efficiency. Our mission is to revolutionise service delivery and infrastructure management through cutting-edge drone technology. We are also committed to developing future talent through our Drone Academy, equipping learners with critical 4IR skills. At Drone Labs, we merge innovation with impact, delivering smart, safe, and sustainable solutions that drive progress in a rapidly evolving world.
Representative: Natasha Kammies
T: +27 (0)63 425 9540
E: info(@dronelabs.co.za / natasha@slb.co.za
W: www.dronelabs.co.za
Stand: 7

Ecochem Pumps, founded some 21 years ago, has traditionally specialised in dosing applications representing Milton Roy pumps within sub-Saharan Africa. We have over the years with the addition of strategic staffing and IP been able to extend our specialised offerings to Disinfection becoming the representative for Control Matik Chlorination equipment for South Africa as well as recently acquiring the Enviro-Cell trademark of OSEC equipment
Apart from our mechanical and electrical engineered solutions and workshops we offer the market nationally, we are proud to have been able to bring some very specialised offerings to the market such as gas odorization plants, spark and flame proof platinum and gold mining chemical plants as well as being appointed the only certified service centre for Milton Roy Dosing pumps in African.
We have further successfully engaged in water and waste water maintenance and upgrade projects providing a turnkey solution-based approach to this market.
Representative: Jade Janaki
T: +27 (0)11 455 5710
E: Jade@ecochempumps.co.za
W: www.ecochempumps.co.za
Stand: 37

The Engineering Council of South Africa (ECSA) is a statutory body established in terms of the Engineering Profession Act (EPA), 46 of 2000. ECSA's primary role is the regulation of the engineering profession in terms of this Act. Its core functions are the accreditation of engineering programmes, registration of persons as professionals in specified categories, and the regulation of the practice of registered persons.
ECSA is the only body in South Africa that is authorised to register engineering professionals and bestow the use of engineering titles, such as Pr Eng, Pr Tech Eng, Pr Techni Eng, Pr Cert Eng, on persons who have met the requisite professional registration criteria.
ECSA’s vision is to thrive to be an effective regulator assuring engineering excellence and the Council seeks to achieve this vision through:
• Determining engineering standards for education, accreditation, and registration.
• Registration of Engineering practitioners.
• Developing and sustaining a relevant, transformed, competent and internationally recognized engineering profession as well as practice standards.
• Enforcing compliance with education, training, registration, continuing education and professional practice standards.
• Maintaining a competent workforce, efficient and adequate governance structures and systems.
• Educating the public on expected engineering quality standards and protecting the interests of the public against sub-standard quality of engineering work.
• Regulatory efforts to ensure environmental protection; and
• Engaging with Government to support national priorities including transformation of the engineering profession.
• Instituting collaborative efforts with ECSA stakeholders with a view to enhancing ECSA offerings.
ECSA is under the leadership of Mr Thembinkosi Madikane, Pr. Eng (President), Ms Marcia Maidi, Pr. Eng (Vice President) and Dr Bridget Ssamula, Pr. Eng (Chief Executive Officer).
Representative: ECSA Reception/ Call-Centre
T: +27 (0)86 122 5555
E: engineering-oconnect@ecsa.co.za
W: www.ecsa.co.za
Stand: 63

EDAMS Technology is an International Information Technology Company specialising in designing, developing and supporting industry specific, extensively functional, and parameterised, fully integrated management systems, committed to solving critical Water and Energy infrastructure challenges for Utilities, Municipalities and Government Departments.
EDAMS Products encompass best business practices and engineering methods, integrating the commercial, technical, and planning functions enabling our customers to meet their clients' needs, enhance performance, cost efficiency and sustainability.
The company’s Head Office is in Cyprus with offices in South Africa, Botswana, Egypt and America. Operations in 3 diverse regions, with over 1,000 active users across 5 vertical industries (Water & Sanitation/Solar Industry/Electricity Distribution/Municipalities/Government).
Representative: Ms. Mapula Aphane
T: +27 (0)11 234 9404
E: mapula@edams.co.za
W: www.edams.com
Stand: 25

Envirosan Sanitation Solutions is a Level 2 B-BBEE black-owned enterprise that provides a turnkey solution for the research, development, manufacturing and installation/construction of a comprehensive range of safe, dignified and sustainable water-efficient sanitation solutions to rural and peri-urban schools and households.
With more than two million toilets successfully delivered and installed worldwide since our inception in 2006, Envirosan continuously strives to not only meet but exceed our customers’ expectations.
Representative: Stewart Smetherham
T: +27 (0) 31 700 1866
E: stewart@envirosan.co.za
W: www.envirosan.co.za
Stand: 58

As a leader in water care and resource recovery, ERWAT provides sustainable, affordable, quality water care and resource recovery services through partnerships and collaborative initiatives with external role players, utilising smart organisational practices.
ERWAT provides bulk wastewater conveyance and treatment to thousands of industries and more than 4,2 million people. It currently operates 19 water care works that release some 1000 megalitres of wastewater, both domestic and industrial, per day.
ERWAT’s Commercial Business wing services municipalities, government and state-owned entities, as well as markets such as mining and minerals, food and beverage and manufacturing.
ERWAT Scientific Services offers a wide range of ISO/IEC 17025 accredited testing methods.
Representative: Wanda Annandale
T: +27 (0)21 929 7000
E: wanda.annandale@erwat.co.za
W: www.erwat.co.za
Stand: 3 + 4

GLS Consulting is the leader in infrastructure planning in South Africa. Over 35 years ago, GLS commenced its service offerings with water and sewer infrastructure and has in recent years added electricity and fibre. Our Master Model approach is premised on data digitalisation and centralisation, thereby empowering utilities to make data-driven decisions. Underpinning the master planning process is GLS proprietary software (SWIFT, WADISO, SEWSAN, EDISAN) for hydraulic and electrical modelling and analysis in a GIS environment. Our approach enables us to seamlessly identify revenue enhancement opportunities for utilities, including tariff analysis and review with the associated cost of supply studies. At GLS we believe in "Analysing Today, Saving Tomorrow!"
Representative: Adie Veinings
T: +27 (0)21 880 0388
E: info@gls.co.za
W: www.gls.co.za
Stand: 40

Hall Longmore can trace its history to 1924 and is now owned by the South Africa-based Barnes Group of Companies.
To better position the company in terms of BBBEE requirements, Hall Longmore Steel Solutions and Hall Longmore Infrastructure were formed, with solutions catering for the local pipe retail market and Infrastructure involved in Southern African infrastructure development projects.
Hall Longmore is recognized worldwide as a leader in the manufacture of electric resistance welded (ERW) and spiral welded (H-SAW) steel pipe and casings.
Hall Longmore’s products are used in a wide range of applications including the transportation of raw and potable water, gas and petrochemicals, slurries and tailings, piling, structural fabrication and solar installations.
Representative: Callum Storar
T: +27 (0)11 874 7315
E: callum.storar@hall-longmore.co.za
W: www.hall-longmore.co.za
Stand: 16

Herrenknecht is a technology and market leader in the area of mechanised tunnelling systems. Herrenknecht is the only company worldwide to deliver tunnel boring machines for all ground conditions and in all diameters - ranging from 0.10 m to 1 9 m - and continues to make inroads into the South African market, especially on the municipal level. The product range includes tailormade machines for traffic, supply and disposal tunnels, technologies for trenchless pipeline installations, as well as drilling equipment for vertical and inclined shafts and deep drilling rigs.
Under the umbrella of the Herrenknecht Group, a team of innovative specialists has formed to provide integrated solutions around tunnel construction with project-specific equipment and service packages upon request.
Representative: Swen Weiner
T: +49 7824 302 0
E: info@herrenknecht. com
W: www. herrenknecht. com
Stand: 42 + 43

Hewi-Africa is the appointed representative of Hewitech Germany in Africa, supplying specialist plastic media for water and wastewater treatment, cooling technology, agriculture, and construction industries.
We provide engineered solutions such as lamella for clarifiers, biofilter media for trickle filters, cooling tower fill media, drift eliminators, and louvres. Combining German engineering with local expertise, our products are designed for durability, efficiency, and sustainability. At Hewi-Africa, we are committed to helping industries optimize processes, conserve resources, and achieve long-term performance through innovative, reliable, and costeffective solutions.
Representative: Thabisa Mhlungu
T: +27(0)67 260 8882
E: thabisa@hewi-africa.co.za
W: www.hewi-africa.co.za
Stand: 23

Honeywell/Elster Kent metering has been an industry leader, a world class provider of metering products and advanced metering solutions within the water sector. Elster’s enduring success stems from its legacy of innovation and quality. By merging high-quality, accurate water meters with information technology solutions and wireless communications, Honeywell/Elster are advancing metering into the next generation.
Representative: Mike Phillips
T: +27 (0)60 798 8480
E: Mike.phillips@honeywell.com
W: www.smartenergy.honeywell.com
Stand: 20

IDEXX water testing solutions are approved or accepted by regulatory agencies in over 40 countries, protecting billions of people daily, delivering easy, rapid, accurate and cost-effective information on water quality to laboratories, public utilities, and facility managers.
IDEXX products include Colilert®, published as ISO standard ISO 9308-2 for the testing of coliforms and E. coli in water, together with Pseudalert® for detection of Pseudomonas aeruginosa in facilities, hospitals, pools and spas, which gives confirmed results in just 24 hours and was published as ISO standard 16266-2 in 2018.
IDEXX recently added the semi-automated ‘lab in a box’ TECTA technology in the water testing portfolio which offers real time testing with results available between 2 – 16 hours.
Requiring minimal space and equipment, IDEXX tests can be carried out easily with minimal training, giving water laboratories access to rapid, confirmed results that can be used confidently to determine levels of microbial contamination in water systems.
Representative: Shane Soobramoney
T: +27 (0)71 149 3632
E: Shane-Soobramoney@idexx.com
W: www.idexx.com/water
Stand: 38

Over 20 years, we have built a reputable and progressive professional consulting firm where professional people from diverse backgrounds come and work together through mutual respect. Our goal is to ensure that our client's objectives are met, our expertise lead us in meeting our clients' objectives and we deliver as promised.
Our team, partners and associates understand that we do not compromise on delivering best solutions to our customers and stakeholders. we have ensured that we provide clients with work and advice of the highest quality that adds value to their projects. We do this whilst maintaining engineering excellence and adhering to our professional standards.
Representative: Themba Zulu
T: +27 (0)31 324 2200
E: themba@ibhongo.co.za
W: www.ibhongo.co.za
Stand: 57
IMIESA is the official magazine of the Institute of Municipal Engineering of Southern Africa (IMESA) and is the definitive publication on public infrastructure. It has been in circulation since 1976 and is published by IMESA (Pty) Ltd. The magazine reaches IMESA members as well as decision-makers across all related engineering and built environment disciplines within the construction industry. This provides the ideal business-to-business interface for both readers and advertisers.
Our content is published on different platforms to organically maximise our reach. In addition to our websites, these include:
• Print and digital versions of the magazine, which is published ten times a year.
• Digital newsletters.
• Webinars, videos and e-learning.
• Communication via social media.
The digital version of IMIESA magazine is fully downloadable, shareable and hyperlinked, which extends our audience beyond the confirmed distribution statistics. Your message is delivered on a platform that is optimally formatted to both desktop and mobile devices.
Managing Editor: Alastair Currie
C: +27(0)82 491 5759
E: alastair@infraprojects.co.za
W: www.imesa.org.za
Stand: 32

For over 25 years, IMQS has leveraged the power of ever-evolving modern technology to optimise the delivery of infrastructure-based services in both the public and private sector.
IMQS provides advice and implementation support on fit-for-purpose and scalable solutions, underpinning improvement in management practice in operations, planning and strategy development.
Core competencies include physical and financial asset management, information technology, data management and analytics, change management and training. The company leverages a network of strategic partners that extend the reach into clients in a range of industries and geographies.
Representative: Sheminé Adams
T: +27 (0)21 880 2712
E: info@imqs.co.za | shemine.adams@imqs.co.za
W: www.imqs.co.za
Stand: 51

Kabe Consulting Engineers provides civil, structural engineering & project management. It has a level B-BBBEE 1 and ISO 9001: 2015 Certification. We are committed to Infrastructure development, the development of social & economic projects to the benefit of people and advancement of civil engineering progress across Africa.
Our track record has enabled us from evolving from being a traditional Civil Engineering Consulting firm to a wide range infrastructure development and Civil engineering. Our solutions includes providing smart city infrastructure solutions, Project Management, Planning and design, Risk management, Project Financing and specialist procurement of municipal Infrastructure, Bulk Infrastructure, Roads and storm water, water Infrastructure, structures, energy and mining infrastructure projects.
With over 20 years’ experience, our skills mix and a combined experience of over 150 Years makes Kabe Consulting Engineers your ideal implementing engineering partner.
Representative: Kabefa Moloisane
T: +27 (0)87 809 0982
E: info@kabe.co.za
W: www.kabe.co.za
Stand: 27

Kaytech is a leading South African manufacturer and supplier of geosynthetics, delivering innovative solutions for civil, environmental and geotechnical engineering.
At IMESA 2025, we’ll showcase Kaybion® baskets for erosion and hydraulic control, high-strength dewatering tubes for sludge management, and Multi-Cell® PP for labour-based road construction. Also on display are Bidim® geotextiles, Sealmac® paving fabrics, G-Grid® geogrids, RockGrid® PC geocomposite geogrids and a range of effective drainage solutions including Flo-Drain®, WickDrain® and Megaflo™.
With decades of experience and in-house manufacturing expertise, Kaytech offers engineered products designed to improve performance, reduce costs and extend the lifespan of infrastructure projects.
Representative: Julian Maastrecht
T: +27 (0)83 252 6231
E: julianm@kaytech.co.za
W: www.kaytech.co.za
Stand: 47

KMSD Engineering Consultants (Pty) Ltd is a multi-disciplinary consulting engineering firm established in 2009. Our core expertise in the civil engineering field is in water & sanitation, roads & stormwater, structural engineering and human settlements projects. By embracing the dynamism that is in the built environment through technological advancement, KMSD seeks to offer value adding and innovative engineering solutions. Highly qualified professionals with substantial consulting engineering experience and exceptional educational qualifications are the foundation of the company's service delivery effort.
Representative: Dephney Mabuela
T: +27 (0)87 940 3119
E: dephneym@kmsd.co.za
W: www.kmsd.co.za
Stand: 28

Lukhozi Consulting Engineers (Pty) Ltd, established in 2000, is 79% blackowned and 7% black women-owned, reflecting our commitment to diversity and empowerment.
With offices across South Africa, we offer a comprehensive range of services including project management, civil, structural, mechanical, electrical, and environmental engineering. Our team of 80 skilled professionals is dedicated to delivering infrastructure projects that enhance social, economic, and environmental quality of life.
We have a proven track record in various sectors, and our client-focused approach ensures we remain dedicated to your needs from project inception to completion. We are open for business, please visit our exhibition at stand No 54.
Representative: Casper Brink
T: +27 (0)43 721 1321
E: c.brink@lukhozi.co.za
W: www.lukhozi.co.za
Stand: 54

LVSA Group is Africa’s leading 100% black-owned valve manufacturer and distributor, supplying a comprehensive range of industrial valves and fittings to sectors including petrochemical, oil & gas, water, mining, sugar, power, and food & beverage.
With manufacturing facilities covering 24,000 m² and distribution centers across South Africa and Mozambique, LVSA is proud to be the first company in Africa to achieve API-600 certification, alongside ISO 9001:2015 and other international standards. As Africa’s largest stockist of valves, LVSA combines world-class quality with local expertise, while driving socio-economic empowerment as a Level 1 BBBEE contributor.
T: +27 (0)31 054 7650
E: sales@lvsagroup.co.za
W: www.lvsagroup.co.za
Stand: 26

m4a (Pty) Ltd is a specialist manufacturer of composite and plastics products with a focus on utilities networks and infrastructure markets. In-house design, tool making, and our various manufacturing capabilities, provide end-toend development, manufacture and supply of solutions to the client. m4a complies with global mark and specification schemes and is ISO9001 certified and accredited. Investment into Injection moulding, Compression moulding, and Extrusion technologies make m4a a novel manufacturing enterprise.
Since our establishment in 2002, m4a has grown significantly, driven by our dedication to meeting the evolving demands of the civil construction industry. Our locally manufactured infrastructure products are widely approved and accepted by various municipalities across South Africa.
By offering composite solutions that surpass traditional materials, we provide durable and sustainable alternatives that meet and exceed industry expectations.
In short, we: Innovate, Build and Deliver.
Representative: Fagan Dillon | Pranesh Maniraj
T: +27 (0)11 903 7023
E: info@m4a.co.za
W: www.m4a.co.za Stand: 15

Maccaferri has spent over 140 years on a journey of continuous advancement. Our identity is rooted in the pursuit of smarter, more efficient engineering solutions – leveraging deep expertise, cutting-edge research, and a relentless commitment to meeting the evolving needs of our markets.
Today, Maccaferri stands as a trusted global leader in civil, geotechnical, and environmental construction. From robust retaining walls and resilient hydraulic structures to advanced rockfall mitigation systems and sophisticated soil reinforcement, we deliver solutions that shape the built environment. Our vision – Nurturing the world of tomorrow – reflects our enduring pledge to environmental sustainability.
Representative: Nadeena Le’Tang
T: Direct: +27 (0)11 010 0658 | Mobile: +27(0)83 657 7033
Switchboard: +27 (0)11 010 0651
E: n.letang@maccaferri.com
W: www.maccaferri.com/za/ Stand: 53

Macsteel Fluid Control is a leading player in South Africa water infrastructure sector, dedicated to supplying and commissioning top quality solutions. We specialize in Bermad Control Valves, TOSAWRAP, TOSA Blankets and Pipe Systems, all backed by rigorous water approvals. Our Team of experts ensures seamless delivery and commissioning/products support, meeting the unique needs of our clients. With a commitment to excellence and customer satisfaction, we strive to build long -term relationships and drive growth in the water industry. Trust Macsteel Fluid Control to provide innovative solutions for your water infrastructure needs.
Representative: Adriaan Kruger
T: +27 (0) 082 557 2185
E: Adriaan.kruger@macsteel.co.za
W: www.macsteel.co.za
Stand: 48 + 49

Magalies Water is one of the 8 water boards in South Africa mandated to provide bulk water and sanitation services. The Board provides potable water to municipalities, mines and other private consumers within, but not limited to North West, Limpopo and Gauteng provinces. Magalies Water is an organ of state reporting to the Minister of Water and Sanitation and currently stretched over the Pienaars and Crocodile rivers which are the two major catchment areas. With a total staff compliment of +- 700, Magalies Water owns and operates four water treatment plants, namely, Vaalkop (Rustenburg), Klipdrift, Wallmansthal and Cullinan (Pretoria) with the combined capacity of 340Ml/d, as well as a state-of-the-art scientific services laboratory in Brits.
Facebook & Twitter: @MagaliesWaterZA
W: www.magalieswater.co.za
Stand: 10 + 11

Mainline Civil Engineering Contractors is at the cutting edge of pipeline installation, and the rehabilitation of underground infrastructure in Southern Africa, primarily by trenchless technology and specialist civil engineering methods. By using the latest techniques and equipment we ensure minimal public and environmental disruption. Mainline has an extensive inventory of modern high-tech equipment and serves both the public and private sector.
Representative: Zakeelah Jansen
T: +27 (0)21 461 7499
E: zakeelah@mainlinesa.co.za
W: www.mainlinesa.co.za
Stand: 12

N&Z Instrumentation & Control specialises in water demand management: Our ‘plug and play’ WaMSS software collects flow, level and water quality data, analyses it and automatically presents actionable information. This turnkey single-supplier solution includes Isoil battery-powered magflow meters, ATI remote battery-powered water quality sensors and FLP4 battery-powered smart loggers. Automatic meter reading (AMR), water balance/water loss and reservoir level management are typical applications of the WaMSS solution. Our on-site services include verification of flow meters, flow surveys, commissioning, maintenance contracts and flow logging.
Representative: JP Bosman
T: +27 (0)11 435 1080
E: jpb@NandZ.co.za
W: www.nz-online.co.za
Stand: 1 + 2

NERSA is a regulatory authority established as a juristic person in terms of section 3 of the National Energy Regulator Act, 2004 (Act No. 40 of 2004). NERSA’s mandate is to regulate the electricity, piped-gas and petroleum pipelines industries in terms of the Electricity Regulation Act, 2006 (Act No. 4 of 2006), Gas Act, 2001 (Act No. 48 of 2001) and Petroleum Pipelines Act, 2003 (Act No. 60 of 2003).
NERSA’s mandate is further derived from written government policies and regulations issued by the Minister of Electricity and Energy.
The Minister of Electricity and Energy appoints Members of the Energy Regulator, comprising Part-Time (Non-Executive) and Full-Time (Executive) Regulator Members, including the Chief Executive Officer (CEO). The Energy Regulator is supported by staff under the direction of the CEO.
Representative: Mmoni Suza
T: +27 (0)82 564 9567
E: Mmoni.suza@nersa.org.za
W: www.nersa.org.za Stand: 24

NuWater is a leader in rapid-delivery, technology-based water treatment plants, providing tailored solutions for sectors including Municipal, Mining, Food & Beverage, and Industrial. We treat groundwater, surface water, seawater, industrial, and effluent sources. Our modular systems allow fast deployment, easy relocation, and minimal downtime – ideal for changing conditions.
NuWater offers both Capital Purchase and Rental Fleet options. Rental clients benefit from flexible short- or long-term use with no upfront costs. Using cutting-edge technology and best-in-class equipment, we deliver treatment solutions including clarifiers, multimedia filtration, ultrafiltration, reverse osmosis, and desalination – scalable, efficient, and regulatory-compliant with reduced complexity and total lifecycle cost.
Representative: James Morisse
T: +27 (0)82 803 1010
E: james@nuwater.com
W: www.nuwater.com Stand: 39

Obscape delivers rugged, plug-and-play environmental monitoring solutions that provide real-time, high-quality data in the harshest conditions. Designed for autonomous, long-term deployment, all devices are solar-powered, wireless, and easy to set up - ideal for remote or hard-to-access locations. The product range includes Time-Lapse Cameras, Wave, Water Quality, Current, and Water Level Monitoring Solutions, plus Asset Tracking Devices. All data is logged to a secure cloud-based Data Portal, free to use with every device. With intuitive tools, remote configuration, and customizable alerts, data is always at your fingertips.
Need something unique? Obscape collaborates to develop custom solutions that meet your goals.
Representative: Bronwyn Goble
T: +27 (0)82 558 0515
E: bronwyn@obscape.com
W: www.obscape.com
Stand: 34

Orsco (Pty) Ltd, based in Gauteng, South Africa, is a leading provider of innovative pipeline diagnostics, utility location, leak detection, ground penetrating radar (GPR) surveys, and trenchless pipeline rehabilitation services across South Africa and internationally.
Backed by a skilled team of professionals, Orsco delivers tailored solutions for utility management, asset condition assessment, and pipeline rehabilitation. Utilizing the latest digital technologies, we ensure efficient, non-destructive detection and repair. Our comprehensive range of equipment – including leak detectors, utility locators, inspection cameras, and GPR systems –enables accurate pipeline and cable location, leak pinpointing, and reduced infrastructure disruption, improving productivity every time.
T: +27 (0)11 425 3379
E: gp@orsco.co.za
W: www.orsco.co.za
Stand: 13

Precision Meters, founded 20 years ago in Cape Town, is South Africa's leading provider of innovative water metering solutions. With SANAS-accredited Verification Laboratories and over 100 years of combined experience, our technical staff ensures each meter meets the highest standards, fully compliant with the Legal Metrology Act 2014. Our commitment to environmental sustainability and economic growth is reflected in our efforts to enhance local content and support local businesses.
With sales offices nationwide and the largest stock in South Africa, we guarantee swift service, providing detailed quotes within 48 hours and maintaining operations even during load shedding.
Representative: Lloyd Van Der Merwe
T: +27 (0)21 510 4266 | +27 (0)11 609 6336
E: cptsales@precisionmeters.co.za | jhbsales@precisionmeters.co.za
W: www.precisionmeters.co.za
Stand: 55 + 56

ROM H is a civil engineering company formed by Africans for the world, embodying engineering for the future. Our team of professional engineers, specialists, and project managers delivers sustainable consulting and management solutions across transportation, traffic, structural, urban, and water infrastructure.
With a proven record in South Africa’s engineering landscape, we pride ourselves on resilience, strong relationships, and expert resources that drive excellence and innovation.
Proudly a B-BBEE Level 1 Contributor.
T: +27 (0)10 035 1460
E: info@romh.co.za
W: www.romh.co.za
Stand: 22
The South African Institution of Civil Engineering (SAICE) is a learned society and voluntary organisation that acts as a catalyst for innovation and good practice in the development of the civil engineering profession. SAICE has a membership base of 15 000+ civil engineering professionals and is involved in the development of policies, standards, structures, and systems that impact infrastructure at national and international levels. It also promotes continuous professional development, supports educational initiatives, and fosters collaboration among industry stakeholders to advance sustainable engineering solutions.
Representative: Nthabeleng Lentsoane SAICE: Head of Marketing
T: +27 (0)11 805 5947
E: nthabeleng@saice.org.za
W: www.saice.org.za
Stand: 17

The South African Local Government Association (SALGA) is constitutionally mandated with the responsibility of local government oversight. Its primary role is the ongoing journey of transforming local government to be at the service of the people.
SALGA’s primary transformation role requires thought leadership that inspires others with innovative ideas for sustainable change through meaningful engagements and best practice. The success of local government is vital to achieve the development agenda as in the National Development Plan (NDP), Vision 2030.
Delivery of SALGA’s multi-faceted mandate would not be possible without stakeholders beyond those in its inter-governmental role.
Representative: Valerie Setshedi
T: +27 (0)12 369 8000
E: vsetshedi@salga.org.za
W: www.salga.org.za Stand: 35

SBS® Tanks has a proud history of over 25 years working with government, municipalities, and the commercial sector to deliver water and sanitation services to communities. The modular nature of SBS steel panel water storage tanks allows for easy delivery and installation on even the most remote site. SBS Tanks offers a range of over 500 tank sizes with capacities from 7000 litres to 4.2 million litres. They can be used in various configurations to achieve the required bulk storage capacity for water, process or effluent and are also suited for the storage of raw seawater as part of a desalination plant.
SBS Elevated Tanks assist with increased water pressure supply, our Engineered Solutions tanks provide extended storage and the SBS multi-tank solutions ensure continuous water supply to communities – even during maintenance.
Representative: Natasja Foster
T: +27 (0)31 716 1820
E: natasja@sbstanks.co.za
W: www.sbstanks.com Stand: 50

Sea pro SA has earned its reputation as the trusted and appointed distributor for the Cla-val Control valve Brand in South Africa and SADC region. Our dedicated team excels in providing comprehensive services including technical support, refurbishment and reliable supply of Cla-val products and spare parts.
With a focus on excellence Seapro SA specializes in cutting-edge solutions for water demand management systems, flow control, pressure control, pump control, and level control valves.
We pride ourselves on our unwavering commitment to delivering exceptional products and top-notch technical expertise to meet the diverse needs of our esteemed clients. Connect with Sea pro SA today.
Representative: Dean Stander
T: +27 (0)63 758 1198
E: dean@seaprosa.co.za
W: www.seaprosa.co.za Stand: 33

Sika South Africa, established in 1988, is the local subsidiary of the global Sika Group, a leader in specialty chemicals. Sika develops and produces systems and products for waterproofing, bonding, sealing, damping, reinforcing, and protecting in the building and motor vehicle industries. Sika's products are integral to modern living, used in bridges, dams, roads, high-rise buildings, cars, trucks, buses, boats, and industrial products. Renowned for quality and reliability, Sika offers a comprehensive portfolio of problem-solving products, fulfilling the highest standards and ensuring durability and sustainability in diverse applications.
Representative: Romaine Cloete
T: +27 (0)031792 6500
E: cloete.romaine @za.sika.com
W: https://zaf.sika.com/ Stand: 59

Established in 2015, Sinowatek specializes in valorizing waste streams using advanced technologies. We employ the Fournier Rotary Press® for sludge dewatering and ScaleBuster® for scale and corrosion treatment and prevention the powerful disinfectant Innowatech Anolyte® for water disinfection. Our services include designing, building, procuring, and integrating state-ofthe-art technologies to create tailored processes that enhance environmental and economic performance.
In the municipal sector, we focus on the dewatering of wastewater sludges and the dewatering of sludge produced during sedimentation of potable water. Sinowatek proudly represents Fournier Industries' Rotary Press® technology, the leading sludge dewatering solution from Canada.
Representative: Nico Erasmus
T: +27 (0)83 271 1808
E: nicoe@sinowatek.com
W: www.sinowatek.com Stand: 36

SMARTLOCK, founded in 2007, is a leading innovator in smart locking and access management solutions. We take pride in our unique solutions, utilizing our patented technology, know-how, and manufacturing facilities to offer unparalleled capabilities in the following markets:
• Utilities
• Wastewater & Sewage
• Electrical
• Water
• Pump Stations & Kiosk Lock-in
• Fibre
Our solutions allow for continuous monitoring of infrastructure, accurate asset management, and efficient access management. It is a real time, centralised monitoring platform, giving a geolocated overview of the entire network. Hourly trend data ensures proactive monitoring of active equipment environment.
The SMARTLOCK Solution supports real-time corelated alarm monitoring within the network, offering light, impact, temperature as well as humidity sensing. We are committed to developing and improving solutions to meet customer needs. We supply nationwide, as well as Africa and the international market.
Representative: JP Alkema
T: +27 (0)74 365 4481
E: jp.alkema@smartlock.net
W: www.smartlock.net
Stand: 44

For 75 years, SMEC has built a reputation as a trusted partner on major Transport, Water, Urban and Energy projects around the world. SMEC is committed to positively impact the people, the environment and the clients and communities we serve. As a member of the SJ Group and through our network of global specialists, our teams draw on deep expertise and systems thinking to simplify the complex and deliver integrated engineering solutions across a range of diverse environments. engineering positive change.
Representative: Kelly Lewis
T: +27 (0)73 557 9444
E: Kelly.lewis@smec.com
W: www.smec.com
Stand: 21

Stewarts & Lloyds Projects and Contracts (Pty) Ltd was established on 1st August 2022. A subsidiary of Stewarts & Lloyds Holdings, a 122-year established brand and a Level 2 B-BBEE company that is significantly changing the civil and construction projects industry across the nation.
We are a certified provider of high-quality branded engineering, civil, mining, water, gas, steel, building construction, hardware, and plumbing materials through a strategically positioned distribution network throughout the Republic of South Africa and other African nations.
We offer over 20,000 product lines and fuse strong relationships with technical skills and a deep kinship to our craft.
Representative: Michael Mlati
T: +27 (0)12 800 9400 or +27 (0)82 310 3407
E: Projects@sltrading.co.za
W: www.slpc.co.za
Stand: 8

CIRCOTANK, has developed a cost effective, aluzinc segmented tank with a liner for rural and industrial application. The tanks are easy to transport and quick to erect without cranes and can be mounted on stands. Liner replacement is possible thus resulting in ease of maintenance and longevity. Tank designs were analysed using state of the art Finite Element methods. Materials and joints were also thoroughly tested so as to bring a reliable and quality product to the market. Circotank is offered in a Maxi-range covering tank sizes of 100,000 litres up to 1,5 million litres and a Midi range covering a very user-friendly range of 5,000 – 20,000 litres.
PRESTANK, offers sectional water storage tanks that are hygienically safe, cost effective and a reliable way to store water for commercial sectors, private sectors and even for personalised storage. Pre-manufactured storage facilities can be provided for a vast variety of applications and range from 1,500 litres to 4,2 million litres. Choose from temporary or permanent installations. Prestanks are fully customisable, high quality water storage solutions that are manufactured according to SANS guidelines and meet South African Hot Dipped Galvanizing requirements. It facilitates easier handling and transportation over long distances to remote areas. Assembly on site is quickly achieved without the need for sophisticated tooling methods and requires minimum maintenance.
Representative: Godfrey Mpotu
T: +27 (0)16 362 9100 / +27 (0)79 035 6997
E: contracts@structatech.co.za
W: www.circotank.co.za / www.prestank.co.za
Stand: 45 + 46

Superior Filtration is an Original Equipment Manufacturer that designs, manufactures and supplies unique water filters for the industrial and municipal sectors.
Our History: Established in Johannesburg in 1984, we expanded internationally in 1985. Today, we operate out of the UK and South Africa, with successful installations in 35+ countries.
Our Approach: Our approach is different. We invest time and energy to understand the process – then we recommend a suitable filter.
This methodology ensures maximum benefit to our customers. With 40+ years of expertise in designing robust, low-maintenance, automated filters, Superior Filtration reduces risk, increases uptime and cuts lifetime costs.
Representative: Albert Bam
T: +27 (0)82 822 7715
E: albert@superior-filtration.com
W: www.superior-filtration.com Stand: 18

Tecroveer has established itself as a pioneering force in water treatment, committed to the vision of ensuring children can play in pristine water treatment and communities access safe water from the tap. We offer turnkey solutions, including design, engineering, and seamless integration with existing infrastructure.
Our services cover commissioning for optimal performance and long-term operations and maintenance for lasting reliability. Tecroveer also pioneers innovative waste-to-energy solutions, transforming waste into valuable resources. From concept to completion, we streamline every project phase.
Join us in our mission to protect water resources and build a cleaner, more sustainable future for generations to come.
Representative: Tamara Makeleni
T: +27 (0)11 752 1191 | +27 (0)73 215 0166
E: tamaras@tecroveer.co.za
W: www.tecroveer.co.za Stand: 30 + 31

Ultra Valves is a privately owned company with a wide range of Valve products for the Water, Sewage and Mining Industries.
With its extensive range of Automatic control valves, it has developed a reputation for High Tech solutions. Long experience in Water Hammer problems and all the products to go along with these solutions.
Some novel Control valve products which are “made for Africa” due to their Tamper Proof specifications and simplicity of use. Full range of commodity items such as Butterfly valves and RSV Gate valves. Service is our Motto.
Representative: Peter Telle
T: +27 (0)83 458 8053
E: peter@ultravalves.co.za
W: www.ultravalves.co.za
Stand: 9

uMngeni-uThukela Water (UUW) is one of South Africa’s largest water boards, strategically positioned to deliver bulk water services that support sustain communities, industries, and municipalities across KwaZulu-Natal.
Covering a service area of 94,359 km², UUW supplies water to more than 12.42 million people and 2.9 million households. Its customers include major metropolitan and district municipalities such as eThekwini, iLembe, Ugu, Harry Gwala, uMgungundlovu, Msunduzi, and Mhlathuze Local Municipality, as well as private bulk water suppliers like Siza Water.
The organisations services are supported by extensive infrastructure comprising 981 km of pipelines and 53 km of tunnels; 14 impoundments; 53 water treatment works; 1 effluent pump station; and 23 wastewater treatment works.
T: +27 (0)33 341 1111
E: Info@uuw.co.za
W: www.umngeni-uthukela.co.za Stand: 64 + 65

The Water Research Commission (WRC) is a leading South African institution dedicated to advancing knowledge, innovation, and solutions in the field of water. Established to support sustainable development, the WRC funds and manages research across the entire water cycle, including water resources, supply, use, treatment, and conservation. Its work plays a vital role in addressing national challenges such as water scarcity, climate change, pollution, and equitable access to clean water. By fostering collaboration between researchers, government, industry, and communities, the WRC ensures that evidence-based strategies and technologies are developed to strengthen water security and resilience. The Commission also places strong emphasis on capacity building and knowledge sharing, ensuring that its research not only informs policy but also empowers local stakeholders and contributes to long-term social and economic development.
T: +27 (0)12 761 9300
E: info@wrc.org.za
W: www.wrc.org.za
Stand: 5

At Zimile, we believe infrastructure is the foundation for opportunity, dignity, and human connection. Since 2009, we have delivered engineering solutions that build the nation and uplift its people. We are a proudly South African, 100% black-owned Level 1 B-BBEE firm with nearly 45% women representation.
Our multi-disciplinary services span transport, water, and property infrastructure, powered by innovation and digital tools. We blend experience with young talent, driven by mentorship and purpose.
Unbounded Engineering is our philosophy – pushing limits, breaking barriers, and creating inclusive, resilient solutions.
We are Zimile – where bold ideas meet practical solutions to shape a sustainable tomorrow.
Representative: Charmaine Achour
T: +27 (0)82 925 8500
E: charmaine@zimile.co.za
W: www.zimile.co.za Stand: 60-62


46 Paper 1: David Still
Paper 2: Prof JA du Plessis
Paper 3: Dr Kevin Wall
Paper 4: Dr.-Ing. Manuel Krauss &
47 Mkhuseli Nongogo
Paper 5: Giselle Pillay & Thembekile Mdiya
Paper 6: Mike Wiese &
48 Karen King
Paper 7: Chris Wilcock
Paper 8: Jan Palm & Chris Koch


49 Paper 9: Graeme Taylor
Paper 10: Bhavna Soni & Truman Hardon
Paper 11: Melanie Geyer
50 Paper 12: Phillip Majeke
Paper 13: Andria Munien & Noelene Rangasamy
Paper 14: Maria Dorothea Giliomee & 51 Ione Loots
Paper 15: Frankie A'Bear
Paper 16: Matt Braune & Munyaradzi Rupende
52 Paper 17: Ashiel Rampersad
Standby Paper: Dr Dinos Constantinides
David Still is a professional civil engineer specializing in the field of water supply and sanitation. He graduated from the University of Cape Town in 1984, later earning a GDE from Wits and an MSc from UCT.

After working for five years for the Department of Water Affairs and Forestry and three years for the CSIR’s Division of Water Technology, he founded the Pietermaritzburg based engineering and research consultancy Partners in Development, or PID, in 1993, which he still directs.
He has been involved with a number of WRC projects in the water supply and sanitation field either as reference group member, researcher or project leader. He has authored ten WRC research reports and 18 papers and coauthored several more.
He is a past Chairman of the Water Institute of Southern Africa’s Community Water Supply and Sanitation Division, KZN branch. He is the founder and chairman of the Duzi-uMngeni Conservation Trust (DUCT), which champions the environmental health of the uMsunduzi and uMngeni Rivers.
Stellenbosch University

Prof JA du Plessis has more than 38 years of experience in the field of water engineering in South Africa. He joins the University of Stellenbosch in 2003 and is presently a Professor in Hydrology and Environmental Engineering in the Civil Engineering Department. He specialized in water resource evaluations, flood hydrology and he provide institution support to various local authorities.
Kobus serves as a member of the Executive committee in the Board of the Institute of Municipal Engineers for Southern Africa (IMESA) where he is the Director for training and skills development. He also serves on the Education and Training committee of South African Institute of Civil Engineers (SAICE) and serves on the Editorial Panel of the SAICE Journal. He is a former Head of the Department of Civil Engineering at the University of Stellenbosch. He is a fellow member of both SAICE and an Honorary Fellow of IMESA and is a professional registered engineer with the Engineering Council of South Africa.
Qualifications: BEng (Civil), M Eng (Risk management of water resources) and PhD (Integrated water demand management in local governance).
University of Pretoria

Dr Kevin Wall (PhD (UCT), DEng (hc) (Pretoria)), a civil engineer and town planner, is an Extraordinary Professor at the University of Pretoria, a Fellow of IMESA and a Fellow of the South African Academy of Engineering. Until recently, he was also a non-executive board member of the City of Ekurhuleni’s wastewater treatment entity.
A Past President of The South African Institution of Civil Engineering (SAICE), he has received both the Gold Medal of SAICE and the Lifetime Award of the National Science and Technology Forum, the highest honour that can be bestowed by the science, engineering and technology community. In 2023 he received the degree Doctor of Engineering (honoris causa) from the University of Pretoria.
Much of his work over the last two decades has been on effectiveness of government spending on infrastructure, and ways to improve the quality, reliability and sustainability of that infrastructure. For example, he led the research for all four (2006 through 2022) of the SAICE Infrastructure Report Cards on the condition of infrastructure in South Africa.
Research Institute for Water Management and Climate Future at RWTH Aachen University

Dr.-Ing. Manuel Krauss is Head of Resource Efficiency and International Cooperation at the Research Institute for Water Management and Climate Future (FiW) at RWTH Aachen University, with more than 15 years of professional experience in the water sector. Before joining FiW, he led the Department of Urban Water Management and Urban Drainage at the University of Stuttgart’s Institute of Sanitary Engineering, Water Quality and Waste Management.
Since 2008, he has managed and coordinated a wide range of projects in Germany and internationally, covering drinking water treatment, sustainable water and land management, water reuse, industrial wastewater treatment, urban drainage, climate change adaptation, and disaster risk management.
Dr.-Ing. Manuel Krauß is a member of the DWA working group "Decentralized wastewater system solutions for emerging and developing countries". He is Head of the Regional Section Africa at German Water Partnership (GWP) and a member of the Board of the Institute for Water Research IWR at Rhodes University in South Africa.
Buffalo City Metropolitan Municipality

Mr Mkhuseli Nongogo is an accomplished civil engineering professional with over 25 years of experience, specialising in sanitation and municipal infrastructure management. He currently serves as the Acting Head of Directorate for Water and Sanitation Services at Buffalo City Metropolitan Municipality (BCMM) since July 2025, where he leads the planning, operation, and maintenance of the municipality’s water and sanitation infrastructure.
Since 2014, Mkhuseli has also held the role of Acting Senior Manager for the Sanitation Department at BCMM, overseeing the strategic planning and operational management of the municipal wastewater infrastructure network.
He holds a Bachelor of Science in Civil Engineering, a Master of Business Administration (MBA), and a National Higher Diploma in Civil Engineering, and is a registered Professional Engineering Technologist with the Engineering Council of South Africa (ECSA).
In his current role, he is driving innovative pilot projects in renewable energy for wastewater treatment, focusing on solar energy integration, sludge-tobiogas energy production, and effluent reuse initiatives. These projects are implemented in partnership with international stakeholders.

Thembekile is an experienced water services professional with more than two decades of expertise in water infrastructure planning, management, and service delivery. He is currently a Refurbishment Manager at the Amathole District Municipality, where he oversees upgrades to critical water infrastructure, manages grant-funded programmes, and drives initiatives that promote sustainable and efficient water use.
Since joining the municipality in 2008, Thembekile has played a leading role in implementing Water Information Management Systems to improve data accuracy and decision-making, as well as spearheading Water Conservation and Demand Management programmes that have strengthened the municipality’s sustainability efforts. His work has been instrumental in ensuring reliable water services for communities across the district.
Earlier in his career, Thembekile gained valuable technical and project management experience at Sektor Consulting Engineers, where he contributed to roads and water projects, and at Chris Hani District Municipality, where he was responsible for planning and developing water services plans that enhanced service delivery efficiency.
Thembekile holds a National Diploma in Civil Engineering from Border Technikon (now Walter Sisulu University) and a BTech in Civil Engineering from Nelson Mandela Metropolitan University. He completed his schooling at Zingisa Comprehensive High School.

Giselle is a civil engineer at JG Afrika specialising in water infrastructure. She holds a BScEng in Civil Engineering and an MScEng in Waste and Resource Management. Since joining JG Afrika in 2021, she has gained extensive experience in the planning, design, and management of water infrastructure projects across South Africa and abroad.
Her portfolio includes work on the Estcourt Industrial Pipeline, with a key highlight being the Amathole District Municipality Repairs and Refurbishments of Water Infrastructure Project, where she managed repairs to water treatment works and pump stations, led reporting, and coordinated interventions to restore functionality to critical water supply systems.
Giselle’s postgraduate research and training in waste and resource management have strengthened her focus on sustainability, particularly in water and sanitation. She has applied this expertise to preparing Integrated Waste Management Plans and contributing to research commissioned by the Bill and Melinda Gates Foundation. Her international experience includes projects for UNICEF and USAID, where she assessed water and sanitation conditions across several African countries.

Mike is a professional civil engineer at AECOM with 14 years of experience specialising in flood, stormwater, and drainage related projects. He holds a Master's degree in Water Engineering from the University of Stellenbosch and is currently pursuing a part-time PhD in flood hydrology at the same institution.
Mike's passion for advancing flood hydrological and hydraulic solutions is reflected in his extensive project experience across Africa, the Middle East, Australia, and Türkiye. His expertise covers a wide range of projects, from urban stormwater management and flood risk assessments to the design of complex flood mitigation strategies.
Beyond his professional work, Mike is a dedicated academic contributor, which includes lecturing at the Flood Hydrology short course at Stellenbosch University and contributing to the National Flood Studies Programme. He is commited to knowledge sharing and shaping the future of flood management in South Africa.
Mike's professional drive is balanced by a love for the outdoors, including running and mountain biking. He also enjoys being an "example of what not to do" for his kids.

Karen King is the Director of Climate Resilience at Atana, former RHDHV South Africa, and is based in Johannesburg. In 2004 she completed an MSc in hydrology at UKZN that focussed on scale and interactions between hydrological, geomorphological and sociological processes. Twenty years later she completed an MA at the University of Liverpool John Moores that focussed on scale and the roles of equity and local community involvement in common natural resource management.
Karen has featured in a number of publications including the Mail and Guardian, Engineering News, Skyways Magazine, Water and Sanitation Africa, Mining Weekly, Water SA, Environmental Management, African Mining, The Grid Ardenal, Business Day, Business Ghana and Africa Science News. She has also been interviewed by a number of news stations.
Karen has worked in the engineering consulting field in England and South Africa, focussing mostly on water-and soil-related projects across Africa.
In her spare time Karen rows and swims and is entertained by her four, large rescue dogs.
Jan Palm Consulting Engineers
Jan Palm has studied civil engineering at the University of Stellenbosch where he obtained his M. Eng. in Water and Waste Water Treatment in 1984.

His professional career started with SA Transport Services in Table Bay Harbour, then he joined GFJ Inc. in 1985, Entech Consultants in 1995 and in July 2003 he started a new company, Jan Palm Consulting Engineers, that specialises in solid waste management and that is known as JPCE (Pty) Ltd today.
After some 40 years as a consulting civil engineer Jan is still working full time on projects throughout Southern Africa covering the full spectrum of solid waste management from collection planning, waste diversion infrastructure, landfill design and rehabilitation, integrated waste management planning and alternative technologies.
He also is a guest-lecturer in solid waste management, as part of Environmental Engineering, at the University of Stellenbosch and has presented numerous papers at seminars and conferences.
Jan is a member of IMESA, fellow of SAICE, a fellow of WISA and a Senior Fellow and past president of IWMSA.

Chris started his working life as site surveyor and then site agent in civil engineering construction in the Eastern Cape. After 10 years on site he joined the then Queenstown Municipality’s Town Engineer’s Department as an engineering technician. Progressing through the ranks to Deputy Town Engineer, Chris completed his municipal career as the Section 57 Senior Manager of, among many other roles, infrastructure development. As manager of Lukhanji Projects, at what had become the Lukhanji Local Municipality, Chris implemented projects as diverse as low-cost housing, electrification, township services, water and waste water, roadworks, section 78s, financial turn-around plans as well as serving on the local and district municipality’s Bid Adjudication Committees.
Having left the public service, Chris joined a private water company as an Operations Manager and was instrumental in setting up a municipal water entity, MaP Water, in the Free State before moving to the WSSA Group’s head office in Johannesburg as the national Operations Manager and later as the Group Project Manager.
Having become interested in contract law and public procurement, Chris made a mid-career move into the legal field and now, having reached retirement age but not nearly ready to retire, serves as internal legal counsel to the group and heads their public sector tendering department. He is also active in several working groups which hope to improve public procurement in South Africa.

Chris Koch holds a National Diploma (1984) and a National Higher Diploma (1987) in Civil Engineering from Cape Technikon. He became a registered Professional Engineering Technician (Pr Techni Eng) in 2005. He has been a Professional Member of IMESA since 2001.
His professional journey began in 1988 when he was appointed Assistant and later Town Engineer for the Heilbron Municipality in the Free State, a position he held for nine years. He then served as a Project Manager for a construction firm in the Southern Cape, before returning to municipal engineering as Town Engineer for Swellendam Municipality. Chris later established Koch Siviele Dienste, where he was responsible for the design and construction of several small security villages the Southern Cape, as well as a timeshare development on the banks of the Breede River near Swellendam. He subsequently joined WEC Consult through the Development Bank of Southern Africa’s Siyenza Manje programme, as an Engineering Expert assisting Ceres Municipality.
He then took on the role of Deputy Director at the Western Cape Department of Local Government. Chris was seconded to Oudtshoorn Municipality under Section 139 administration, where he was later appointed Director: Technical Services, serving in that capacity for four years. He went on to hold the same role at Bergrivier Municipality, before assuming his current position as Director: Infrastructure at the West Coast District Municipality in 2021.
Tecroveer

Graeme John Taylor, Head of Engineering at Tecroveer for the past 11 years, is a seasoned mechanical engineer with over three decades of experience, much of which is in water and wastewater infrastructure. A graduate of the University of the Witwatersrand, Graeme has been at the forefront of designing and implementing innovative and sustainable solutions across South Africa and neighbouring countries.
Examples of his career highlights include the in-house; innovation and design of the Klipdrift/Hammanskraal Emergency Water Treatment Plant Upgrade (50MLD), development and delivery of the Eastern & Central Basin Acid Mine Drainage Treatment Plant high-rate gypsum thickeners, development and delivery of the Kelvin Jone (Uitenhage) WWTP multi-disc screw press sludge dewatering facility. These achievements reflect his passion and ability to solve complex challenges by combining innovation, efficiency, costeffectiveness, and community impact through an environment of teamwork and collaboration.
As the owner and principal engineer of EDOSA, he has delivered critical engineering services to major industrial and mining clients, including Anglo American, ArcelorMittal, Assmang, Grindrod, Group Five, Delkor, Andritz, and Specialized Handling & Engineering. He has also held senior executive roles at Specialized Handling & Engineering, Delkor, and GL&V.
eThekwini Municipality

Truman Hardon completed his matric in Inanda, Durban and obtained BSc Engineering (Civil) from the University of KwaZulu Natal. He spent the early years of his career in the Consulting Engineering business focusing on structural engineering, water engineering and project management and worked for various consultants namely Goba, Hatch and BPH Engineers.
He joined the eThekwini Water and Sanitation in 2017 and served in the Planning Branch as Professional Engineer and later Acting Senior Manager Planning for 3 years.
Afterwards he moved to Engen Refinery as Senior Manager for Maintenance and Facilities Services and held various senior positions and was promoted to Head of Engen Industrial Hub and a member of the Engen Management Committee. Engen Industrial Hub is a new business formed after the closure of the Engen Refinery.
In 2024 he re-joined the eThekwini Water and Sanitation as Water Design and Non- Revenue Water Branch.
eThekwini Municipality

Bhavna Soni matriculated in 1982 and obtained her BSc in Civil engineering in 1987 from South Gujarat University in India. She married a South African, thus settled here since 1990. She joined IMESA in 2008 and has been involved in the executive committee since 2016. She has served as IMESA president from 2020 to 2022 during the difficult COVID period.
Bhavna worked as a structural Engineer for few years with consultants and thereafter joined the municipality in 1997. She has worked in the Design department, where she has designed reservoirs and pipelines, thereafter planning department where her duties involved designing bulk water infrastructure for the eThekwini region. In 2005 Soni was promoted to Manager for rural systems.
Later in 2008 she was promoted to Senior Manager Water operations combining rural and urban areas. Soni also acted as Deputy Head in water and waste operation for two years, before appointed to her current position as a Deputy Head Engineering for EThekwini water & sanitation unit.
Currently she is responsible for the design and implementation of water and wastewater infrastructure as well as providing strategic direction to reduce non-revenue water within the EThekwini region.
George Municipality

Melanie Geyer earned her National Diploma in Civil Engineering in 2010 from Nelson Mandela Metropolitan University, followed by a BTech with a specialization in Water Engineering from the Central University of Technology, Free State, in 2011. In 2012, she began her career as a Project Manager at Nelson Mandela Bay Municipality, working within the Infrastructure and Engineering Directorate.
While working, she continued to expand her expertise and completed a Bachelor of Science Honours in Water Resources at the University of Pretoria in 2014. In May 2019, she achieved professional registration with the Engineering Council of South Africa.
In 2017, she was recognized as a top 3 finalist in the Nelson Mandela Bay: Bay Stars - Top Woman Achiever Awards. From August 2018 to February 2022, she served as Chairperson of the IMESA Eastern Cape branch, playing a key role in advancing the growth and development of municipal engineers in the region.
After ten years of service with the Nelson Mandela Bay Municipality, she advanced her career in March 2022 by joining the George Municipality as Manager of Infrastructure Planning, where she leads strategic infrastructure planning initiatives for the community.
Phillip Majeke is a Process Engineer with over 13 years’ experience in the water sector, currently serving as Commercialisation Manager at the Water Research Commission (WRC).

He holds a BEng in Chemical Engineering and a BEng Honours in Environmental Engineering from the University of Pretoria. Phillip plays a leading role in the award-winning SASTEP Programme at WRC, advancing innovative sanitation technologies.
He is part of WISA’s new Climate Change Committee and has a strong interest in climate smart water and sanitation solutions.

Andria is a Professional Civil Technologist and Certified Project Management Professional with over 11 years of experience in the water sector. She holds a Bachelor of Technology in Civil Engineering from the Durban University of Technology and is professionally registered with ECSA. Currently, she is pursuing her third professional certification as a Certified Water Efficiency Professional (CWEP). Once obtained, this will make her the first female in South Africa to be recognized with this distinguished triad of professional certifications.
Her career has been dedicated to advancing Water Conservation and Water Demand Management (WC/WDM) and tackling Non-Revenue Water (NRW) challenges. She is recognized for her proficiency in hydraulic system optimization, formulation of integrated water demand strategies, and the delivery of resilient civil infrastructure frameworks that drive long-term sustainability. Her expertise further extends to revenue enhancement, regulatory compliance, and stakeholder engagement, underpinned by advanced technological applications that enable the deciphering of consumption patterns, proactive leak detection, and effective demand management.
Ensync Engineers

Noelene Rangasamy is a highly skilled and professionally registered Civil Technologist and Project Manager, with nearly two decades of experience in the planning, design, management, and delivery of infrastructure projects. Her career began in 2006 at Umgeni Water as a graduate engineer, where she was entrusted with asset upgrades and refurbishments across several water treatment plants.
In 2011, she transitioned into consulting by joining Zutari (formerly Aurecon) as a Senior Design Technologist in the Land Infrastructure Department. Her work included responsibilities as lead designer, project manager, and contract supervisor, while also contributing significantly to asset management through the development of Infrastructure Development Plans for municipalities.
In 2020, Noelene achieved a significant milestone by obtaining professional registration as a Civil Technologist with the Engineering Council of South Africa (ECSA). She joined Escongweni BPH (Ensync Engineers) in 2021 as a Senior Civil Technologist in the Water Department.
Her commitment to professional growth was further reinforced in 2025 when she obtained Project Management Professional (PMP) certification from the Project Management Institute (PMI). She is also in the process of registering for her Master’s degree in Water and Sanitation, reflecting her dedication to advancing knowledge in this critical field. In addition to her professional roles, Noelene leads the Sanitation Portfolio within the IMESA Committee, contributing to sector-wide knowledge sharing and sustainable infrastructure development.
Thea Maria Dorothea Giliomee is a PhD candidate in Civil Engineering at the University of Pretoria, focusing on sustainable solutions for stormwater drainage.

She has conducted research on culvert capacity improvements and debris retention upstream of culverts to mitigate flooding. She is an assistant lecturer for Water Engineering modules at the University of Pretoria. Outside of engineering, Thea enjoys playing soccer, hockey, and jogging.
University of Pretoria
Ione Loots is a registered Professional Engineer with 18 years of experience specialising in water and stormwater projects.

She obtained her BEng (Civil) and MEng (Water Resources Engineering) degrees at the University of Pretoria and her PhD in Agricultural Engineering at the University of KwaZulu Natal.
She is currently employed at the University of Pretoria, where she teaches various undergraduate and postgraduate subjects, conducts research on the hydrology and hydraulics of urban flooding and is involved in various local and international consulting engineering projects.
A'Bear Consulting
Frankie is a civil engineer with over a decade of experience in water resilience, urban infrastructure, and climate adaptation across Africa.

Frankie has led projects in South Africa, Malawi, Central African Republic, and the UK. Recent highlights include managing the SUNCASA initiative in Johannesburg, which is developing a business case for river restoration and urban greening, and the RESTORE study in Malawi, aimed at improving the climate resilience of transport infrastructure. In Barrydale, Western Cape, she is implementing real-time water monitoring and allocation tools to support equitable water use across urban, agricultural, and ecological sectors.
Frankie holds an MSc in Water Engineering with Management from the University of Exeter, where she was awarded the Chevening Scholarship and multiple academic honours. She is a registered Professional Engineer with ECSA and an active member of SAICE.
Frankie now runs an independent practice that bridges engineering, policy, and implementation. Her systems-based approach ensures that solutions are technically sound and also grounded in local realities and stakeholder needs.
Bio Engineering Africa Consulting

Matt Braune is a professional Civil Engineer. He has over 40 years’ experience is all aspects of Municipal Engineering with a focus on stormwater management. He is the Founder and Director of Bio Engineering Africa Consulting (Pty) Ltd.
Matt is registered with ECSA as a Pr Eng as well as an official Mentor for Civil Engineers. He has done several research projects in conjunction with the Water Research Commission and the Stellenbosch university on flood and stormwater Management. The research included urban drainage modelling, river engineering Sustainable Urban Design Standards (SUDS) and GIS application.
He is currently involved with several local municipalities assisting with flood and stormwater problems caused by the changing climatic conditions.

Munyaradzi Rupende is a civil engineering professional with over 10 years of experience spanning consulting, construction, and municipal infrastructure development. He holds qualifications in both Operations Management and Civil Engineering, including a BTech from Nelson Mandela University.
Starting his career with Hatch in 2015 and later working in construction, he has been with BMK Consulting Engineers since 2017, where he has led and supported projects from inception to close-out. His expertise lies in stormwater management, municipal services, and asset management, with notable contributions to integrated stormwater master plans for the City of Johannesburg, stormwater channel rehabilitation projects, and the application of Sustainable Urban Drainage Systems (SUDS).
Munyaradzi is recognised for combining technical proficiency with practical project leadership, ensuring solutions that are both cost-effective and environmentally sustainable.

Ashiel Rampersad is a researcher at the Council for Scientific and Industrial Research (CSIR) within the Smart Mobility Cluster. He obtained a BSc in Civil Engineering from the University of KwaZulu-Natal and a BEng in Transportation Engineering from the University of Pretoria. His research focus is within the pavement engineering sector, and includes nonconventional materials analysis, sustainable construction practices, smart roads technology, investigating failed road sections and data analytics.
He has published at local and international peer-reviewed scientific conferences such as the Southern African Transport Conference (SATC), Conference on Asphalt Pavements in Southern Africa (CAPSA), Permanent International Association of Road Congresses (PIARC) as well as Book Chapters such as the Sustainability Handbook. He also serves on the SANRAL research panel and is a technical reviewer for SATC.
Some of his research includes investigating failed road sections locally in the Free State as well as in Malawi, investigating the use of alternative materials such as waste ash and plastic in road construction, as well as using high strength asphalt (EME technology) in road construction. He has over 10 years of research experience in the field of pavement engineering.
In his spare time, Ashiel enjoys hiking and appreciates the natural landscapes that South Africa has to offer.
Hydro-Comp Enterprises

Dr. Dinos Constantinides is the CEO of HydroComp, an Information Technology company that specialises in the implementation and support of its proprietary EDAMS Enterprise Utility management information systems.
Dr. Dinos obtained his BSc (Eng) (cum lauda) in 1978 and his PhD in water engineering in 1981 at the University of the Witwatersrand in South Africa. After working in construction for a brief period, he was employed at the Hydrological Research Unit and subsequently the Water Research Program as a senior research officer.
In 1987 he founded Hydro-Comp. The company at present has its headquarters in Cyprus and has offices in many countries including South Africa and the USA. The company has implemented a variety of Infrastructure Asset Management projects in 3 different continents in 5 different industries including Water and Sanitation, Electricity, Municipalities, Energy and Government.
Dr. Dinos is the author of three books and more than seventy publications in the field of Water Supply and Utility Management and is regarded as a world authority in the field.


Abstracts
54 Paper 1: David Still
Paper 2: Prof JA du Plessis
55 Paper 3: Dr Kevin Wall
Paper 4: Dr.-Ing. Manuel Krauss & Mkhuseli Nongogo
56 Paper 5: Giselle Pillay & Thembekile Mdiya
Paper 6: Mike Wiese & Karen King
57 Paper 7: Chris Wilcock
Paper 8: Jan Palm & Chris Koch
58 Paper 9: Graeme Taylor
Paper 10: Bhavna Soni & Truman Hardon
59 Paper 11: Melanie Geyer
Paper 12: Phillip Majeke
60 Paper 13: Andria Munien & Noelene Rangasamy
Paper 14: Maria Dorothea Giliomee & Ione Loots
61 Paper 15: Frankie A'Bear
Paper 16: Matt Braune & Munyaradzi Rupende
62 Paper 17: Ashiel Rampersad
Standby Paper: Dr Dinos Constantinides
65 Index to Papers

More than twenty years has passed since the restructuring of local government in South Africa and since the promulgation of the Free Basic Water Policy. While the percentage of South Africa’s rural population with access to a piped water supply increased from 44% in 1994 to 74% in 2022, according to census records the reliability of the supply is not good. Only 48.4% of the rural households with access to a piped water supply reported in 2011 that the supply was stable. In 2016 that number had improved marginally, to 51.7%. Due to problems with data quality Statistics SA has chosen not the publish the reliability data from Census 2022.
Meanwhile many of the District Municipalities responsible for rural water provision (the 21 Category C2 District Municipalities) have become progressively more cash strapped. An analysis of the audited annual financial statements for the 2021/2022 financial year for the 21 C2 Districts shows that the median ratio of service income to total income was 10%, the other 90% of their income being derived from grants from national government. The most useful indicator to determine a municipality’s financial health is its Operating Cash on Hand, which measures how many months the entity can continue operating without receiving any income. For the 21 C2 districts, the median Operating Cash on Hand in June 2022 was minus 4.2 months. In other words, they are using a significant portion of the current year’s income to pay the previous year’s debts. For many of the C2 municipalities this indicator has been trending steadily downwards over the past 10 years.
It is therefore timeous to step back and look at how water services are managed in South Africa, and whether the goal of piped water to all in the yard or home is achievable and sustainable. Nowhere is the challenge of meeting this goal harder than in South Africa’s rural areas, where settlements are small and dispersed over large areas, and where the greater part of the population have very low incomes.
The study of these twenty-one municipalities provides answers to the following questions:
• How have these municipalities fared?
• What lessons can be drawn from the experience of the last 20 years?
• Can water supply to rural settlements be financially self-sustaining?
• Are municipalities receiving sufficient operations grant funding to meet their responsibilities?
Key Presentation Impact Points:
1. The task of water services provision to rural areas comes with very signficant challenges
2. Most, but not all, C2 Districts are financially very stressed, with their finanical health trending downwards.
3. The C2 municipalities are to a large extent dependent on the Operations Grants which they receive from Treasury. There is a significant variation in the level of these grants, and yet financial health is not well correlated with the level of grants received.
4. Conditional Grant (MIG, WSIG) policy must be changed, with much less being spent on new works, and more being spent on maintenance, both proactive and reactive.

Prof JA du Plessis
The primary goal of this study was to evaluate the water pipe failure rate in a South African municipality as a case study to stress the need for proper maintance to ensure sustainability and to determine whether these failure rates aligned with acceptable norms. The study underscored the necessity of reliable data. A key observation was that linking pipe breaks to precise locations is essential for accurate analysis. About 83% of reported breaks investigated in this study could be geographically linked. To address this problem, it is recommended that case reports need to include coordinates for all pipe breaks, which can be easily captured using modern mobile devices. A literature review provided pipe break benchmark values based on pipe age, material, diameter, pressure, and seasonal variations. The study area included approximately 795,000km of pipelines and the analysis found that 36% of all pipes falls in the 90-125mm diameter range, with only 8% exceeded 450 mm. Additionally, 30% of the pipes were older than 45 years. Approximately 40% of all pipes operate within the 40–60m pressure range. The response time to failures revealed interesting statistics. In 50% of all cases, a team was dispatched within 4 hours, while 35% of repairs took over 15 hours to initiate. Once on-site, 70% of breaks were repaired within 6 hours. Breaks reported between midnight and 6:00 AM typically took 9 hours for a response, whereas those reported between 6:00 AM and 6:00 PM were attended to within 2 hours. However, repair durations remained consistent, with over 70% completed within 6 hours regardless of reporting time.
Older pipes, as expected, experienced more failures, with pipes over 46 years exhibiting a failure rate of 0.669 failures/km∙year, compared to 0.1 failures/km∙year for new pipes. The highest failure rates (0.789 failures/ km∙year) were observed in small-diameter pipes (90–125mm). The study found no correlation between pipe failures and rainfall or seasonal changes. GIS analysis did not reveal specific failure hotspots, though 11% of failures were classified as recurring within 60 days and 50m of a prior break – lower than the international average of 22–46%. Comparisons with international data indicated that the average failure rate of 0.45 failures/km∙year in the study area was higher than 89% of various globally benchmarks.
Key Presentation Impact Points:
1. Benchmark pipe failures
2. Pipe repair response times
3. Pipe failure report information
4. Pipe failure analysis challenges

Dr Kevin Wall
How sound are the municipal foundations laid in 1998, and why is this important to local service delivery?
Is it really understood how multi-layered and multi-dimensional a task it would be to improve the effectiveness of a dysfunctional municipality, and why the number of what Ministers periodically refer to as “dysfunctional municipalities” continues to climb?
The Constitution of 1996 states that the purpose of local government is inter-alia “to ensure the provision of services to communities in a sustainable manner”. Of the several steps that the government of the time took to put the Constitution’s intentions into effect, one of the most important was to commission the drafting of a White Paper on the form and function of local government.
This White Paper, which appeared in 1998, based its recommendations on a number of assumptions, many of which must even at the time have been questionable. For example that attracting skilled staff (presumably even to the most remote of municipalities) would not be a challenge, municipalities would be “able to cover the costs of service delivery”, users of municipal services would pay for them, and levels of trust would be high.
The proposed paper will examine each of the main assumptions in turn, and then make the point that for municipalities to perform the service delivery responsibilities in terms of the Constitution requires of them that they be “capable” – which, according to Treasury, “incorporates a wide range of factors”. That ALL these factors must be addressed – but are not – explains why, as Treasury states: “Many capacity building initiatives appear to not have materially impacted local government’s capability to deliver services and fulfil its mandate”.
Despite ample evidence of the shakiness of the 1998 assumptions, government has made no changes of significance to the basic structure shared by all municipalities. However it has recently noted that “Many of the challenges in municipalities arise from the design of our local government system”, and thus the President has promised “to develop an updated White Paper on Local Government to outline a modern and fit-for-purpose local government system”. (SONA, 6 February 2025.)
That this realisation has taken such a long time suggests government might still not understand where it went wrong in 1998 and thus what will now be required for functioning local service delivery throughout the country.
Key Presentation Impact Points:
1. The 1998 White Paper on Local Government made assumptions, many of which were questionable.
2. Despite ample evidence of this, and that making municipalities “capable” would be complex – and a recently-begun process to develop an improved White Paper – a fear is that government might still not understand what will be required for functioning local service delivery throughout the country.


Dr.-Ing. Manuel Krauss Mkhuseli Nongogo
Water Reuse and Energy Optimization at the East Bank WWTP in Buffalo City – Insights into the South African-German R&D-Project 'ecReUse'
The South African-German research and demonstration project ecReUse tests innovative technologies for water reuse and energy efficiency in South African wastewater treatment plants, using the East Bank Wastewater Treatment Plant in Buffalo City as a model. The project demonstrates how technical innovations can enhance water quality and energy sustainability, addressing environmental and economic challenges.
Within ecReUse, four key optimization measures have been implemented and demonstrated:
(1) Energy Optimization and Water Reuse – The project improves energy efficiency and produces high-quality water for agricultural and industrial reuse using Membrane Bioreactor (MBR) technology.
(2) Energy Optimization, Biogas, and Sludge Utilization – Primary sedimentation reduces energy demand in biological treatment, while sludge is processed in an anaerobic reactor to produce biogas, improving overall energy efficiency and sustainability.
(3) Quality Improvement and Agricultural Production – A continuous sand filtration unit enhances effluent quality. The resulting water is used in a hydroponic system to cultivate crops, reducing freshwater demand and promoting sustainable agriculture.
(4) Off-grid Operations Monitoring – A real-time camera-based monitoring system tracks effluent quality and quantity, enabling remote monitoring and efficient operation without the need for constant staff presence or grid connection.
Additionally, the pilot plants serve as training platforms for local professionals, strengthening the technical capabilities of engineers and technicians. This capacity-building is essential for ensuring long-term success. Through these solutions, ecReUse aims to provide a sustainable model for wastewater management in South Africa, promoting water reuse, energy efficiency, and circular economy principles. The project also serves as an example for other regions facing similar challenges, highlighting the role of technological innovation in global sustainability.
This presentation will focus on the overall project, with a particular emphasis on results and insights from implementing MBR technology and continuous sand filtration.
1. Innovative Technological Applications: Showcasing the practical application of Membrane Bioreactor (MBR) technology and continuous sand filtration to enhance water reuse and energy efficiency in wastewater treatment.
2. Solutions for Water Scarcity: Exploring how integrating water reuse, energy optimization, and agricultural and industrial applications can address water scarcity, fostering long-term resilience in water-stressed regions.


Giselle Pillay Thembekile Mdiya
The Coedmore Road Bridge will be one of the first of its kind in South Africa were the 3 span, twin-spine deck is monolithically connected to its piers and have double sets of concrete hinges at the abutments. The intention of the bridge is to be maintenance free by not having bearings and expansion joints. The bridge is streamlined and minimalistic in nature as it borders the Kenneth Stainbank Nature reserve, and blends into the green environment seamlessly. A new bridge structure which crosses over the Umhlatuzana river replaces the existing much smaller, undersized Coedmore Bridge that was washed away and damaged by the April 2022 floods in KZN. The project demonstrates how Municipal Engineers successfully undertaken the complex design parameters of the road layout and bridge and created a monolithic structure that would not be prone to buoyancy and have greater structural resilience in the future.
The bridge concept coupled with the specially tailored concrete for specific elements ensures sustainability outcomes are achieved and at the forefront of the project. The case study demonstrates the various complexities faced during construction such as heavy rains, large deck concrete volumes as well as guidance on concrete hinge construction for future projects. Concrete hinges are a very old technology that fell out of favour many decades ago, due to the time and effort needed to construct them on site. Coedmore Road Bridge aims to the lead way in bringing back these concrete mechanisms which eliminates the need for mechanical bearings. Various special measures were taken to integrate the concrete hinges with the bridge’s prestressing system, and substantially reduce the effects of concrete creep and shrinkage, which included temporarily supporting the structure and still allowing it to move. This ensured the unusual use of concrete hinges would not be pushed beyond comfortably safe limits. More broadly, the project emphasises how close coordination between the client, technical (design & construction) teams and contractor are critical to effectively managing the complex risks and challenges on such structures. The project provides a particular demonstration of how technical staff employed by the Municipality may be best placed to achieve this technical cooperation if competent design, management, and construction supervision capacity is available in-house.
Key Presentation Impact Points:
1. Twin-spine
2. Concrete hinges
3. Bearings and expansion joints
4. Sustainability
5. Monolithic
6. Structural resilience
7. Creep
8. Shrinkage


Mike Wiese
Karen King
Often, when flood studies are conducted, the main focus is on delineating the inundation area exposed to flooding and establishing flood levels. This information is important for legal requirements and for designing infrastructure to mitigate flooding. However, these studies have much more to offer and assist in making better informed and more sustainable decisions to manage flood risks. Instead of solely focusing on flood levels, the potential economic impact can also be understood, and this information can be used to plan better ways to protect communities and infrastructure.
This paper shares a real-world example from Prospecton, Durban, where different parties – from private sector (Toyota South Africa Motors - TSAM) to public sector (eThekwini Municipality) and even international partners (Dutch Disaster Risk Reduction and Surge programme) – collaborated to use flood analysis in a more sustainable manner. Initial flood studies conducted by AECOM between 2019 and 2023 helped everyone understand the complex flood dynamics and exposure factors in the region. Subsequently, Royal HaskoningDHV (RHDHV) partnered with the eThekwini Municipality in 2024 to undertake a detailed economic flood risk assessment. This progressive approach moved beyond simply identifying flood extents to quantifying potential damages and evaluating the financial viability of various mitigation interventions, aiming to optimise the overall flood mitigation strategy.
This example highlights the value of a continuous and adaptive methodology in flood studies. By building upon the initial flood level assessments to incorporate consequence analysis, a more holistic and sustainable understanding of flood risk emerges. This facilitates more informed decision-making regarding resource allocation for flood mitigation, leading to more resilient infrastructure and safer communities in the long term.
Finally, this paper will offer some practical steps and key considerations for municipal engineers and decision-makers who want to adopt this more sustainable approach to flood risk assessment within their own contexts. By embracing a flexible and ongoing methodology for flood studies, more effective and lasting solutions can be developed to protect towns and cities from the increasing threat of floods.
Key Presentation Impact Points:
1. Economic flood risk assessment
2. Flood management
3. Risk reduction
4. Flood studies

Chris Wilcock
Sustainable Engineering Solutions need an effective Public Procurement system - will the new Public Procurement Act have a positive effect on municipal procurement?
The blockages in the service delivery pipeline at municipal level are a cause for concern with ineffective procurement being blamed for at least part of the problem. It is hoped that the "new" Public Procurement Act, 28 of 2024, which will come into effect on a date to be proclaimed once the enabling regulations have been made by the Minister, will greatly assist in the unblocking of the pipeline.
There are a number of positive aspects of the Act, including the efforts to reduce the fragmentation of public procurement legislation, the promotion of technology in the procurement process, the renewed focus on developmental procurement, the efforts to improve the skills of procurement practitioners and the reduction in the time and money spent on disputes around the awarding of tenders.
Some of the aspects that have attracted criticism are the centralisation of power and the lack of focus on local government procurement which is large enough to justify special provisions.
There is a lack of capacity in public procurement, currently known as supply chain management (SCM) and procuring institutions struggle to attract and retain sufficient skills to implement effective and compliant procurement. This is particularly difficult in the built environment.
Another problem facing the procurement of infrastructure and specialist technical services is the tension which sometimes occurs between the technical departments and the procurement (SCM) practitioners. The Act, together with various initiatives within the industry, is striving to upskill and professionalise public procurement practitioners. This will help the credibility of procurement practitioners and improve the effectiveness of municipal procurement. Public procurement is a dynamic and complex field. There are less, but still, numerous bits of legislation directly and indirectly impacting on public procurement. There are potential uncertainties which are going to require court judgments to clarify.
The numerous challenges to tender awards, many of which end up in court, hamper service delivery. Significant time and money is spent to defend awards resulting in delays to the conclusion of the contracts and depletion of budgets. A Tribunal will be established to more speedily and cost-effectively resolve challenges and disputes. The challenges of procuring goods and services are many and will stretch the resources of even the highest capacity municipalities. These are not insurmountable problems but will take a lot of work, determination and cooperation to overcome.
1. Main implications of the public procurement act with particular focus on the local government sector with special emphasis on unblocking the service delivery pipeline
2. Procurement systems will need a major overhaul once the regulations have been published
3. Procurement practitioners will need training and support
4. Procurement practitioners need to be part of the strategic team and play an active role in bringing projects to project
5. The uncertainties will present challenges which will need effort and determination to overcome


Jan Palm
Chris Koch
The regionalisation of waste disposal is promoted by provincial and national government with the aim to close and rehabilitate all the small and often polluting local waste disposal sites in favour of larger properly designed waste disposal facilities in order to reduce potential pollution sources.
Article 84 of the Municipal Structures Act has given District Municipalities the function of establishing and operating waste disposal facilities for more than one local municipality in the district and to develop a waste disposal strategy for the district. The West Coast DM commissioned an investigation into the status of waste disposal in the district in 1996 and after the amalgamation of the municipalities in 2000 developed a Waste Disposal Strategy for the five local municipalities within the district. Due to the fact that none of the existing 20 waste disposal sites within the Cederberg and Matzikama municipal areas had any long term capacity and most were poorly located, not engineered to protect the environment and with limited operational control, the strategy recommended a new regional waste disposal facility to be done established to serve these two northernmost municipalities in the district.
After a number of potentially suitable locations were identified, full Environmental Impact Assessment processes were conducted, including public participation, and the preferred location received Environmental Authorisation and a Waste Management Licence in 2014.
The property was procured by the district and rezoned, again with the required public participation process. This was followed by the final design of the facility and eventually construction commenced in December 2023 and was completed in January 2025. The facility received its first waste in May 2025.
Regional waste disposal sites have on the one hand the economy of scale with regards to disposal costs resulting from an engineered basal lining system and proper operational resources, but on the other hand there is an increased cost of transporting waste to a remotely located waste site. Affordability is often questioned by the local municipalities, but when comparing apples with apples, regionalisation has proven to be more affordable than local, properly designed and operated waste disposal sites.
Then there is also the additional benefit of reducing the risk to the environment that is often overlooked.
Key Presentation Impact Points:
1. Regionalisation of waste management
2. Affordability
3. Environmental pollution

Graeme Taylor
Access to clean, safe drinking water remains a persistent challenge globally. Urbanisation, ageing infrastructure, source contamination, and climate variability are placing increasing pressure on water supply systems. In South Africa, these issues are compounded by failing wastewater treatment works, health crises, inadequate rural infrastructure, the so-called “water mafia,” and political instability.
This paper presents a study of the Hammanskraal Emergency Water Treatment Project, which addressed the crisis by delivering 60+Mℓ/day of potable water within 18 months of tender –15Mℓ/day became operational in just 9 months.
The study highlights key differences in project environment, collaboration, service focus, and innovation that enabled success despite obstacles including:
- Severely polluted Apies River source water, - A compromised Temba Water Treatment Plant unable to treat sewage-contaminated water, - A deadly cholera outbreak, - Water cartels exploiting the community and - Rising social and political unrest due to failed service delivery.
Despite this, the project was completed in record time, at reduced cost, using world-first South African technology developed and deployed during the project.
The paper outlines core findings and factors essential to its success:
1. Innovation in Network Design and Treatment Technology - The decision to switch source water to the Pienaars River and reverse network flow avoided the impractical upgrade of the Temba Plant, - A 15Mℓ/day modular treatment unit was developed in a purpose-built facility. Each unit integrates degritting, flocculation, dissolved air flotation, desilting, continuous filtration, and disinfection into a single compact system, with innovations in each stage enabling rapid, efficient deployment.
2. A typical Project Environment and Collaborative Focus - A key insight was the unique project environment – from national government to local community. This may be critical not only for water solutions but infrastructure projects more broadly.
The treatment unit supplier’s approach centred on three priorities: - Team: “If we agree and work together, there’s nothing we cannot do.”, - Service: Delivering clean water remained the non-negotiable goal, - Repeatable Technology: Innovation was designed for replication—resulting in modular units with a 1 to 15Mℓ/day range.
Conclusion : The Hammanskraal Emergency Water Treatment Project demonstrates what’s possible when collaboration, innovation, and service delivery take precedence over bureaucracy. Its integrated, scalable model offers a powerful blueprint for future infrastructure delivery across South Africa and beyond.
Key Presentation Impact Points:
1. Urgency and context
2. Speed and scale of delivery
3. Key technological innovation
4. Strategic network design
5. Project environment innovation
6. Scalable, repeatable model
7. Demonstrated south african capability


Bhavna Soni Truman Hardon
Considering South African economy and declining muncipal services, 8 leading metros plays a critical role in addressing the situation. In order to turn the situation around and attract correct investors National treasury realise that serious consideration needs to be given to turn the situation around.
Making the situation worse the climate change impact has aggrevated the matter. Thus The Presidency, National Treasury and the Department of Water and Sanitation are implementing sector reforms in the water and sanitation sector. The Metropolitan municipalities are the prime target for these reforms due to the magnitude of the crisis that the sector is experiencing and the high level of impact that this is causing on the economy, society and to the water and sanitation industry in South Africa as a whole.
Recent analysis of the key indicators in the metropolitan municpalties water & sanitation sector, depicts a picture of under investment for number of years. Mid year budget review in 2024 indicated that despite of providing increase in access to water and sanitation services, there is not enough investment in bulk services like waste water treatments and water treatment and maintenance in general. Thus, it is recognised that part of turning around municpal water business will require significant investment. It is clear that municpality alone wll not be able to meet the investment needs to have significant impact, while failure to provide a solution to the glaring challenges will collapse the economy of both the city and the country.
To address this challenge national government is working with the municpality to develop a long term sustainable solution in addressing the under investment.
To address this challenges, National government has come up with incentive grant, which requires Cities to develop turn around strategy that sets out clear goals with time bound targets and includes a practical way to develop the necessary capability to implement the strategy effectively.
This paper will show how eThekwini water & sanitation unit has developed their turn around strategy with the required road map and clear implementation plan that will be measured.
1. eThekwini water & sanitation current challenges will be discussed and how the detail turn around startegy was developed and the required road map and implementation plan.
2. This will be a great lesson for other municpalities, as once this proves to be successful it will be roll out through out the country for all muncipalities.

Melanie Geyer
South Africa produced 55 million tonnes of general waste in 2017, as noted in the 2018 State of Waste Report, with only 6.05 million tonnes diverted from landfill sites. Diverting organic waste from landfills is a critical focus of the National Waste Management Strategy, which emphasizes treating organic biodegradable materials such as sewage sludge. The 2020 National Waste Management Strategy outlines six key principles aimed at increasing landfill waste diversion rates to 45% by 2025, 55% by 2030, and 70% by 2035. Similarly, the Western Cape Integrated Waste Management Plan (2017) highlights the need to improve sewage sludge management within the province, targeting a diversion rate of 50% by 2022 and full diversion by 2027.
A study commissioned by DEDAT revealed that the Western Cape generated 295,000 tonnes of sewage sludge in 2016, with only 33% being beneficially utilized – 22% for land farming and 11% for composting or agricultural purposes. The Garden Route District contributed approximately 10% (28,400 tonnes), making it the third-largest contributor. The George Municipality recognizes the environmental and socioeconomic value of treating sewage sludge for beneficial use. In 2023, the Municipality produced 41 tonnes of dewatered sludge/day (15% dry solids), with projections indicating an increase of approximately 14 tonnes/day by 2033 at an annual growth rate of 3–3.3%. However, current practices by the Municipality involve stockpiling at wastewater treatment works, with no beneficial and environmentally acceptable take-off agreements.
As a turnaround strategy for its current sludge handling practices, the Municipality initiated an Expression of Interest for the beneficial utilisation of sludge, incorporating sustainable engineering practices aligned with national and provincial strategies and process to explore options for beneficial sludge treatment. To address this challenge, the Municipality initiated an Expression of Interest to explore sustainable sludge utilization options aligned with national and provincial strategies. This process advanced to a tender stage inviting financial proposals.
Following evaluations, the Municipality opted for a long-term agreement under the Municipal Finance Management Act (2003) Asset Transfer Regulations. By June 2025, it aims to finalize a partnership to establish a facility using solar drying technology to treat sewage sludge. This technology will achieve dry solids content of 65–95%, reduce pathogens and faecal coliforms, and produce A1a-classified sludge. This initiative enables the Municipality to comply with legislation while securing economically viable and sustainable agreements for its treated sludge, ensuring responsible management from production to final use.
Key Presentation Impact Points:
1. Beneficial treatment of sludge
2. Sustainable engineering practices
3. Alignment with national and provincial strategies

Phillip Majeke
South Africa’s municipalities face ongoing challenges such as water scarcity, inadequate infrastructure, and rapid urbanization, necessitating resilient and sustainable sanitation solutions. The Water Research Commission’s South African Sanitation Technology Enterprise Programme (SASTEP) serves as a model for integrating sustainable engineering principles into the planning, development and implementation of innovative sanitation systems, with great potential to transforming municipal service delivery.
SASTEP’s approach aligns with key sustainable engineering principles such as: resource efficiency, adaptability, environmental protection, and social equity. The programme has piloted innovative sanitation technologies, including low-flush systems, film-based container-based sanitation, NonSewered Sanitation (NSS) / Water Efficient Sanitation Systems (WESS), naturebased wastewater treatment systems and sludge beneficiation systems which demonstrate these principles. These solutions optimize water use, incorporate circular economy principles, reducing reliance on centralized systems and mitigates environmental impacts. For example, low-flush systems significantly decrease water demand, while NSS/WESS supports resource recovery and reuse as well as nutrient recycling.
One of the keys of SASTEP’s success lies in designing solutions to address local conditions, such as flood resilience in informal settlements and drought mitigation in water-scarce regions. This adaptability ensures that municipal sanitation systems are robust against climate impacts, aligning with principles of resilience and environmental stewardship. Circular economy models promoted by SASTEP integrate waste-to-resource approaches, turning sludge into fertilizer and other value add products from waste. These innovations align with broader sustainability goals, reducing dependency on finite resources and creating economic value. SASTEP also fosters inclusivity, engaging communities and building local capacity to ensure equitable access to sanitation services. Through SASTEP, eThekwini Municipality and City of Cape Town are piloting some of these innovations to provide climate resilient sanitation services. informal areas with potential roll out soon
Key Presentation Impact Points:
1. Challenges in municipal sanitation service delivery
2. Overview of SASTEP
3. Sustainable engineering principles
4. Key innovations within SASTEP
5. Flood and drought resilient case studies
6. Circular economy integration
7. Policy and regulatory alignment


Andria Munien Noelene Rangasamy
Umgungundlovu District Municipality (UMDM), like many water services authorities across South Africa, faces a dual crisis: high non-revenue water (NRW) levels and aging, hazardous asbestos cement (AC) infrastructure. These challenges not only threaten water security and service delivery but also strain municipal finances and erode public trust. In alignment with the IMESA 2025 theme of Sustainable Engineering Solutions, UMDM has embarked on a multi-faceted, technology-driven initiative that integrates smart metering, targeted AC pipeline replacement, and catalytic wastewater infrastructure development to address these urgent issues.
This project centres on three strategic pillars: (1) the phased replacement of AC pipelines across six local municipalities within UMDM to reduce physical water losses and mitigate health risks; (2) the deployment of ultrasonic smart meters – both domestic and bulk – to digitize water management, enable real-time monitoring, and enhance billing accuracy; and (3) the design and implementation of a new 2ML Wastewater Treatment Works (WWTW) in Mkhambathini Local Municipality (Camperdown), which will serve as a growth enabler and revenue catalyst for the region. At the forefront of this initiative is a pilot project currently underway in Howick, focused on smart meter deployment and AC pipeline replacement. This pilot is testing key technologies and implementation methodologies to inform a districtwide roll-out strategy. It provides valuable insights into field deployment logistics, meter accuracy, remote data acquisition, and integration with existing utility systems. Smart meters are not merely a metering upgrade – they are the cornerstone of a digital utility transformation. By enabling remote readings, early leak detection, and usage profiling, these devices address both apparent and real losses in NRW. AC pipeline replacements complement this by tackling systemic physical losses caused by deteriorating infrastructure. Together, these interventions are supported by robust meter data management systems (MDMS), customer portals, and analytics engines that turn raw data into actionable intelligence. The inclusion of the WWTW in Camperdown – a strategic growth node – ensures long-term sustainability through wastewater recycling potential and tariff recovery for sanitation services. The combined initiative fosters operational efficiency, financial resilience, and environmental responsibility. This integrated approach serves as a blueprint for other municipalities seeking to transition from reactive service provision to data-driven water governance. It demonstrates that engineering solutions, when strategically aligned, can enable a municipality not only to reduce NRW but to transform it into a driver of sustainability, service excellence, and revenue growth.
Key Presentation Impact Points:
Problem Statement, Sustainable Solution Components, Innovation and Technology Integration, Revenue & Efficiency Impact, Address and Reducing Non Revenue Water, Strategic Alignment, and Scalability.


Dorothea Giliomee Ione Loots
Culverts play an important role in the stormwater drainage system and transport infrastructure of a country. They are designed to convey a specific flow capacity beneath roads, highways, or through embankments. However, culverts can become insufficient over time due to increasing flood peaks. Flood peaks for rarer events have already increased across many parts of the world due to climate change. Additionally, continuing urbanisation increases runoff volume by expanding impermeable surfaces. Therefore, during flood events, inadequate drainage can lead to infrastructure damage, inconvenience for road users and potential loss of life. Culverts are also often assumed to have greater capacity than they actually do. When the river channel is wider than the culvert barrel, the momentum of water entering a square-edge inlet culvert creates a flow contraction, or vena contracta, just after the inlet. At the vena contracta, the flow area is at a minimum, reducing discharge capacity. Modifying the culvert inlet to provide a more gradual transition can increase capacity and negate the need to rebuild the entire structure, offering a cost-effective solution with minimal traffic disruption. This study used physical and numerical modelling to evaluate inlet modifications for box and circular culverts under inlet control. Modifications included changes to wingwall angles, top- and side-tapered inlet angles, rounded edge inlets, and variations in slope. When combined, side- and top-taper angles significantly improved discharge. For box culverts, a 15º top-taper with a 30º side-taper increased flow capacity by up to 34% at a headwater depth of twice the culvert height (2D). This square-shaped taper had less influence on circular culverts. However, rounded edges that smoothly guide water into the circular barrel improved flow by up to 34% at a headwater depth of 2D. Improvement coefficients are proposed for use with the existing equations in the SANRAL Drainage Manual to calculate improved culvert capacity. These coefficients would help engineers and road authorities evaluate capacity improvements for upgrades or new designs. Inlet modifications offer a sustainable solution for adapting to increased flood risks caused by climate change and urbanisation.
1. Flood peaks for rarer flood events increase due to climate change and urbanisation.
2. The optimal culvert inlet modifications can increase the culvert capacity to such an extent that it can negate the need to upgrade the entire inadequate culvert structure.
3. Improvement coefficients can help in designing and upgrading culverts with inlet modifications.
4. Inlet modifications offer a sustainable solution for adapting to increased flood risks.

Frankie A'Bear
Led by the Grootvadersbosch Conservancy and funded by the Nedbank Green Fund in partnership with WWF, the Barrydale Water System project is a collaborative initiative designed to enhance water security, operational efficiency, and long-term resilience in the small town of Barrydale, located in the Swellendam Municipality, Western Cape. Barrydale is representative of many South African towns that face the dual challenge of ageing infrastructure and limited technical capacity to manage increasingly variable water supply and demand conditions. The project aims to address these constraints through a multi-stakeholder process that integrates community knowledge, municipal operations, and technical innovation. At the centre of the intervention was developing and implementing a locally appropriate water monitoring system.
This system was designed to generate near real-time data on river and diversion structure water levels and flows, and estimated usage across the town’s water network. The solution leverages low-cost sensors, remote telemetry, and a user-friendly dashboard that allows municipal staff to make timely, informed decisions regarding water distribution and allocation. The system was co-developed with input from Swellendam Municipality, ensuring its usability and sustainability beyond the life of the project. A key strength of the Barrydale project was its inclusive approach to stakeholder engagement. The project team worked closely with local government, civil society, and residents through structured workshops and one-on-one engagements. This process helped build trust, uncover operational bottlenecks, and prioritise context-specific interventions.
By embedding real-time data collection into the town’s operations, the Barrydale Water Monitoring System offers a replicable model for data-driven water management in small towns across South Africa. The project is set to demonstrate that targeted technical support, when paired with meaningful stakeholder participation, can unlock institutional momentum and generate practical solutions for long-standing service delivery challenges. The outcomes contribute not only to improved system functionality but also to a growing evidence base
Key Presentation Impact Points:
1. Locally relevant solution: Addresses infrastructure and capacity constraints typical of small South African towns like Barrydale.
2. Real-time data for better decisions: Enables evidence-based water distribution and system management through low-cost monitoring tools.
3. Stakeholder co-design: Built with input from municipal staff and community members, ensuring long-term usability and ownership.
4. Catalyst for further investment: Pilot success attracted additional funding, demonstrating scalability and practical impact.
5. Replicable model for rural towns: Provides a tested, cost-effective approach to water monitoring that can be adapted for similar contexts.


Matt Braune Munyaradzi Rupende
The current urban environment is rapidly changing due to more highdensity developments within municipal areas. Additional climatic changes and sporadic, more intense storm events have caused wide spread flooding, damage to property and loss of life both locally and internationally. Combined with financial constraints increases the pressure on municipalities to be more proactive in both preventing and improving stormwater drainage systems to become more resilient to climatic changes.
Several urban Flood management and stormwater Master Plans have been completed for various municipalities over the past few years. The studies involved the hydraulic as well as condition assessment of existing urban drainage systems consisting of box culverts, pipe culverts, kerb inlets and Grid inlets. On completion of the existing hydraulic and condition assessment, hydrological models were set up to determine required design flows. Based on the design flows in comparison to the hydraulic capacity. Stormwater upgrading measures were determined and designed. Due to budget constraints upgrading measures needed to be prioritised and phased budget programs set up. One of the main findings was that the several underground drainage networks are under capacity mainly because of higher expected peak flows due to Climate change.
More importantly is was found that kerb inlets and inlet structures are ot the wrong type and often incorrectly sized to drain the excess stormwater from roads thereby already causing flooding. A further observation was that a large percentage of stormwater control structures are either blocked or damaged thereby aggravating the situation.
This paper presents findings of the Master Plan studies and gives guidance on how better to manage and be more resilient regarding stormwater management considering climatic changes by setting up proactive maintenance schedules as well as prioritisation algorithms for forward planning of required upgrading measures.
Key Presentation Impact Points:
1. Climate change impacts on Municipalities
2. Proactive maintenance
3. Proactive and prioritised upgrading measures and examples
4. Improved resilience to cater for more intense and sporadic storm events

Ashiel Rampersad
"Municipalities are failing to balance investment in new infrastructure with sound operation and maintenance of existing infrastructure to ensure sustainable service delivery. Inadequate infrastructure maintenance undermines service delivery and contributes to increased backlogs” (MISA Strategic Plan 2020-25). The SAICE Infrastructure Report Card (2022) rated municipal paved roads as "D-", and unpaved municipal roads as "E".
One finding of the report states that prioritization of road expenditure is occurring within all the provinces and authorities but, although guidance is given in the TMH 22, there is currently no uniformity in how these maintenance schedules are set, leading to significant differences in approach. The report also states that the gravel road network is too extensive and the budgets too constrained for the entire network to be kept in a satisfactory condition. The consequences of the widespread underfunding of road condition maintenance and improvement are seldom assessed by roads authorities. Research (Sabita, nd) states that delaying road maintenance is a false economy, as the longer such maintenance is left undone, the higher the eventual cost to restore the road to an acceptable condition. Sustainable cost management is critical for long term viability. Road repair delays exacerbate road user costs, often surpassing repair costs. Prompt corrective measures are therefore recommended to minimize losses for all parties involved (Trestanto et al., 2024). Repair costs are 6 times higher on poor condition roads, and 18 times higher on very poor roads (SANRAL, 2014).
This paper presents findings and a way forward in the following sections, to access the readiness of municipalities to address an ageing and deteriorating road network:
Section 1: The impact, cost and sustainability of delaying road maintenance at a local level.
Section 2: Critical review and limitations of road asset management plans as per municipal IDPs.
Section 3: Review and correlation of expenditure on road maintenance per network and condition.
Section 4: International best practices and models for road maintenance prioritization at a local level.
Section 5: Way forward and recommendations.
Key Presentation Impact Points:
1. A background would be provided why prompt maintenance is critical, with road repair costs being 6 times higher on poors condition roads, and 18 times higher on very poor roads.
2. An overview of questions and answers posed at a local level (selected), per IDPs, including: How are pavement assets managed, what processes are utilized to capture pavement data, and how are maintenance projects prioritized?
3. A critical review of local expenditure, road conditions and best international practices for maintenance, as well as a way forward for local municipalities.

Dinos Constantinides
Water and Sanitation Service Providers are faced with many challenges including the aging infrastructure often resulting in crisis and service interruptions, inaccurate data and inappropriate asset registers, high non-revenue water (both in terms of leakage and commercial losses), higher customer expectations in terms of services as well as water quality information and low productivity mainly because of inefficient processes and systems.
The best way to face these challenges is the introduction of best practices in integrated asset management (ΙΑΜ), where IAM can be best defined as: “An integrated approach to monitoring, operating, maintaining, upgrading, and disposing of assets cost-effectively, while maintaining a desired level of service and is intended for improving the overall business performance.”
Although well defined, it is easier said than done. Traditional vendors are very product and services focussed and, in most cases, grossly underestimate the amount of business processes that occur within a Utility, their importance and the required interaction between them. In fact, to exercise proper IAM all the departments of the organisation must be involved and interact in between them. This oftens leaves service providers stranded with many disjointed products and services addressing pieces of the puzzle but rarely putting the puzzle together.
This paper looks at available technology, best-practices, and a practical approach, applied within the ISO 55000 Standards framework, towards building capacity for IAM. Main functions are well defined and most importantly their interaction and importance in addressing challenges is highlighted and explained.
The process of implementation and the results from a relevant case study in a large municipality are also presented.
Key Presentation Impact Points:
1. Infrastructure asset management
2. Municipal challenges
3. Best practices


www.imesa.org.za


IMIESA , weekly newsletters , social media posts and www.imesa.org are the platforms used by your target audience
TO ADVERTISE
Joanne Lawrie
c +27 (0)82 346 5338
e joanne@infraprojects.co.za
TO SUBSCRIBE
e info@infraprojects.co.za


Under the leadership of CE, Ofentse Nthutang, and subsequent to extending its footprint in the new areas of operation with the addition of the Far and South West Regions, Magalies Water has dedicated time and energy to ensure the new regions are adequately serviced and its population enjoys the benefits of clean drinking water, like in all the areas where it has been operating before.
The proclamation of the disestablishment and eventually the integration of the operations of the former Sedibeng Water into Magalies Water has resulted in the extension of the services of Magalies Water into Ngaka Modiri Molema, Dr Ruth Segomotsi Mompati and parts of Dr Kenneth Kaunda District Municipalities in North West province.
The new organisation did not sit on its laurels or spend time scanning the environment for long but jumped straight into action with a few projects that were handed over before their completion.
The disestablishment of Sedibeng Water meant Magalies Water had to take over the responsibility of making sure to complete projects in various areas and local municipalities in Ngaka Modiri Molema. Some of the projects were already at an
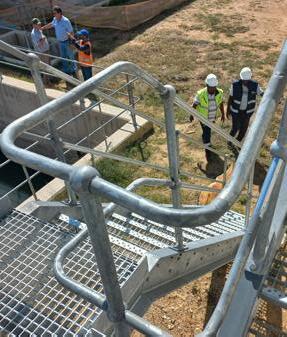
advanced stage, some had already experienced delays due to different factors, while others were started from the ground to be where they currently are.
This project was implemented in 2023 under the Operation Bulela Metsi in Dinokana, Ramotshere Moiloa Local Municipality, which falls under Ngaka Modiri Molema District Municipality in North West province. The Dinokana project was ushered in and reprioritised as part of the intergovernmental interventions led by the then Minister of Water and Sanitation Senzo Mchunu and the North West government.

Ofentse Nthutang, CE, Magalies Water
and planning of the augmentation of bulk water supply to the City of Mahikeng and its peri-urban villages within the Mahikeng Local Municipality, found in the Ngaka Modiri Molema District Municipality in North West province.
The project scope entails the refurbishment and upgrade of the Dinokana rural water supply infrastructure, which includes high lift pump refurbishment and an upgrade from 2 Mℓ/day to 4 Mℓ/day; refurbishment of boreholes; upgrading of the spring water pump station and pipeline; refurbishment of the distribution system up to the bulk water reservoirs, and constructing an additional 2 Mℓ reservoir to provide additional gravity pressure.
The Dinokana Water Supply Intervention project is being implemented in four phases including:
• Phase 1 – Bulk pipeline distribution construction, including reservoir and refurbishment to existing transmission lines.
• Phase 2 – Refurbishment of boreholes and additional drilling and equipping of boreholes.
• Phase 3 – Reticulation and standpipe at 200 m radial distance within the village boundary.
• Phase 4 – Upgrading the pump station and pumping line to allow both reservoirs to be fed by the pump station. The objective is to provide an additional 35 000 residents with standpipes.
Having conducted and covered all the necessary stages of implementation, the project is currently at an almost closeout stage, wherein a formal handover will be conducted.
The saying “out of strife always comes growth” aptly fits into the conceptualisation
The objective of the Mmabatho Water Treatment Works Project is to increase the capacity of the water treatment works and to improve the bulk water distribution to the region. Being the capital of North West province Mahikeng has, like many urban areas of South Africa, experienced an ever-growing population due to migration of people from other areas who are driven by a need to seek a better life and opportunities. Being a mixed settlement that consist of both the urban and peri-urban villages, Mahikeng has consistently been characterised by significant backlogs in water supply and sanitation, as evidenced by the results of the Census 2011, just before the project was conceptualised.
The augmentation work involved upgrading the existing 20 Mℓ/d Mmabatho WTW to a 30 Mℓ/d plant in order to address the water balance in a local municipality that supplies a population of nearly 300 000 people, residing in 102 villages, as well as the city’s suburbs.
Key to the successful implementation of our projects at Magalies Water has always been good cooperation, engagement and relations with all the stakeholders, such as the local municipalities, the Water Service Authorities involved as beneficiaries of the project, local traditional leadership when the project is in their area of jurisdiction, sourcing local labour, material and involvement of the local business.

David Still*, Kathy Eales**, Jim Gibson**, Silindile Jula*** *Partners in Development (Pty) Ltd, **Independent researcher, ***University of KwaZulu-Natal
ABSTRACT
More than twenty years has passed since the restructuring of local government in South Africa and since the promulgation of the Free Basic Water Policy. While the percentage of South Africa’s rural population with access to a piped water supply increased from 44% in 1994 to 74% in 2022, according to census records the reliability of the supply is not good. Only 48.4% of the rural households with access to a piped water supply reported in 2011 that the supply was stable. In 2016 that number had improved marginally, to 51.7%. Due to problems with data quality Statistics SA has chosen not the publish the reliability data from Census 2022. Meanwhile many of the District Municipalities responsible for rural water provision (the 21 Category C2 District Municipalities) have become progressively more cash strapped. An analysis of the audited annual financial statements for the 2021/2022 financial year for the 21 C2 Districts shows that the median ratio of service income to total income was 10%, the other 90% of their income being derived from grants from national government. The most useful indicator to determine a municipality’s financial health is its Operating Cash on Hand, which measures how many months the entity can continue operating without receiving any income. For the 21 C2 districts, the median Operating Cash on Hand in June 2022 was minus 4.7 months. In other words, they are using a significant portion of the current year’s income to pay the previous year’s debts. For many of the C2 municipalities this indicator has been trending steadily downwards over the past 10 years.
It is therefore timeous to step back and look at how water services are managed in South Africa, and whether the goal of piped water to all in the yard or home is achievable and sustainable. Nowhere is the challenge of meeting this goal harder than in South Africa’s rural areas, where settlements are small and dispersed over large areas, and where the greater part of the population have very low incomes.
The study of these twenty-one municipalities provides answers to the following questions:
• How have these municipalities fared?
• What lessons can be drawn from the experience of the last 20 years?
• Can water supply to rural settlements be financially self-sustaining?
• Are municipalities receiving sufficient operations grant funding to meet their responsibilities?
1.
When Nelson Mandela was elected president of South Africa in 1994 as the leader of the African National Congress, one of his new government’s priorities was to provide access to an improved water supply to all citizens of the country. At the time 70.4% of South Africa’s 21.6 million people who lived in towns and cities did have a piped water supply, but of the 15.8 million people living in South Africa’s rural areas only 44.4% had access to piped water within 200 metres of the home (see Figure 1)1. Since 1994 more and more piped water
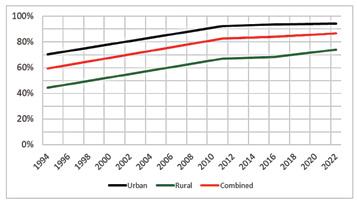
FIGURE 1: The percentage of the population served with piped water within 200 metres of the home (Department of Water and Sanitation, Water Services Knowledge System)
schemes have been built in rural areas, so that by 2022 the Department of Water and Sanitation estimated that 74% of the rural population had a piped water supply.
Nowhere is the challenge of meeting the goal of piped water for all harder than in South Africa’s rural areas, where settlements are small and dispersed over large areas, and where the greater part of the population have very low incomes. This study accordingly focuses on the 21 Category C2 district municipalities which jointly account for 65% of South Africa’s rural population, and which have no function other than the supply of water and sanitation services.
There are 257 municipalities in South Africa, comprising: Category A, eight metropolitan municipalities; Category B, 205 local municipalities; and Category C, 44 district municipalities. Of those 257 municipalities, 144 are designated as Water Services Authorities (WSAs), which means they are responsible for the provision of water and sanitation services to the people resident within their boundaries. Twenty one of the 144 WSAs are District Municipalities, and these are called C2 District Municipalities. Five of those are in the Eastern Cape: Amathole; Chris Hani; Joes Gqabi; OR Tambo; and Alfred Nzo. Ten are in KwaZulu-Natal: Ugu; uMgungundlovu; uThukela; uMzinyathi; Amajuba; Zululand; uMkhanyakude; King Cetshwayo; iLembe; and Harry Gwala. Four are in Limpopo: Mopani; Vhembe; Capricorn; and Sekhukhune. And two are in the North West: Ngaka Modiri Molema; and Dr Ruth Segomotsi. The C2 district municipalities cover large areas incorporating small towns, farms and rural villages. The largest of these districts is Dr Ruth Sekomotsi in the North West Province, which spans 43 753 km2 , and the smallest is Ilembe in KwaZulu-Natal with an area of 3 270 km2. The median area for a C2 district is 13 527 km2 and the average area is 16 269 km2. By way of comparison, the
1 All data quoted in this paper is sourced from government databases and records –see the references at the end.
Johannesburg Metropolitan Municiaplity has an area of 1 645 km2, and the eThekwini Metropolitan Municipality has an area of 2 556 km2. Managing water and sanitation services over such large areas poses a significant management and logistical challenge.
In 2022, according to Statistics South Africa’s Census, the combined population of the twenty-one C2 district municipalities was 17 390 011, 28% of South Africa’s total population. Within the boundaries of those twenty-one municipalities live 65% of South Africa’s rural population. The populations of the C2 districts vary considerably, with the Vhembe District in the Limpopo Province having the largest population at 1 653 077 people, according to Statistics SA’s 2022 Census. The district with the smallest population is Amajuba in KwaZulu-Natal, which serves just 179 698 people, according to Census 2022. The median population served for the C2 districts in 2022 was 782 661, and the average served was 828 096.2
Some of the C2 districts are more rural than others. Joe Gqabi in the Eastern Cape and Ilembe in KwaZulu-Natal have more than a third of their populations living in towns, while less than 5% of the population of the uMkhanyakude District in KwaZulu-Natal and the Sekhukune District in Limpopo live in towns. It is advantageous to have some mid-size towns in or adjacent to the district, as that makes it easier to hire and retain skilled staff. It also makes it more likely that the district will have some income from services. As a general rule, people who live on freehold land in towns are more likely to pay for services, whereas those who live on communal land in rural areas generally do not pay for services.
The C2 municipalities were only established in 2001, after the restructuring of local government in South Africa and the first round of the new local government elections. There then followed a period of several years while the responsibility for service provision, and the capacity to do that provision, was sorted out between the various municipalities and other role players in South Africa (including water boards and the then equivalent of the Department of Water and Sanitation). It was therefore generally not before 2006 or 2007, and sometimes not until 2010, before the various bodies had settled into their new responsibilities. The 2011 Census carried out by Statistics South Africa is, therefore, the first baseline from which progress in service delivery at municipal level can be measured.
The internationally recognised standard for access to water supply, used by the World Health Organisation and UNICEF’s Joint Monitoring Programme (JMP)3, is the presence of a working tap or a handpump within 200 metres. That is called the JMP definition for water supply access. In 2011, a median of 65.9% of the households served by the C2 Districts had access to water, on that standard4. By 2022, the median share with access to water had increased to 73.8%. Note that the population increased between 2011 and 2022, with the number of households in the C2 districts increasing from 3.6 million to 4.1 million. The number of households served by the C2
2 Note that there are four C2 districts whose area of responsibility (and hence population served) excludes the main town within their boundary. These are:
• uMgungundlovu in KwaZulu-Natal, which does not include the Msunduzi LM (Pietermaritzburg)
• Amajuba in KwaZulu-Natal, which does not include the Newcastle LM
• King Cetshwayo in KwaZulu-Natal, which does not include the Mhlatuze LM (Empangeni and Richards Bay)
• Capricorn in Limpopo Province, which does not include the Polokwane LM
The Buffalo City Metro in the Eastern Cape (East London) falls outside the boundaries of the Amathole DM.
districts increased from 2.4 million in 2011 to 3.3 in 2022 million, an increase of 0.9 million households.
Progress has not been evenly distributed between the twenty-one districts. For example, while the Zululand District in KwaZulu-Natal increased coverage from 62.4% in 2011 to 73.8% in 2022, the Mopani District in Limpopo presided over a decrease in the percentage coverage, from 69.8% in 2011 to 67.5% in 2022.
For the C2 districts, the increase in access to basic sanitation between 2011 and 2022 has been more significant. The Joint Monitoring Project defines access to sanitation as having at least an improved pit latrine, which is not shared with other families. Between 2011 and 2022 the median sanitation access improved from 43.9% to 73.5%. In percentage terms, the greatest progress has been made by the Amathole and Amajuba Districts, which increased their sanitation coverage by 55% and 52% respectively.
The progress in water and sanitation coverage has been financed by grants received from the national treasury, both directly through the Municipal Infrastructure Grant (MIG) and Water Services Infrastructure Grant (WSIG)5 programmes and indirectly through the RBIG programme. Jointly, from 2011 to 2022 the grants to the C2 municipalities amounted to R129 billion (in 2024 Rands). In that time 663 000 households gained access to a water supply. Assuming that 70% of the MIG and WSIG grant funding was spent on water supply and 30% on sanitation, and that all of the RBIG funding was spent on water supply, the average cost for every new household added to the number with access to water came to R147 000 in 2024. With a backlog in 2022 of 1.3 million households still not covered by the C2 municipalities, it will take another R191 billion in 2024 for complete coverage. However, this simplistic analysis neglects to take into account the fact that the population will continue to grow, and that those households not yet supplied with water will be harder to serve (otherwise they would by now have been served). When one looks at capital spending per new household added at a district level, some districts stand out. For example, the King Cetshwayo district spent approximately R3.4 billion in 2024 in capital grants on water projects between 2011 and 2022, during which time the number of households connected increased by only 2 107. Likewise the uMkhanyakude District Municipality spent R4.7 billion in 2024 and coverage increased by only 4 707 households. The implication is that most of the money has been spent in replacing or extensively refurbishing existing water supply systems, and not in extending them. The municipalities with the most economical ratio of capital spending to new houses connected were Ilembe and Joe Gqabi, both working out at R43 000 per household added (in 2024 rands).
Every two years the Department of Water and Sanitation conducts the Blue and Green Drop audits of the water supply and sanitation services in each of the 144 Water Services Authorities of South Africa. These audits are focused mainly on water treatment and wastewater treatment plants.
3 Established in 1990, the WHO and Unicef’s Joint Monitoring Programme is the custodian of global data on Water Supply, Sanitation and Hygiene (WASH) - https://washdata.org/
4 All service delivery figures are drawn from Statistics SA reports, i.e. the 10 yearly Census reports and the intermediate Community Survey report, or from the Department of Water and Sanitation’s Water Services Knowledge System which is based on census data, https://ws.dws.gov.za/wsks/default.aspx.
5 In 2016/2017 the Water Services Infrastructure Grant replaced the Municipal Water Infrastructure Grant. In this study the figures from both grants are combined.
The median Blue Drop score for the 21 C2 municipalities in 2023 was 54.8%. This is on the lower end of the Average range and just outside the Very Poor range. In 2023 the total number of Water Treatment Plants assessed by the Blue Drop auditors in the C2 municipalities was 340. The median number of water treatment plants per district is 14, and the average treatment plant size is 8.6 ML/d. When one considers the very large areas covered by these districts, the complexity of the work and the minimum staffing requirements to run a water treatment plant, it can be appreciated the extent of the challenge faced by the C2 districts. In comparison, the water services manager for a metropolitan municipality may only have to manage two or three treatment plants, or may receive all bulk water from a water board, so may not have to manage any water treatment plants at all.
The C2 districts have fared even worse with their management of wastewater treatment plants. The median score for the districts in 2021/2022 was 38%, in the middle of the Very Poor range. The typical C2 district manages 12 wastewater treatment plants, spread over a large area, which poses a significant management challenge. Note that the Green Drop audit is mainly a measure of administrative compliance. Only 27% of the possible score comes from an assessment of the effluent quality. The assumption made by the Department of Water and Sanitation’s audit system is that a water services institution which is administratively compliant, for example having the right number of suitably qualified operators in place, will be more likely to achieve good quality outcomes. The system also does not measure what percentage of sewage actually reaches the wastewater plants, and there are many instances where high Green Drop scores are awarded to plants where 50% or more of the sewage goes missing before treatment.
The reliability of rural water supply systems is another question. The presence of a water supply system does not mean that water is supplied. In 2011 and again in 2016 Statistics SA asked respondents whether they had had any service interruptions of longer than two days in the last 90 days, or cumulatively more than 15 days of shorter interruptions in the last 90 days. If the respondent answered yes, then that supply was deemed unreliable. There is thus data available that shows the measure of reliability and how it changed between 2011 and 2016, but Statistics SA has decided not to publish the detailed reliability data from the 2022 census (due to data quality concerns), so it is not possible to say in which direction the trend has gone since 2016. The average reliability for the C2 districts was 48.4% in 2011. By 2016, this had improved to 51.7%.6
One of the contributing factors to poor reliability is a lack of maintenance. Municipalities are required by the Treasury Department to report in their financial statements on the amount of money they spend each year on maintenance. Unfortunately, there is no common standard for the way the maintenance expenditure is reflected in the financial statements. Some municipalities show maintenance as a line item in their summary of income and expenditure, but others show it only in the notes to their financial statements. The median amount reported as spent on maintenance by the C2 districts is 0.6% of the book value of their assets, far lower than the 8% which is the Treasury guideline. It is, however, probable that municipalities are under reporting their maintenance expenditure. For example, any staff
6 The indicator used by Statistics SA for measuring reliability is not ideal. A water supply which has interruptions of, say, 16 days in a 90-day cycle will be deemed unreliable, but not less unreliable than a system which only works, say, 16 days in a 90-day cycle. As supply interruptions are a common feature of rural water supply systems, more nuanced indicators would be helpful. Examples would be indicators which measure what portion of the time reservoirs are not empty, and indicators which measure what portion of the time pumpstations are functional.
time spent doing maintenance will be captured under personnel cost, not maintenance.
While service delivery is the reason for the existence of municipalities, specifically in the case of C2 districts the provision of water and sanitation services, if a municipality bankrupts itself in the effort to provide services, the services will not be sustainable. Conversely, if a municipality’s finances are sound, but it does not provide most of those living within its boundaries with services, then one can reasonably question whether the main reason for the bank balance being healthy is due to the municipality not spending enough money on the performance of its work.
Superficially all the C2 district municipalities have a positive Net Asset Value7, i.e. the total value of their assets exceeds the total value of their liabilities. Every year their income and expenditure statements invariably reflect a profit, so one might think their finances were healthy. However, the key factor in the “profit” is that the municipalities have been given a significant amount of grant funds to build new infrastructure, which is not expensed, but capitalised. The overwhelming share, in many cases more than 100%, of the municipalities’ net assets comprises their infrastructure, which cannot be sold or used as collateral for loans.
The usual business ratios such as Current Ratio (Current Assets over Current Liabilities) and Cash Ratio (Cash and Cash Equivalents over Current Liabilities) are of limited use when assessing the financial health of C2 district municipalities. For example, one municipality may have little cash, but also a low amount of current liabilities and another may have not much cash and a large amount of current liabilities, and their Cash Ratios may be very similar. The municipalities have a guaranteed income stream in the form of operations grants, which forms the bulk of their income. The real test of how critical a state the finances are in is how many months of operating cash (i.e. cash to cover operating expenses) the municipality has in the bank.
Figure 2 shows the Operating Cash on Hand on 30 June 2023 for the twenty-one C2 districts, measured in months. It can be seen that only four of the twenty-one C2 municipalities have a positive balance of Operating Cash on Hand: Alfred Nzo; Capricorn; Sekhukhune and Ilembe. Ten of the C2 municipalities are more than five months in the red as far as Operating Cash is concerned. This means they are effectively using more than the first
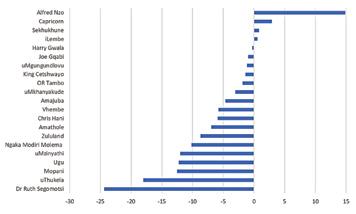
FIGURE 2: Months of Operating Cash on Hand (Cash less Current Liabilities)/Annual Operating Costs) x 12) as at 30 June 2023
7 All financial data in this paper comes from the Audited Annual Financial Statements of the municipalities. Statements up to 2020 can be found at http://mfma.treasury. gov.za/Documents/Forms/AllItems.aspx. More recent documents can be found at https://lg.treasury.gov.za/ibi_apps/portal/Municipal_Documentation
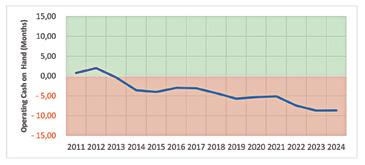
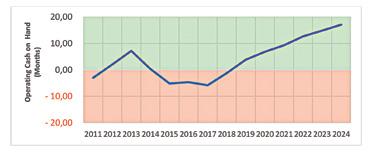
five months of this year’s income to pay the balance of last year’s operating costs, which is not healthy. This typically means that suppliers and service providers will be paid late, or that essential maintenance will be neglected.
A graph showing how a municipality’s Operating Cash on Hand changes from year to year gives a clear picture of the trend of its financial health, i.e. whether it is getting stronger or weaker. For example, Figure 3 shows the Zululand District Municipality’s Operating Cash on Hand (in months) from 2011 to 2024. Whereas in 2011 and 2012 the municipality did have two or three months of Operating Cash on Hand, since 2012 its cash position has trended steadily negative. By 2024 it had minus 8 months of Operating Cash on Hand, which means it was financially very stressed. This in turn would have affected its ability to provide services. Figure 4 shows the Alfred Nzo District Municipality’s Operating Cash on Hand over the same period. The municipality was on a negative trend from 2013 to 2015. Between 2015 and 2017 there was a turnaround after the senior management team at the municipality was replaced, and since then it has become stronger with each succeeding year. By 2024 this municipality had 17 months of Operating Cash on Hand. Twenty years after the new local government structures began operations, Alfred Nzo is the only one of the twenty-one C2 municipalities which finds itself in a truly strong and healthy financial position.
6. WHERE DOES THE MONEY GO?
For many municipalities their single biggest expense is their payroll. Figure 5 shows the payroll cost as a percentage of total income for the twentyone C2 municipalities for 2022. In that year uThukela and Amathole spent two thirds of their income on their payroll. Ilembe was more economical, spending only 30%. The median for the twenty-one C2 municipalities was 45%. Note that some municipalities, for example Ngaka Modiri Molema, have delegated much of the work entailed in water service provision to the local municipalities in their district, but still spent 45% of their income on their own staff. The municipalities with the lowest payroll expenditure are typically those which do not have to run their own water treatment and wastewater treatment works, but have outsourced that work to others, such as Water Boards (Ilembe, King Cetshwayo and uMgungundlovu for example).
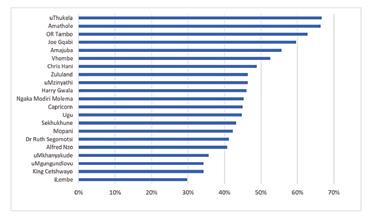
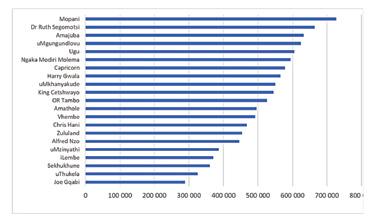
6: Average annual cost per staff member for the C2 municipalities (2022)
Figure 6 shows the average cost of the staff. In 2022 the median of the average cost of staff for the C2 municipalities was R524 474. Note that for these calculations the total number of staff employed is used, not the total specifically employed on water and sanitation services. However, the provision of water and sanitation is the only service these municipalities perform.
By way of comparison, in 1999 a 30-year concession was awarded for management of water services on the Dolphin Coast (north of Durban). The concessionaire is Siza Water. In 2022 Siza employed 95 people to serve 77 000 people. Their payroll cost was R22 035 000, making their average cost of staff R231 947, and their cost per 1 000 people served R286 168. Their payroll is 18% of their income.
7. ARE THE OPERATIONS GRANTS SUFFICIENT?
The operational grant income is the principal source of income for the C2 district municipalities (90% of income comes from the operations grants for the C2 municipalities). As Figure 2 shows, most of the C2 municipalities are financially distressed, using this year’s income to pay for nearly half of last year’s expenses, and as the Blue Drop and Green Drop audits show, service delivery is not going particularly well.
From the district municipalities’ perspective, the simplest solution to their financial (and operational) problems would be to increase the operations grants8. However, the level of grants currently paid does vary quite significantly across the twenty-one districts, with six of the districts (uMgungundlovu,
8 For context, note that it can be shown that the grants are fairly generous by international standards, exceeding the amounts that the districts would be earning if every household was billed for the water they used at typical tariffs, and if every household paid their bills.
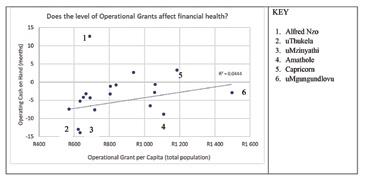
7: The relationship between the level of operational grant per capita and the C2 municipalities’ financial health (as measured by Operating Cash on Hand, June 2022)
Amajuba, King Cetshwayo, Amathole, Joe Gqabi and Capricorn) receiving significantly more than the other districts due to their legacy with the Regional Services Levy replacement grants. If an increase in operations grants was all that was needed to fix these districts, then the districts with higher operations grants would all be doing better than their peers, but they are not. In June 2022 Amathole, for example, had Operating Cash on Hand of minus 9 months, despite being one of the more generously endowed municipalities as far as operations grants are concerned, while the Alfred Nzo District Muncipality had Operating Cash on Hand of plus 12 months, despite being one of the more poorly endowed municipalities. Figure 7 shows that the correlation between the level of operations grants received by the C2 municipalities and their financial health (as measured by Operating Cash on Hand) is weak.
Figure 7 indicates that the solution to the C2 municipalities financial distress is not simply a matter of increasing their operations grants. That does not, however, mean that the grants necessarily are sufficient.
A fairly good estimate of operational costs can be made by :
a) Estimating the value of the infrastructure under management by the municipality. This can be done by multiplying the service level data obtained from Census 2022 by standard unit values9
b) Multiplying the estimated infrastructure value by standard percentages for operations and maintenance.10
Using this method, it is found that the operations grants exceed the estimated cost of operations and maintenance for just three of the C2 municipalities. When income (receipts as opposed to billing) from service charges is factored in, it appears that five of the 21 C2 districts should have enough money to perform their functions and keep the infrastructure in good condition, while the other sixteen do not have enough funds. Figure 8 shows the adequacy of current income levels vs modelled operations and maintenance costs across the twenty-one C2 municipalities. For the typical C2 municipality its total income (grants and service charges) is only 70% of the amount it should ideally have to properly operate and maintain its infrastructure.
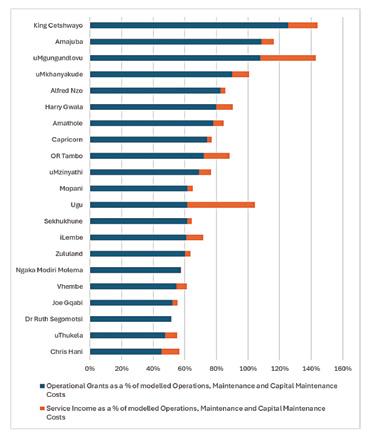
FIGURE 8: Operations grants and services income as a percentage of modelled operations costs for the C2 municipalities
8. WHAT CAN BE DONE TO INCREASE INCOME?
Figure 9 shows the amounts billed by the twenty-one C2 municipalities for services in their 2022 financial year, as well as the amount which they received in payment for services in that year. The typical C2 municipality only collects 60% of the amount it bills each year. While they do aim to improve their recovery rates, Figure 8 shows that for most C2 municipalities, even if their service income doubled, their overall income would still fall short of their needs. Municipalities could also increase the total amount that they bill, but there are two major challenges in this regard:
• The Free Basic Water policy, introduced by the national government in 2001, means that municipalities have an obligation to provide a basic supply water to indigent households for free. Due to the administrative difficulties of differentiating between those who are truly indigent and those who are not, and limiting qualifying households to just the basic monthly volume, most municipalities simply use geographic criteria for determining who gets billed and who does not, and the way that works in practice is that people living in towns tend to be billed for their water consumption and people living in rural areas on communal land (i.e. much of the population of the C2 municipalities) tend not to be billed.
• Due to logistic challenges, rural water supply is very expensive, much more expensive than urban water supply. Realistic (cost-based) tariffs would be unaffordable to their customers.
9 The unit values used for this exercise were: R60 000/hh for a yard connection; R30 000/hh for access via public standpipe; R80 000/hh for a flush toilet connected to a municipal sewer; R25 000 for a toilet connected to a septic tank; and R15 000 for a VIP toilet.
10 The percentages used for this exercise – based on literature review - were 1.5% of Current Replacement Cost for maintenance, 3% for operations, 2% for capital maintenance and a 15% overhead on all of the above.
The water supply and sanitation services for 28% of South Africa’s total population and 65% of South Africa’s rural population are the responsibility of twenty-one C2 District Municipalities which are designated Water Services Authorities: ten in KwaZulu-Natal; five in the Eastern Cape; four in Limpopo; and two in the North West. With more than 20 years having passed since
local government in South Africa was fundamentally restructured and the powers and functions of local government were resolved, it is fitting to review what can be learned from the experience of these 21 District Water Services Authorities.
The job of water services provision in a C2 district is not easy. The districts are very large, typically an order of magnitude larger than those covered by the better resourced metropolitan municipalities. Also, whereas the Water Services Manager for a city may only have to manage one or two water treatment plants, or perhaps none at all (bulk water being supplied by a water board), Water Services Managers for the C2 municipalities have to manage on average 16 water treatment plants each. Performance - as measured by the speed of backlog eradication, Blue Drop scores, Green Drop scores and reliability of services – is generally not good.
This is in a context where much or even most of the water supplied is perceived as “free basic water”, whether it is meant to be or not, so income from services from consumers does not come close to covering the cost of operations. For the C2 municipalities the operational grants received from Treasury (the Equitable Share and Regional Services Council Replacement levies) typically provide 90% of their income. All but four of the 21 C2 municipalities are cash strapped, with the typical district requiring five months of the new year’s income to pay the balance of the last year’s operating costs. The obvious solution would be to increase the operations grants, but in practice these grants vary quite significantly from district to district and there is little correlation between the level of per capita operations grants and the financial health of the municipalities. The grants are fairly generous by international standards, exceeding the amounts that the districts would be earning if every household was billed for all the water they used at normal tariffs, and if every household paid their bills. However, even with these generous grants and assuming income from service charges was maximised as far as is possible in the South African context, sixteen of the 21 C2 districts would still not have enough income to adequately operate and maintain the infrastructure under their management. In South Africa we have built a lot of expensive infrastructure in places where there is very little money to sustain it.
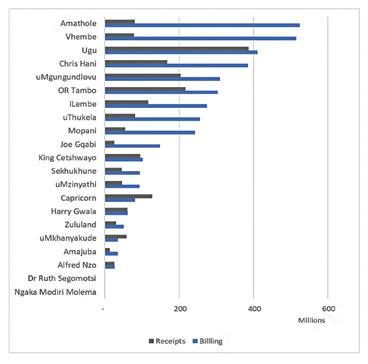
Compounding the challenge faced by municipalities is their experience that the procurement system under which they operate (the Municipal Finance Management Act) does not facilitate cost-effective and efficient service delivery (MacLeod, 2024).
Municipalities are coping with the lack of funds by paying their bills late, or in some cases by not paying them at all. They are also not spending enough on operations and maintenance, which is one of the key reasons for their poor service delivery record. The financial trajectory of most of the C2 municipalities is negative and is likely to become more so as more and more expensive infrastructure is added without a proportionate increase in their income.
As is true of most water service provision organisations, staff costs are the single largest expense for the C2 districts, with the median payroll cost being 45% of income. The median annual cost per employee in 2022 was R524 474. In contrast, Siza Water, which has been running the Dolphin Coast water concession since 1999, had an average annual staff cost of only R231 947 in 2022, and was spending only 18% of its income on staff. While consolidating service provision at district level and ring fencing of water services in municipal accounts are both proposed as possible solutions for the crisis with water services provision in South Africa, the experience of the C2 district municipalities, which only provide water services, shows that these solutions, as advisable as they may be, are not in themselves sufficient to ensure good service provision and healthy finances.
A number of recommendations flow from the conclusions of this work:
1. There should be continuous effort to improve the cost-efficiency and effectiveness of the C2 district municipalities. The fact that some, admittedly not many, of the C2 districts are doing reasonably well demonstrates that the rest could do better. Instead of trying to do everything in-house, WSAs should consider the use of Community Based Organisations, Water Boards and Public Private Partnerships to provide some aspects of the services which they use. There are successful examples of these arrangements among the twenty-one districts which they could learn from.
2. There is evidence that a good management team (Municipal Manager, Chief Financial Officer and Technical Director) can, given positive and strong political support, turn the fortunes of a municipality around. Where municipalities are performing badly, serious consideration should be given to appointing competent replacements.
3. Municipalities need to become much stricter with customers who do not pay their bills. This can only be done with strong political support. It is simply not sustainable to write off nearly 50% of municipal service income every year.
4. There needs to be a move away from expensive and complex technical solutions to simpler and more affordable options. Modular, adaptive and decentralised technologies should be favoured over large-scale regional schemes which are expensive to build and complex to operate. This is especially the case as efforts are made to supply water to the most remote communities which do not yet have access to a basic level of water and sanitation.
5. Expenditure on maintenance needs to be given a higher priority. While more funding for maintenance, especially capital maintenance, could be made available through changes in national policy with respect to the rules for the use of capital grants, at local government level funding for maintenances could be increased by making savings elsewhere.
6. There is great disparity in the level of the operations grants, on a per capita basis, paid to the different C2 districts. While there may not necessarily be
a sound argument for increasing operations grants across the board, there certainly is an argument for increasing the level of grants to those districts which are less well endowed.
7. The procurement system under which municipalities operate (the Municipal Finance Management Act) should be amended to make it possible for services to be rendered in a cost-effective and timeous manner.
11. REFERENCES
Department of Water and Sanitation (DWS). (2022). Green Drop Report. Department of Water and Sanitation (DWS). (2023). Blue Drop Report Department of Water and Sanitation (DWS). (2024). Water Services Knowledge System https://ws.dws.gov.za/wsks/default.aspx https://municipalities.co.za/ - a range of useful information is available on this site for all municipalities in South Africa Macleod, N. (2024). Notes from discussions with various professional and government bodies on supply chain issues requiring attention. Personal communication.
Statistics South Africa (StatsSA). (2023). Census 2022. Statistical release P0301.4.
ACKNOWLEDGEMENTS
This paper is a short summary of work conducted under the Water Research Commission (WRC) project C2020-2023-00895, A review of rural water supply and sanitation services in South Africa 2002-2022. The study has been published in 3 volumes and will be available from the WRC.
The assistance of Dennis Behrmann in providing analysis of service delivery and census data has been invaluable.
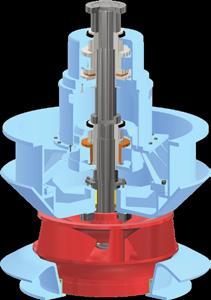

JA Du Plessis1*, JJ Hoffman1 and HE Jacobs1
1 Stellenbosch University, P.O. Box Private Bag X1, Matieland 7602, South Africa jadup@sun.ac.za1
ABSTRACT
The study assessed water pipe failure rates in a South African municipality to highlight the need for proper maintenance and compare results to acceptable norms. The study underscored the necessity of reliable data. A key observation was that linking pipe breaks to precise locations is essential for accurate analysis. About 83% of reported breaks investigated in this study could be geographically linked. To address this problem, it is recommended that case reports need to include coordinates for all pipe breaks, which can be easily captured using modern mobile devices. A literature review provided pipe break benchmark values based on pipe age, material, diameter, pressure, and seasonal variations. The study area included approximately 795km of pipelines. About 36% of all pipes were categorised in the 90-125mm diameter range, with only 8% exceeding 450 mm diameter. Additionally, 30% of the pipes were older than 45 years. Approximately 40% of all pipes operate within the 40–60m pressure range.
The response time to repair pipe failures was also analysed. In ~50% of all cases, a team was dispatched within 4 hours, while 35% of repairs took longer than 15 hours to initiate. Once on-site, 70% of breaks were repaired within 6 hours. Breaks reported between midnight and 06h00 typically had a 9-hour response time, whereas those reported between 06h00 and 18h00 were attended to within 2 hours. However, repair durations remained consistent, with over 70% of repairs completed within 6 hours, regardless of reporting time. Failure rate was found to be proportional to pipe age, with pipes over 46 years exhibiting a failure rate of 0.669 failures/km∙year, compared to 0.1 failures/km∙year for relatively new pipes. The highest failure rates (0.789 failures/km∙year) were observed in small-diameter pipes (90–125mm). The study found no correlation between pipe failures and rainfall or seasonal changes. Spatial analysis did not reveal specific failure hotspots, though 11% of failures were classified as recurring within 60 days and 50m of a prior break –lower than the internationally reported values of 22–46%. The average failure rate of 0.45 failures/km∙year in the study area was higher than 89% of various global benchmarks.
1.1 Background
This study investigates pipe failures of a typical municipal treated water network. The purpose of the study was to analyse the available pipe failure data for the period July 2013 to June 2024 (11 years) to understand causes and trends in pipe burst frequency and to compare the results to available benchmarks.
1.2 Confidentiality
For reasons of confidentially, the name of the municipality and the related location of the study area were not disclosed in this manuscript. This factor was not considered limiting in terms of the results and key findings reported
here. Conclusions presented in this paper are aimed at a wider audience and are not site-specific. Ultimately, outcomes of this study would also be used by the relevant municipality to inform appropriate remedial steps to ensure a well-maintained water network (although not reported here).
2.1 Terminology and KPIs
Barton et al. (2019) provided clarity around terminology and pointed out that the terms leak, burst or failure are used when a pipe break and water is released. These terms are often synonymously used with pipe failures. Pipe breakages can contribute to significant water losses in water distribution networks and negatively impact service delivery. Sufficient high-quality data is needed to enable a better understanding of how well a water network is managed in the context of breaks or failures. Information is needed regarding the network characteristics, the logging/reporting of various pipe failures and the associated response times to address the failures.
One of the key indicators used for comparison is the failure rate for pipe breaks, indicating the number of pipe failures per year per unit of pipe length. Various distance units are used in literature, with the most common expressing the number of failures per 1 000, 100 or 1km. In this study the unit consistently used to describe pipe failure rate is failures per km per year (failures/km∙year).
2.2 Factors influencing pipe failure
Barton et al. (2019) presents a review of factors influencing pipe failure and sort the factors into three groups, viz. pipe intrinsic factors, environmental factors and operational factors.
• Pipe intrinsic factors include material, joint systems, coating and lining, manufacturing defects, damage from handling, storage and third parties, corrosion and chemical degradation, pipe age and diameter.
• Environmental factors include seasonality, temperatures and soil movement as well as other soil and ground movement.
• Operational factors are internal pipe pressure and previous failures. Wengstrom (1993) completed a literature review on pipe failures to investigate various factors that influence failure rate. Among others, the following key factors i.e. age, diameter, pipe material, seasonal variation, soils, pressure and previous failures, were listed. The review of factors for this study was based on the work by Barton et al. (2019), with emphasis on factors that were more prominent in the case study.
Failure rate is known to increase with pipe age, with failure rate increasing notably after a pipe reaches a certain age (typically with zero remaining useful life). Barton et al. (2019) collected data from 308 water companies in the USA and Canada and reported that the average age of pipe failure is 50 years.
Barton et al. (2019) also confirms that pipe age has a linear relationship with failure rate, with older pipes being more likely to fail, but the relationship is more complex. Failures rates are typically higher in the months immediately following installation, then drop to a low rate of failure for several decades, before increasing with age. Giustolisi and Berardi (2009) reported that failure rate of a pipe is roughly constant during the “in-usage” phase (normal service)
and increases with time as the pipe approaches the end of its life cycle (“wear-out” phase).
In addition to pipe age, the installation year – linked to pipe material –has been found to influence failure rate. Certain periods in history could be linked to relatively poorer installation methods of certain pipe materials than other periods (Andreou, 1986), also because construction methods improved over time.
Few studies report failure rate for different materials separately – some are noted in Table 1. Pipe failure analysis suggests a strong relationship between failure rate and pipe diameter (Barton et al. 2019). The highest failure rate is typically reported in pipes with relatively small diameters, e.g. <200mm in diameter. Higher failure rates in small diameter pipes have been investigated in previous studies and could be linked to low resilience to ground movement, corrosion (the smaller diameter pipes have relatively thinner walls), poor joint reliability and susceptibility to nearby construction activities especially in urban areas and at shallower depths Internal pressure was found to influence pipe failure rate, with higher pressures leading to increased failure rate (Andreou, 1986). However, few studies report on the relationship between pressure and failures.
Walski (1982) confirmed that pipe failure rates are seasonal; pipe failures were found to increase during the winter months (in the USA), as reported by Andreou (1986). Dehghan et al. (2009) conducted statistical analysis of
TABLE 1: Pipe failure rates – Overview from literature
Reference Description / Location
Goulter & Bouchart (1990) 25mm diameter
Gupta & Bhave (1994) 150mm to 400mm
Fujiwara & DeSilva (1990); Fujiwara & Tung (1991) 100mm to 350mm
Shamir & Howard (1979) N/A
Walski & Pelliccia (1982) N/A
Kleiner & Rajani (1999) N/A
Mailhot et al. (2003) N/a
the structural failures of water pipes in Melbourne, Australia. The pattern of rainfall in the region was compared with the pattern of failure rate variations and in 70% of the times the two patterns are observed to be consistent. In other words, a strong link was established between rainfall and failure rate. Dehghan et al. (2009) also highlighted that between 22% and 46% of all pipe failures do have a strong link to previous failures and that in 60% of these cases the re-leak occurred within 3 months of the previous failure. They concluded that previous failures are one of the most significant impact factors in the analysis of pipe failures. Seasonal failure patters with typically more failures in winter months, were also confirmed with an interesting link to water temperature, with higher water temperature typically resulting in more failures.
Some of the factors listed above are more relevant to the current study mainly due to available data. The review of factors influencing pipe failures for this study was based on the work by Barton et al. (2019), with emphasis on factors that were more prominent in the case study.
From the literature it was concluded that pipe age, diameter, pressure as well as rainfall need to be evaluated to ensure informed decision making. The relationship between pipe failures, using indicative benchmark values, will also be evaluated over time to determine whether the Municipality is gaining or falling behind in terms of their maintenance / pipe replacement efforts.
to 0.05
to 0.05
to 0.15
to 0.188
to 0.19 SA WRC Benchmark Newsletter No 6 Western Australia – 2003
Western Australia – best figures over 4 years
Andreou (1986) Houston, USA, Total network length 6 417km with ave age 70 years
Andreou (1986) New Orleans, USA, Total length 2,295km
Andreou (1986) Detroit, Milwaukee, Philladelphia, Kansas City, Baltimore, Denver, 6 systems with average failure rates
Andreou (1986) Columbia, San Francisco, NY, St Louis, Chicago, Boston, LA, Seattle, New Haven, 10 systems in USA with low failure rates
Dehghan et al. (2008) Melbourne Zone 1, Australia, Highest failure rate reported in Australia
Dehghan et al. (2008) Melbourne Zone 2, Australia
Dehghan et al. (2008) Melbourne Zone 3, Australia
Barton et al. (2019) UK Combined data set, Iron pipes
Barton et al. (2019) UK Combined
Barton et al. (2019)
et al. (2019) UK Combined data set, All data combined
Jacobs et al (2025) Combined 2000–2023, Dunedin New Zealand
Cabral et al. (2024) Unsure (Portugal / Brazil), system has >75% of pipes with diameter < 250mm
Vega (2022) Auckland, main pipes
to 0.189
2.3 Failure rate
A comprehensive review of reported failure rates from various case studies is presented in Table 1. Neelakanta et al. (2008) sited various international researchers to summarise failure rates, frequently linked to pipe diameter. In a study by Vega (2022) the number of pipe failures were investigated for Auckland. The author differentiates between service pipe failure and main pipe failures, with service pipe failures typically linking the households with the network. The research recorded an average main network failure rate of 0.278 failures/km∙year. The Water Research Commission (WRC, n.d.) also reported some case study values from Australia in their Benchmark newsletter (issue No 6), also included in Table 1.
While generalised international benchmark values are not readily available (most are within a specific context), Cabral et al. (2024) present a pipe conditional matrix indicating that 0 failures per year is good, while 1 failure per year can be considered as average, with 2 failures per year as unsatisfactory. However, when considering the values provided in Table 1, it can be concluded that any failure rate > 1 can be high. Comprehensive analysis of pipe failure data in Jacobs et al (2025) showed that the failure rate was less than ~0.4 failures/km∙year for 80% of all annual values (for all pipe materials over 24 years), with an average of 0.2 failures/km∙year.
Melbourne Water in its Water Main Renewal Study (cited in Dehghan et al. 2008) noted that the western region of Melbourne (CWW) was experiencing a disproportionately high rate of failures. It reported a failure rate three times that of Melbourne’s other two water supply systems. For example, between 1972 and 1990 the annual average water main failure rate throughout the first study area was approximately 1 failure/km∙year, while this value was 0.3–0.5 failure/km∙year for the other two regions.
3.1 Research methodology
This study comprised collection, collation and subsequent analyses of available information relating to pipe failures in the study area. Typical characteristics of water supply infrastructure were evaluated, considering the following independent variables: diameter, length, age, operating pressure. Subsequently the results of pipe failure, as function of various parameters, is presented. The data were evaluated in the context of the municipal financial year, from 1 July to 30 June of the following year. The analysis covers an 11-year period from 1 July 2013 to 30 June 2024.
3.2 Data collection
Data was obtained directly from the municipal pipe asset database as well as previous reports. Eight water distribution regions were included in the study area, with the main source of data being the IMQS data base. The original input to IMQS was sourced through various role-players and staff members over time.
The key source of data used in the analysis was derived from the pipe failure reports. The availability of reliable data also influenced the level of detailed analysis possible for the various regions, and it was only possible to assess the information considering all the data together, as opposed to an analysis for each region on its own. The quantity and quality of data was considered sufficient to draw reliable conclusions.
The data used in this pipe failure analysis originated primarily from the monthly pipe failure reports. The original report forms were completed in hard copy format by the team supervisor responsible for managing the maintenance team doing the pipe repair. One report form was complete per pipe repair incident. Information from report forms was subsequently captured in excel format by municipal staff. The data received from the Municipality in MS Excel was assumed to be accurately captured and additional verification was considered beyond the scope of this study.
3.3
The focus of the investigation was on physical pipe characteristics and how these variables impacted pipe failure rate. The physical parameters were considered useful because it was possible to compare the results to reported values from studies elsewhere. Although this study also considered rainfall and temperature correlations to explain seasonal trends, the related findings were inconclusive and were excluded from this paper.
3.4 Spatial identification of pipe failures
One of the critical data challenges is to identify the position of a reported pipe failure accurately in terms of position, the correct pipe segment and diameter. The typical position of a failure is reported in the pipe failure reports in the form of a sketch/explanation. The pipe failure coordinates were recorded in IMQS, allowing each pipe failure record to be linked to the closest pipe GIS-feature. Pipe failure positions which could not be linked in this manner, were linked to the reported street address. The address was linked to the closes pipe GISfeature to within 50m, using the reported same pipe diameter from the pipe failure case report. A total of 3910 failures could be linked to a specific position, which was almost 83% of all the reported pipe failures in the database.
4.1 Pipe failure reporting
Each pipe failure is associated with significant water losses. A quick response time to repair these failures/leaks is important to minimise water losses and prevent poor service delivery. The analysis into the response time, with reference to the time it took from a failure being reported till an action was taken, provide results summarised in Figure 1, with 50% of all failures been responded to within 4h.
The repair time, which can be influenced by many aspects, indicated that 70% of all failures were repaired within 6h. The time and day of the week a failure was reported, did not provide any reason for concern. 50% of all reported failures between 00h00 and 06h00 were attended to within 9h, while for the response time for failures reported between 06h00 and 18h00, 60% were attended to within 2h. For failures reported between 18h00 and 24h00, only 20% of the reported failures were attended to within 8h. Repair time were however not influenced by the time of the day it was reported or the day of the week.
4.2 Pipe failure rates linked to age distribution
The number of failures per annum in the municipality is gradually increasing, which is to be expected, given the aging and expansion of the network over time. While there are no significant differences, slightly more pipe failures were experienced in the months of September and October. Considering the age distribution of pipes which failed, Figure 2 clearly highlighted that about 40% of these failures occurred at pipes older than 46 years. Also important to note is that new pipes were installed where about 15% of the pipe failures occurred, indicated as the category “new” in Figure 2. This is indicative that pipe replacement took place on pipes with a high risk of failure.
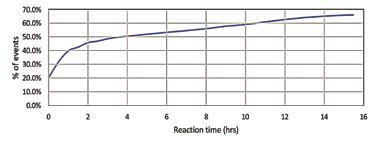
FIGURE 1: Reaction time to start of reported pipe failure repair
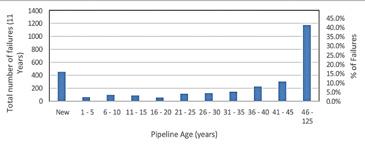
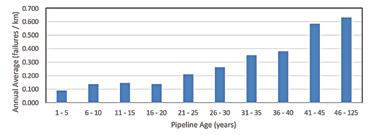
As expected, the rate of pipe failure systematically increases with age, with newly installed pipes reflecting a value of 0.1 failures/km∙year, while the two oldest categories of pipes (all pipes older than 40 years) proofs to have a failure rate of 0.669 failures/km∙year to 0.695 failures/km∙year, almost 7 times higher. Figure 3 illustrates a markable increase in failure rate of pipes from age 41 and older, which is in line with international experience that pipe typically fail at age 50.
4.3 Pipe failure rates linked to diameter distribution
The failure rate for different pipe diameter categories is illustrated in Figure 4. The smaller diameters (50mm and smaller) experienced the highest failure rates, with values ranging from 0.5 failures/km∙year to 0.94 failures/ km∙year over the years, with an average of 0.789 failures/km∙year. These values are in line with international literature.
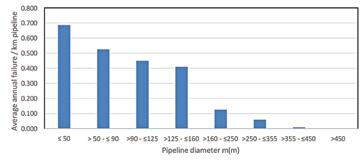
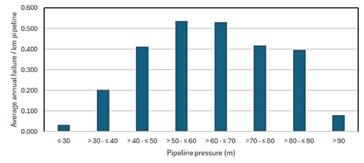
4.4 Pipe failure rates linked to Pressure distribution
The static pressure from IMQS was interpreted as the average pressure between the start and end of each pipe length. The pressure values were not measured pressures, but theoretical static pressure. The failure rate for different pipe diameter categories is illustrated in Figure 5. The average failure rate for all pressure zones from 40 to 90m is above about 0.4, with the highest rate of average pipe failures in the 50 to 70m pressure category with values of between 0.53 failures/km∙year to 0.54 failures/km∙year. The failure rate in the 70 to 90m pressure zone consistently increased during the past 3 years.
4.5 Seasonal variation in pipe failures
Rainfall data from a representative rainfall station was used to investigate any correlation with pipe failures. No correlation between pipe failures and hourly, daily or 7-day rainfall could be found. The seasonal pattern of pipe failures was further investigated using the rainfall pattern as guiding indicator. Figure 6 illustrated that while Spring on average account for the highest number of pipe failures, no clear correlation could be obtained from the available data.
4.6 Repetitive pipe failures
The reoccurrences of a pipe failure might be indicative of poor repair procedures and was therefore also analysed and the results presented in Figure 7. 11% of all failures can be considered as reoccurring failures (failures occurring within 50m of the original failure) taking a 60-day period (days between the first and second failure) into consideration. The repetitive failures within a 5-year period are in line with international literature values.
5. DISCUSSION AND CONCLUSIONS
The main objective of this paper was to highlight the key findings in the assessment of the pipe failure rate of all the water supply pipelines in the municipality experienced during July 2013 to June 2024 . Due to challenges experienced with the data collection and analysis process, only 82.9% of all reported failures could be linked to a specific pipeline network.
A comprehensive literature review provided a range of benchmark values for pipe failure depending on age, material, pipe diameter, pressure as well as seasonal variations. Since the dataset did not have a variety of different pipeline material, only benchmark values for age, pipe diameter and pressure were calculated. Pipe age was identified as a significant challenge for the municipality. Almost 38.5 % off all pipe lengths are being operated in the 40 to 60m pressure range.
An analysis of the response time (how quickly a team was sent to attend to a pipe failure after report) revealed that in 50% of the cases a team was sent out within 4h. About 35% of the repairs took longer than 15h to attend to. Once on site, 70% of the failures were repaired within 6h, with about 20% taking longer than 20h. About 50% of all pipe failures reported between 00h00 and 06h00 took approximately 9h to attend too, while 60% of those reported between 06h00 and 18h00 took only 2h to attend to. For failures reported after 18h00, only 20% was responded to within 8h. The repair time were however not influenced by the time of the day and more than 70% of the failures were repaired within 6h. The day on which a pipe failure was reported on, was not found to influence the repair time.
About 82.9% of all pipe failures could be linked to a specific position, which enabled a more detailed analysis of the link between pipe failures, age, pressure and diameter. As expected, more than 40% of all failures occurred in pipelines older than 46 years, in line with international experience indicating that pipes typical fail at age 50. With more than 30% of all pipes older than 46 years, a significant increase in pipe failures can be expected in the future.
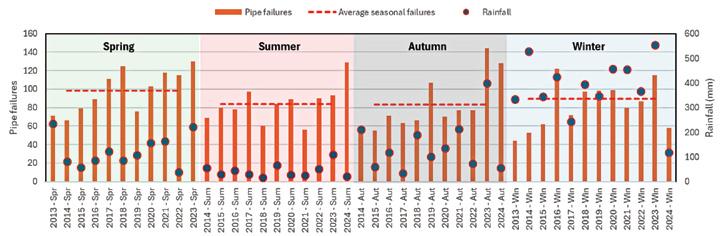
For comparative purposes, taking pipe length into consideration, the failure rate increased from 0.1 failures/km∙year for newly installed pipes to 0.669 failures/km∙year for pipes older than 46 years.
Almost 70% of all pressure pipe failures occurred in the 40-70m pressure zone, with the highest average rate of failure between 0.53 and 0.54 failures/km∙year. 46.9% of all failures, taking pipe size into consideration, occurred in the 90 to 125mm diameter category. The failure rate in terms of pipe diameter was found to be the highest in the small diameter pipes, with 0.789 failures/km∙year. The failure rate for pipe diameters >250mm dropped significantly to 0.072 failures/km∙year. There is no indication of any systematic increase in failure rate for pipe size over time.
An analysis into the impact rainfall and different seasons might have on the number of pipe failure was inconclusive. No link to the monthly rainfall was detected or to the cumulative 7-day rainfall prior to a failure. Evaluating the number of pipe failures occurring in the different seasons, were also inconclusive, with only marginal increased average pipe failures observed in spring.
Assessing the spatial distribution of pipe failures within the context of this study was challenging. GIS plots did not highlight any particular “hot spot” areas. An analysis into the possibility of re-occurring pipe failures provided interesting results. Only 11% of all values were identified as possible reoccurring failures, which a significantly lower than the international reported 22% to 46%, with 60% occurring within 3 months.
Some contrasting results were obtained when comparing the pipe failure rates with other entities. At an international level, the distribution network experienced average pipe failure rates of approximately 0.45 failures/ km∙year which is higher than 89% of the international reported failure rates.
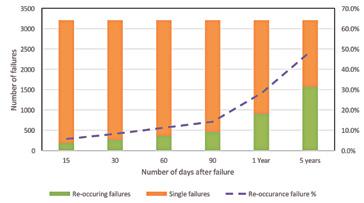
7: Re-occurring pipe failures for different time periods
The international comparison using pipe diameter as an indicator reflects that the municipality experience the same trends reported internationally.
6. RECOMMENDATIONS
It is clear from the research that municipalities face a significant challenge to ensure that their water pipe networks will keep up with growing demands. To facilitate a sustainable water pipe network management strategy, it is recommended that municipal engineers consider the flowing as part of their sustainable Maintenance Action Plans (MAPs):
• Up to date asset register for all water pipes, which include age.
• Accurate logging/reporting of the positions of pipe breaks on their pipe break reporting system.
• The reporting of actual pressures against design pressures as part of the reporting system
• Consider pressure reduction in areas with pressure significantly higher than design / min requirements.
• Accredited (standardised) training to all plumbers responsible for maintenance.
• The development of a standard reporting system at National/Provincial level for various pipe break benchmarks to facilitate funding allocations.
7.
Andreou SA (1986). Predictive models for pipe break failures and their implications on maintenance planning strategies for deteriorating water distribution systems. Doctor of Philosophy, Department of Civil Engineering, Massachusetts Institute of Technology
Barton NA, Farewell TS, Hallett SH and Acland TF (2019). Improving pipe failure predictions: Factors affecting pipe failure in drinking water networks. Water Research 164 (2019) https://doi.org/10.1016/j.watres.2019.114926
Dehghan A, McManus K and Gad E (2008). Statistical analysis of structural failures of water pipes. Proceedings of the Institution of Civil Engineers, Water Management 161, August 2008 Issue WM4, Pages 207–214 doi: 10.1680/wama.2008.161.4.207
Fujiwara O and Desilva AU (1990) Algorithm for reliability based optimal design of water networks. J. Environ. Eng. ASCE 116 (3) 575-587.
Fujiwara O and Tung HD (1991) Reliability improvement for water distribution networks through increasing pipe size. Water Resour. Res. 27 (7) 1395-1402.
Giustolisi O and Beradi L (2009). Prioritizing pipe replacement: From Multi objective genetic algorithms to operational decision support. Journal of Water Resources Planning and Management 135(6), November 2009.
Goulter I and Bouchart F (1990) Reliability-constrained pipe network model. J. Hydraul. Eng. ASCE 116 (2) 211-229.
Gupta R and Bhave PR (1994) Reliability analysis of water distribution systems. J. Environ. Eng. ASCE 120 (2) 447-460.
Jacobs HE, McLeod MM & Medel K (2025) Dunedin City Council water supply pipe repairs – Reviewing three decades of data, 10th IWA ASPIRE Conference and Water New Zealand Conference & Expo, 29 September – 3 October 2025, Christchurch, New Zealand https://www.waternzconference.org.nz/
Kleiner Y and Rajani B (1999) Using limited data to assess future needs. J. Am. Water Works Assoc. 91 (7) 47-61.
Mailhot A, Poulin A and Villeneuve JP (2003) Optimal replacement of water pipes. Water Resour. Res. 39 (5) HWC 2-1 to HWC 2-14.
Neelakantan TR, Suribabu CR and Lingireddy S (2008). Optimisation procedure for pipe-sizing with break-repair and replacement economics. Water SA Vol. 34 No. 2 April 2008.
Shamir U and Howard CDD (1979) Analytical approach to scheduling pipe replacement. J. Am. Water Works Assoc. 74 (3) 140-147.
Vega LLL (2022) Analysis and modelling of leaks in the Auckland water distribution system. PhD thesis, University of Auckland.
Walski TM and Pelliccia A (1982) Economic analysis of water main breaks. J. Am. Water Works Assoc. 74 (3) 140-147.
Wengstrom T (1993) Comparative Analysis of Pipe Break Rates – A Literarure review. Chalmers University of Technology, Dept of Sanitary Engineering, Sweden. Publication 2.:93. June 1993.
Water Research Commission (n.d.) WRC Benchmark Newsletter No 6 for SA. Available online at: www.wrc.org.za/wp-content/uploads/mdocs/The%20 Benchmark06. Accessed 26 November 2024.

Dr Kevin Wall
Department of Construction Economics, University of Pretoria; Tel: 082-459-3618; Email: kevin.wall@up.ac.za
ABSTRACT
The Constitution of 1996 states that the purpose of local government is inter-alia “to ensure the provision of services to communities in a sustainable manner”. Of the several steps that the government of the time took to put the Constitution’s intentions into effect, one of the most important was to commission the drafting of a White Paper on the form and function of local government.
This White Paper, which appeared in 1998, based its recommendations on a number of assumptions, many of which must even at the time have been questionable. For example that attracting skilled staff would not be a challenge, municipalities would be “able to cover the costs of service delivery”, and levels of trust would be high.
Despite steadily accumulating evidence of the questionable nature of many of the 1998 assumptions, government has made no changes of significance to the basic structure shared by all municipalities. However it has recently noted that “Many of the challenges in municipalities arise from the design of our local government system”, and thus the President has promised that government will “develop an updated White Paper on Local Government to outline a modern and fit-for-purpose local government system”. (Ramaphosa, 2025.) That this realisation has taken such a long time suggests government might still not understand where wrong directions were taken in 1998 and thus what will now be required for functioning local service delivery throughout the country.
Initial steps to develop the updated White Paper have been taken. IMESA has been invited to participate.
Keywords: Auditor General, dysfunction; local government; service delivery, South Africa; White Paper.
The new government in 1994 assessed the then existing local government system, with its multitude of local authorities often divided along racial lines, and concluded that “delivery on new municipal mandates cannot be achieved within the existing institutional framework” (i.e. that inherited in 1994) (Department of Provincial Affairs and Constitutional Development (DPACD),1998: 14i).
In 1996, the new Constitution allocated to municipalities the responsibility “to ensure the provision of services to communities in a sustainable manner;” (South Africa, 1996: Clause 152 (b)).
The White Paper on Local Government of 1998 spelled out the framework in terms of which the local government system would be transformed, and described the characteristics of these new municipalities and how service delivery would then flow smoothly. However the descriptions included a large number of assumptions, many of which have proved to
be questionable. For example that attracting skilled staff (presumably even to the most remote of municipalities) would not be a challenge, municipalities would be “able to cover the costs of service delivery”, users of municipal services would pay for them, and levels of citizen trust of the municipalities would be high.
Despite ample evidence of the shakiness of the 1998 assumptions, government has in 25 years made no changes of significance to the basic structure shared by all municipalities. However it has recently noted that “Many of the challenges in municipalities arise from the design of our local government system”, and thus the President has promised that government will “develop an updated White Paper on Local Government to outline a modern and fit-for-purpose local government system”. (Ramaphosa, 2025.)
That this realisation has taken such a long time suggests government might still not understand where wrong directions were taken in 1998 and thus what will now be required for functioning local service delivery throughout the country.
In his State of the Nation speech earlier this year, President Ramaphosa correctly stated:
“A capable state must start where people live and work.
In many cities and towns across the country, roads are not maintained, water and electricity supply is often disrupted, refuse is not collected and sewage runs in the streets.
In part this has happened because many municipalities lack the technical skills and resources required to meet people’s needs.” (Ramaphosa 2025) While many municipalities have, by and large, performed well at delivering the services expected of them in terms of the Constitution, a sizeable number have not.
Government is aware that where there is municipal service delivery failure it is rooted in the “dysfunctional or in distress” nature of the institutions responsible. For example:
The Department of Cooperative Governance and Traditional Affairs (COGTA) says “all is not well” with several municipalities despite its interventions. The department was briefing the COGTA committee on its implementation of the municipal turnaround programme for dysfunctional councils across the country, which struggle to provide even the most basic of services like water and sanitation. Members of Parliament (MPs) have also raised the alarm about the level of dysfunction saying things have become worse in some cases.
The 10 most dysfunctional municipalities in the country were again the focus of discussion in parliament on Tuesday. These include Emfuleni municipality in Gauteng, Kopanong municipality in the Free State as well as Thabazimbi in Limpopo. Eastern Cape metros Buffalo City and Nelson Mandela Bay also find themselves on the list of 30 “priority distressed municipalities”.” (EWN 2025, online)
The COGTA Minister has in the current year particularly drawn attention to widespread financial mismanagement at municipalities, manifest inter alia
in inability to collect revenue and to pay outstanding debts. By the end of last year, municipalities owed Eskom R108 billion and water boards R24 billion. But, said the Minister, this situation is not entirely the fault of the municipalities:
“You can’t expect municipalities to clean our towns, to ensure they provide running water, but you don’t pay for the services. Municipalities are owed by departments at a provincial level and departments at a national level. And they are owed by business people and the citizens to whom they render services.” (Payne, 2025, online.)
None of this is a surprise. Some of the same municipalities have for a decade or more been identified as problematic. Media reports or court judgements name the same issues year after year. Each year, too, promises are made at national, provincial and local level as to how improvements will be effected – very seldom can this improvement be observed.
In addition to major fiscal transfers from national government (some conditional, some discretionary) in recognition of the income base of municipalities being too low to allow them to be financially selfsufficient, there have been many specific interventions. Some of these include amalgamation of municipalities, the (thus far limited) introduction of the District Development Model, the introduction of systems such as the Infrastructure Development Management System (IDMS) model designed to assist municipalities with project planning and management, among others.) The effort over many years put into the “capacity building” of officials and councillors has been massive, although, as Treasury concedes: “Many capacity building initiatives appear to not have materially impacted local government’s capability to deliver services and fulfil its mandate”.ii
Despite all these measures to support the existing municipal model, the service delivery performance of municipalities, on average, does not seem to improve – at least as evidenced by (i) the condition of infrastructure and (ii) the reports of the Auditor General. Notwithstanding the assistance noted above and many other interventions over more than two decades, the majority of municipalities have not shown any signs of the step change improvement in service delivery performance that is needed.
Data that unambiguously compares governance with service delivery, municipality by municipality, is difficult if not impossible to come by. But some confirmation of the influence of good governance on service delivery performance can be inferred from two ever-reliable indicators of service delivery, viz:
• The Green Drop, Blue Drop and No Drop certifications of the Department of Water and Sanitation (DWS), most recently in 2023.
• Arguably, though, the most comprehensive annual assessments of the state of South Africa’s local government, and the consequences for service delivery, are the Auditor General’s annual reports on municipalities in terms of the Municipal Finance Management Act (MFMA), the most recent of which covered the financial year 20232024. (Auditor General, 2025.)
Twenty-two municipal wastewater systems (of 850 systems) were awarded Green Dropsiii at the conclusion of the most recent round of assessments of “comparative analyses and diagnostics to assist Water Services Institutions to focus on specific areas for improvement and restoring functionality of wastewater infrastructure” – “a wastewater system that [equals or achieves] 90% Green Drop score, is regarded as excellent and is then allocated the prestigious Green Drop status.” (DWS 2022: x)
41 (of 257) municipalities received clean auditsiv from the Auditor General’s assessment of the 2023/2024 financial year (Auditor General
2025:4, 100) – admittedly not the same period as the DWS study “The audit period under review was 1 July 2020 to 30 June 2021.” (DWS 2022: x)
The 22 Green Drop wastewater systems were owned by only ten municipalities. It may be asked if all of these ten were among those 41 which received clean audits.
There is not an exact match, but certainly there is high correlation. Of the ten, six received clean audits and the remaining four came close. (For the list of Green Drop municipalities, DWS 2022: x.)
The Auditor General does not “review the performance of local government”, nonetheless “our work provides insight into weaknesses that could prevent service delivery goals from being achieved if they are not decisively addressed by the administration and the council.” Her 2025 report highlights four weaknesses:
• “Weaknesses in delivery of quality infrastructure and lack of maintenance.
• Inadequate procurement and contract management.
• Poor financial management.
• Widespread lack of consequences”. (Auditor General, 2025:62)
3. THE 1998 WHITE PAPER: BRAVE BUT FLAWED
It is surely obvious by now that some or all of the assumptions in the 1999 White Paper – the founding document of today’s municipalitiesv – were highly optimistic. In other words, the foundation of local governance is not strong enough to support the service delivery responsibilities that the Constitution states are among “the objects of local government”.
It has long been apparent that government has needed to take a fresh look at the 1998 White Paper, review the assumptions it made, and come up with a radically improved model. There would arguably be little prospect of significant service delivery improvement at many municipalities until this is done.
Any such review must take into account that a sizeable number of municipalities seem to manage pretty well under the circumstances, flawed model or not. Which suggests:
• a one size fits all solution would be inappropriate; and
• it would appear that it might not be the institutional model which is necessarily always at fault, but the way in which it is often managed. vi Some years ago, Wall (2022a) argued that the institutional structure of local government is a fundamental obstacle to effective delivery of its mandated services and called for a comprehensive overhaul of the system through which these services are delivered. Now, more than 25 years after the adoption of the White Paper on Local Government, government appears to have come to a similar conclusion, recognising that piecemeal reforms and frequent minor adjustments, together with generous helpings of assistance to specific municipalities, have failed to address the system’s core deficiencies. (COGTA, 2025)
As stated in the relevant Government Gazette:
“The process of local government reform in South Africa faces two interrelated challenges:
• The persistent and deepening weaknesses of the local government system itself, and
• Policy implementation failure, evidenced by marginal improvements over the past 20 years despite four local government reviews, scores of recommendations, and many campaigns and interventions” (COGTA, 2025: 48).
It is useful to note a number of the reasons given by government as long ago as 2009 as to why an overhaul is needed. The first of the “four local government reviews” described in the Government Gazette is the most useful in this regard. This particular review “highlighted critical concerns,
including shortcomings in the following areas”:
• Accountability and participation.
• Instability in municipal administration (including “declining experience, poor relations between elected officials and administrators, and high vacancy rates”).
• Instability and inefficiency as a result of the two-tier system (district and local municipalities).
• “Underinvestment in infrastructure” and “a preference for new projects over maintenance”.
• “High outstanding debts and poor fiscal management”.
• “Capacity issues” (COGTA 2009, quoted in “Annex One” of COGTA, 2025: 55).
rrent review process is at the time of writing (June 2025) very much still at the stage of being set upvii. Of particular interest is the intention to have five “focus areas” of investigation, which, as currently envisaged, are:
• Finance and Infrastructure.
• Governance.
• Intergovernmental relations.
• Traditional affairs.
• Local economic development.
The size of the task facing those who will be responsible for these focus areas can be illustrated by reference to the assumptions made by the drafters of the 1998 White Paper. The distance in many cases between, on the one hand, the assumptions and, on the other, the reality of local government in 2025 South Africa (i) illustrates the well-meaning naïveté of the 1998 drafting team, and (ii) considerably helps to explain why so many municipalities have not been fully functional. In short, given the way the municipal powers and functions were defined in 1998, and bearing in mind the challenges so many of the then newly established municipalities had to face (for example, high unemployment, low rates base, and distance from major centres), they never had more than a limited chance of being functional.
There is not the space in this paper to consider all of the assumptions made in 1998. Hence only those assumptions in regard to one of the focus areas, one no doubt of fundamental importance and of great interest to IMESA members, viz “finance”, is selected, so that the “distance in many cases” referred to above can be illustrated.
For convenience of analysis, the broad topic of finance is dividedviii below into:
• adequate funding, for capital and operational purposes, and
• prudent budgeting – and effective spending.
4.1
The 1998 White Paper assumption evidently was that that municipalities would be able to raise substantial sums of the revenue they needed, mainly through service charges and property assessment rates. Moreover, “The emphasis was on delivering services and promoting development at local level. … The main municipal services, namely electricity, water, sanitation and waste removal, were a tool to assist in reducing poverty and racial and income inequality, raise living standard and facilitate economic opportunities. …… The 1998 White Paper further assumed that service tariffs would be set at levels that will be affordable for all households and that sufficient revenue would be generated to ensure financially sustainable municipalities.” (ANC 2021, page 1)
That is, there would be adequate funding, for capital and operational purposes, for financial viability while delivering on the municipality’s
Constitution-given mandate. These funds would come from the municipality’s own resources, transfers from national and provincial government other governments, and from private sources – in the form of revenue, grants, loans etc. Not forgetting the importance of credit control to help ensure the payment of revenues due.
Coupled with this, wasteful expenditure would be drastically reduced if not eliminated.
This assumption is evident from the following statements, each of which is immediately followed by the comment of the present author:
• Noting that “an important source of local own revenue are charges which are directly related to the provision of public services” (DPACD 1998a, page 89), the White Paper (i) referred to a “new system of intergovernmental transfers aimed at subsidising the operating costs of basic services to indigent and low-income households”ix and (ii) listed “a set of principles to guide tariff policy”, adding that the tariff policy must “ensure that indigent households have access to basic services”.
o Comment: All basic common sense, but the extent of indigence, the limited capacity to cross-subsidise from those able to pay for services, resistance to and avoidance of charges, and other complicating factors, do not seem to have been anticipated. (Also see the paragraph on credit control, immediately below.)
• The White Paper (DPACD 1998a, p89) presented a, with hindsight, wildly optimistic view of the credit control measures that would be possible, including that municipalities will “need to take strong measures to deal with those households who can afford to pay for services but are not doing so” … “Such action can include cutting off services or court action to recover debts”.
o Comment: It would seem that little thought was given by the drafters to the fierce resistance that cutting services might, and has, encountered, nor to the protracted and often inconclusive results of court action.
• The White Paper discussed the ability of “municipalities in rural areas” to raise from property taxes some of the revenue they would need, concluding that “a combination of revenue-generating options, including betterment taxes, will need to be explored further to secure the financial viability of rural local government. [And] consideration should be given to adding to the revenueraising powers of local government.” (DPACD 1998a, page 90 of 120)
o Comment: The prospects of raising significant revenue from rural areas have proven to be grossly overoptimistic.
• The White Paper described, in the briefest terms, possible grants to support the operating budgets of municipalities and to subsidise the capital costs of investment in municipal infrastructure. Of particular interest, the concept of the “equitable share” is introduced, the purpose of which would be to “only” “fund the operating costs of municipalities”, and it is further noted that “it should enable all municipalities to provide a basic level of services to low-income households in their areas of jurisdiction at affordable cost”, whereas
“a secondary principle will be effective administration infrastructure: the system should ensure that even the most resource-poor municipality is able to build a basic level of administrative infrastructure to allow it to govern its area effectively.” (DPACD 1998a, pages 90-92 of 120)
o Comment: With hindsight, the extent of operating budget assistance that many municipalities have proven to need was clearly not anticipated by the drafters of the White Paper. Nor was the widelyalleged propensity of many municipalities to use the Equitable Share for purposes other than providing a basic level of service to lowincome households.x
Whereas an evident assumption was that that municipalities would be able to raise substantial sums of the revenue they needed, mainly through service charges and property assessment rates, the White Paper should have more clearly foreseen, and if possible, compensated for:
• The very large numbers of desperately indigent residents, for many of whom even a token payment towards service charges would be unaffordable.
• The very large numbers of people who might be able to afford the charges, but would be unwilling to pay, and would try to avoid doing so by one or more of a myriad of means, including doctoring or bypassing meters (if they had meters) – or simply ignoring the bills and hoping for yet another amnesty for those in arrears (e.g ENCA 2022).
• That the ANC had, before 1994, been encouraging non-payment – e.g. the “Soweto rent boycott” and the boycott of Eskom charges. So for the party, on the basis that they now formed the government, to expect users to begin paying for services, was certainly optimistic. (Mufson, 2013)
As a result, from the time they were established, almost all if not all municipalities have experienced great difficulty in collecting the revenues due to them. This has been so both for the municipalities established postWhite Paper that cover large rural areas and those in the urban areas, not least in those parts of urban areas which had previously fallen under the jurisdiction of the Black Local Authorities Act. Evidence of widespread deprivation due to people being unable to pay for services rapidly emerged. In respect of water services, accounts have taken readers through issues such as the pre-1994 struggle-inspired resistance to paying services charges, affordability of households as opposed to unwillingness to pay (for political or any other reasons), attempts to use alternative technologies such as prepayment or flow restrictors (as opposed to flat rate charges or conventional meters), legal battles (e.g. Phiri in Soweto (Kotze 2010)) and protest actions.
The White Paper did not foresee, or did not foresee the extent of:
• irregular, and fruitless and wasteful expenditure – as reported year after year by the Auditor General, but with little apparent improvement;
• ineffective expenditure, where value for the expenditure is suboptimum;
• poor revenue management;
• not paying contractors and suppliers on timexi;
• expenditure on consultants or contractors where the optimum would have been to rather employ competent staff (note: not by any means always possible);
• funds leaked away thanks to corruption, including nepotism and interference in contract awards;
• the extent to which municipalities mismanage infrastructure (e.g. water leaks not attended to) and thus, apart from the infrastructure not delivering the services for which it was intended, potential revenue not being realised (e.g. revenue from the sale of the water which has leaked) while costs are incurred nonetheless (e.g. the bulk water supplier, such as Rand Water, still has to be paid, even though the water it supplied to the municipality has been wasted);
• the many instances of community resistance to issues around service charges – e.g. protests against tariff increases, and protests (and sometimes physical opposition) against introduction of or change in type of meters – some of which have resulted in the damage, sabotage or theft of infrastructure.
As a consequence, the White Paper did not foresee the generally parlous financial state to which a large number of municipalities have been reduced.
The White Paper abounded in references to budgets, including issues such as the need for community participation in their preparation, that budgets which should be structured in a manner which ensures and allows for the budgets of “service units” to be “ring fenced”xii (DPACD 1998a, page 76), and that good budgeting and accounting practices must be followed. Importantly, a number of principles for a “new” “system of municipal finance” were set out. These included:
• “Sustainability: Financial sustainability requires that municipalities ensure that the budgets are balanced (income should cover expenditure). Given revenue constraints, this involves ensuring that services are provided at levels which are affordable, and that municipalities are able to recover the costs of service delivery.”
• Moreover: “No bailout will be provided to a municipality that overspends its budget and/or fails to put in place proper financial management controls.” (DPACD 1998a, page 25 of 120)
With hindsight, the White Paper overestimated the skills levels that most of the newly-demarcated municipalities would have available to apply to the task of drawing up budgets and thereafter managing the budgets and the spending thereof. The White Paper did not foresee, or did not foresee the extent of, the following:
• Budget allocations for capital works (irrespective of the source of the funding) being made without sufficient provision for operation and maintenance;
• Related to the above – budget decisions, and decisions on the receipt of grants (especially for capital works), being made on an ad hoc basis, not looking at the total financial picture of the entity and its long-term budget obligationsxiii xiv;
• The often gross under-budgeting for infrastructure maintenance, ignoring that this will inevitably result in higher costs (and service delivery interruptions) in the future (Wall 2022b);
• The inability of many service delivery institutions to spend their budgets, particularly their capital budgets (for a number of reasons, not least among them lack of skills and protracted supply chain management processes);
• The sometimes inordinate proportion of the operating budgets spent on staff, leaving too little budget available for operation and maintenance, for instance.
Between the statements of the President and the Minister, it would seem that government is more or less aware of the shortcomings of the 1998 White Paper. For example:
• The President has promised:
o “We will review the funding model for municipalities as many of them do not have a viable and sustainable revenue base.” (Ramaphosa, 2025)
• The Minister has been quoted as saying that:
o It is time to address “financial mismanagement and poor governance which are at the heart of municipal challenges.”
o COGTA and the Treasury are working together on scenarios to ensure that funding – grants to municipalities – is adequate. “A new funding model” will review municipal grant formulas and take into account situations such as previously disadvantaged municipalities. (Payne, 2025)
Rightly, though, comments such as those by Allan of Municipal IQ are timely. While a review of the funding model of local government is necessary,
“We need to understand the difference between an inadequate local revenue base and a municipality’s failure to collect revenue and run its financial affairs properly. …... Providing more money to poorly run municipalities, or for that matter bailing them out and paying off their enormous debts to Eskom and the water boards, without addressing underlying issues of poor decision-making, incompetence and poor capacity, may well result in a waste of national funds”, he said. (Payne, 2025)
On a similar theme: the Auditor General year after year describes many areas where the funding available to municipalities can be spent to better effect. Her reports on each municipality outline recommended improvements which would sometimes save tens of millions of Rand. Much of this saving is related to more appropriate purchasing or hiring choices, and also to supply chain management to obtain better value for money, and taking life-cycle costing into account when making capital purchases. But much of it is also related to money wasted in various other ways, particularly wasteful or even corrupt spending.
Finally for now: the Auditor General reminds us that an institutional review, however good, will not of itself improve service delivery of local government, if governance does not greatly improve.
“Three years into the administrative term, municipal finances are severely troubled and, even though funds are constrained, mayors, councils and municipalities are often displaying little fiscal discipline. Money paid by residents and funded from the national purse is often wasted through poor financial and procurement decisions and project failures. …. There is a lacklustre approach in dealing with recoveries and consequences in local government, which creates a culture that lacks responsiveness, consequences and accountability. Without confronting and rectifying this behaviour, progress will not be made.” (Auditor General, 2025: 4-5) Moreover:
“Despite continued advocacy for intergovernmental support and collaboration, the opposite is evident in the lack of partnership among the three spheres of government at most municipalities and in the weak oversight by provincial legislatures and Parliament – particularly at metros. Where the political leadership of municipalities respond well to the support and guidance provided by national and provincial government, improved governance follows.” (Ibid)
The South African municipal model of today is different in its execution –but not all that different in concept – to that of, say, 100 years ago.
The two major differences are:
• the democratisation of municipalities: the abolition of gender and racial barriers and the removal of requirements such as the need to own property, both barriers of the past to being eligible to vote; and
• the changes in number of municipalities, and the expansion of the municipal model to the whole country – i.e. that all areas of South Africaxv would be covered by municipalities.
On the latter: “The founding 1995/6 local government elections [had] ushered in 843 transitional local authorities from a fragmented 1262 apartheid era municipalities. … The first democratic local elections in 2000 resulted in wall-to-wall democratic local government structures with 284 municipalities, and after some amalgamations today there are 257 municipalities.” (ANC 2021, page 1)
What did not change much, if at all, was the then existing and familiar municipal model – its overall governance structure, its range of responsibilities, its sources of revenue. Neither the 1998 White Paper nor the Demarcation Act specifically addressed this – reading them today,
it is apparent that they imply it is the then existing model that would be expanded to cover the country.
It is the author’s perception that, this time round, major changes will be coming to the municipal model itself.
For one thing: whereas it is evident that, usually because of the socioeconomic circumstances of the areas they serve (read “poverty”), or because of their remoteness, or both, “many municipalities lack the technical skillsxvi and resources required to meet people’s needs”, they can no longer be expected to provide a full range of services as mandated by the Constitution. A municipality in remote Mpumalanga cannot be expected to provide the same services as one of the bigger metropolitan municipalities. Yet, for the last quarter of a century, it has been expected to perform, despite all its shortcomings.
The South African municipal model is to a great extent a colonial importation from the UK, where it was developed in a time and set of circumstances very different to 21st-century South Africa. The author suggests that the opportunity should now be grasped to begin by notionally separating (i) the current set of local government services from (ii) the concept of municipalities. Then, following the precept of “form follows function”, consider afresh what form of institution is best suited to delivering each of the services in one of a number of conceivable circumstances (“circumstances” particularly including socio-economic context, and location (especially rural/urban)).
Where a municipality is unable to or does not wish to be responsible for specific services, it could, with the approval of the provincial MEC and national Treasury, consider alternative delivery vehicles. These could include other local municipalities, district or regional municipalities, regional bodies responsible for single functions (e.g. regional water utilities, a concept proposed by DWS from time to time; or something akin to the regional electricity distributors (REDs) proposed in the past); private sector (big companies through to micro level, as best suited) or public-private partnerships; or community-based bodies. There are many possibilities. Another possibility would be to separate the “responsibility” from the “provider” function, as is currently the case with water services authorities and water services providers.
At present, an alarming number of municipalities require the assistance of external parties to perform their basic functions. For examples: secondments from the Municipal Infrastructure Support Agent (MISA), the District Development Model, Section 139 interventions, and the City of Johannesburg’s “Bomb Squad”. That a large and increasing number of institutions, adequately (supposedly) designed to provide a specific range of services, are unable to do their work without considerable assistance, is surely sufficient proof that radical redesign is needed.
The author hopes that from the recently commenced local government review process will emerge a model (or models) for the delivery of services currently regarded as the responsibility of municipalities, that is sufficiently robust to not require any of the current (or similar) “Band Aid” interventions.xvii
It is trusted that those responsible for the current local government review will consider these and related matters.
It is at least highly possible, if not probable, that municipalities in South Africa will be radically transformed in both form and function. The impact of these changes on municipalities – and on councillors and municipal staff – will very likely considerably exceed the impact of all the changes between 1994 and 2025.
It is therefore good to know that IMESA is participating in the review.xviii IMESA must seek to play a prominent part in determining the future of
local-level public sector service delivery in South Africa, and, along with this, the future of its members and the future of IMESA itself.
A thick skin will be needed. Tens of thousands of municipal employees, office-bearers and the like, many IMESA members among them – also contractors to municipalities – will, rightly or wrongly, perceive that threats to their livelihood will lurk in any restructuring proposals.
African National Congress (ANC). 2021. ANC local government barometer 2021. November 2021.
https://www.anc1912.org.za/wp-content/uploads/2021/10/ANC-LGBarometer-1st-Edition.pdf
Auditor General South Africa. 2025. Consolidated general report on local government audit outcomes 2023-24.
https://cisp.cachefly.net/assets/articles/attachments/94895_final_2023-24_ mfma_gr_28_may_2025.pdf
Department of Cooperative Governance and Traditional Affairs. 2025. Review of the White Paper on Local Government. In Government Gazette No 52498, 10 April 2025.
https://www.gov.za/sites/default/files/gcis_document/202504/52498 gon6118.pdf
Department of Provincial Affairs and Constitutional Development. (DPACD 1998a.) The White Paper on Local Government. 9 March 1998. https://www.cogta.gov.za/cgta_2016/wp-content/uploads/2016/06/ whitepaper_on_Local-Gov_1998.pdf
Department of Provincial Affairs and Constitutional Development. (DPACD 1998b.) The Local Government Municipal Demarcation Act 1998 (Act 27, 1998) Government Gazette, 3 July 1998.
https://www.gov.za/sites/default/files/gcis_document/201409/a2798.pdf
Department of Water and Sanitation. 2022. Green Drop National Report 2022.
https://wisa.org.za/2022/04/01/green-drop-2022-report-release/
ENCA 2022. Illegal connections | Tshwane launches amnesty programme Sunday 31 July 2022.
https://www.enca.com/news/illegal-connections-tshwane-launchesamnesty-programme
EWN. 2025. COGTA says dysfunction persists in several municipalities despite interventions. 18 February 2025.
https://www.ewn.co.za/2025/02/18/cogta-says-dysfunction-persists-inseveral-municipalities-despite-interventions
Koeble, T, and LiPuma, E. 2010. Institutional obstacles to service delivery in South Africa. Social dynamics: a Journal of African studies. https://www.tandfonline.com/doi/full/10.1080/02533952.2010.518002? scroll=top&needAccess=true
Kotze, L J. 2010. Phiri, the plight of the poor and the perils of climate change: time to rethink environmental and socio-economic rights in South Africa. Journal of Human Rights and the Environment, September 2010, pages 135-160.
https://www.researchgate.net/profile/Louis-Kotze/ publication/236165976_Phiri_the_Plight_of_the_Poor_ and_the_Perils_of_Climate_Change_Time_to_Rethink_ Environmental_and_Socio-economic_Rights_in_South_Africa/ links/5707a27e08aed09e916d14c3/Phiri-the-Plight-of-the-Poor-andthe-Perils-of-Climate-Change-Time-to-Rethink-Environmental-andSocio-economic-Rights-in-South-Africa.pdf?origin=publication_detail&_ b25Eb3dubG9hZCIsInByZXZpb3VzUGFnZSI6InB1YmxpY2F0aW9uIn19&__ cf_chl_tk=Yb2_e_eRnuVyxeWU5N_n7NquJwrdULAhoSjr1sYuRhY1754399716-1.0.1.1-O8T0lbpBqn18vc40vzd1Be6xCosdxHcv0IGQqJjusrI
Mufson, S. 2013. A boycott on paying electricity in Soweto outlives even Nelson Mandela. Washington Post. 21 December 2013. https://www.washingtonpost.com/world/africa/an-electricity-boycottin-soweto-outlives-even-nelson-mandela/2013/12/21/0cf181f2-68cc11e3-ae56-22de072140a2_story.html
Payne, S. 2025. ‘Time to pay up,’ Cogta Minister Hlabisa tells municipalities as government reviews funding models. Daily Maverick. 23 February 2025. https://www.dailymaverick.co.za/article/2025-02-23-time-to-pay-upcogta-minister-hlabisa-tells-municipalities-as-government-reviewsfunding-models/
Ramaphosa, C. 2025. State of the Nation Address. 6 February 2025. https://www.dailymaverick.co.za/article/2025-02-06-president-ramaphosas2025-state-of-the-nation-address/?utm_source=Sailthru&utm_ medium=email&utm_campaign=first_thing
Still, D, Walker, N and Hazelton, D. 2009. BASIC SANITATION SERVICES IN SOUTH AFRICA Learning from the past, planning for the future. Water Research Commission. WRC Report No. TT 414/09 September 2009 https://www.fsmtoolbox.com/assets/pdf/107_-_TT_414.pdf
Treasury, Public Affairs Research Institute (PARI) and Government Technical Advisory Centre (GTAC). 2022. “System of capacity building for local government – diagnostic review.”
https://www.treasury.gov.za/publications/other/National%20 Treasury%202022%20System%20of%20Capacity%20Building%20for%20 Local%20Government%20Diagnostic%20Review.pdf
Wall, K; Watermeyer, R; and Pirie, G. 2013. Wagging the dog: Supply chain management and service delivery. IMESA, September 2013, page 46.
Wall, K. 2022a. The 1998 ‘mini-Constitution’ for local government: A review of the assumptions of the White Paper on Local Government. Acta Structilia, 29(2) pp. 260-292.
Wall, K. 2022b. Concerning municipal maintenance expenditure. Paper presented at annual conference of the Institute of Municipal Engineering of Southern Africa. Kempton Park. November 2022. Published in the conference Proceedings.
i The pages have no numbers. References in this paper to "page numbers" in DPACD 1998 are to the sequence of the page within its 120 pages.
ii Treasury, PARI and GTAC. 2022. “System of capacity building for local government – diagnostic review”. Pg iii.
iii Choosing Green Drop over the more recent Blue Drop, which is the assessment of water systems because much of the credit for those belongs to the water boards which abstract raw water, treat it, and supply it to municipalities –whereas wastewater systems are solely the responsibility of municipalities, water boards not being involved (with few exceptions).
iv A "clean audit" means "unqualified with no findings".
v The Minister (of Provincial Affairs and Constitutional Development) of the time referred to the White Paper as "almost [being] regarded as a miniconstitution for local government". (DPACD 1998: 6)
vi The differential performance of municipalities as measured by the Auditor General each year provides many illustrations of this – how one municipality is capable of certain functions, whereas another fails hopelessly. But there are many other suitable illustrations. One that the author has previously documented (Wall, Watermeyer and Pirie, 2013) was a survey of the efficiency of capital goods procurement by municipalities. It turned out that the average time elapsed between advertising and issuance of a letter of intention to appoint ranged between seven months and seven weeks! The same regulations applied. But the competence of the one municipality far surpassed that of the other.
vii The Minister has stated that he wants to see rapid progress, because: "By April 2026, we want to present before Cabinet a revised and updated White Paper that will be responsive to the needs and challenges to fix our municipalities". (Payne 2025, online.)
Thus, it is certain that, by the time of IMESA’s 2025 conference, considerably more will be known about government intentions and the direction the reform is likely to take.
viii These two bulletpoints are surely two sides of the same coin!
ix What would become the Equitable Share.
x “However the Equitable Share is an unconditional grant and in practice this is not seen by local government as funding that has to be spent on operation and maintenance of basic services, and a significant portion is used simply to cover the overhead costs of municipal management and administration.” (Still et al 2009, p vi)
xi Creating cash flow problems for those not paid – to the extent that many firms, even some with annual turnovers in the R100-millions, have been forced into liquidation.
xii A sentiment reiterated by President Ramaphosa this year. (Ramaphosa, 2025)
xiii It is not as if suitable modelling techniques to do scenario planning on the basis of alternative financial and infrastructure investment decisions have not been available for many years. For example the Combined Services Model developed for the DBSA of the order of two decades ago, but which did not gain the anticipated acceptance reportedly because its recommendations were not liked by politicians with (using the phrasing of COGTA 2009, as quoted in COGTA 2025) “a preference for new projects over maintenance”.
xiv Exacerbated by these grants sometimes having been spent on assets which are not core to the municipal function – e.g. food processing plants, taxi ranks, and shopping centres – where the municipality, without the expertise to do so, has taken up the role of driver of local economic development as opposed to the enabling role that is envisaged for it in policy.
xv The phrase "wall-to-wall", which has since come into common currency, did not appear in either the 1998 White Paper on Local Government or the Demarcation Act which followed.
xvi "During one of our interviews a rural municipal manager remarked that "it is impossible to even get an engineer in this area. … They do not want to live here. I don't blame them", he sighed." (Koeble and LiPuma", 2010:589 (footnote))
xvii This is a point of view which appears to be contrary to that of President Ramaphosa, who promised government "would expand our support to
municipalities that require assistance". (Ramaphosa 2025.)
Would it not be preferable to rather design models that will be fully functional, rather than even be considering models which will require external help from the word go?
xviii IMESA representatives attended a COGTA-hosted LGWP review session in June 2025 which focused on aspects of Governance, Infrastructure, Economic Development, Traditional Leadership and Financial Management. The feedback will be shared with EXCO members at the next meeting in July 2025." (Botton, personal communication.)
Manuel Krauss1, Matthias Hirt1, Henry Risse1, Peter Maurer2 , Ivo Pfaffenberger2, Alea von Grote3, Jens Dautz3, Issa Hansen4 ,
Mkhuseli Nongogo5, Jonathan Clarke5, Chris Swartz6, Nelson Odume7 .
1Research Institute for Water Management and Climate Future at RWTH Aachen University (FiW e.V.)
2Institute for Sanitary Engineering, Water Quality and Solid Waste Management, University of Stuttgart
3TERRA URBANA Regional development company GmbH, Berlin, Germany
4SEBA Hydrometrie GmbH & Co. KG, Kaufbeuren, Germany
5Buffalo City Metropolitan Municipality, South Africa
6Chris Swartz Water Utilisation Engineers, Cape Town, South Africa
7Institute for Water Research, Rhodes University, Makhanda (Grahamstown), South Africa
ABSTRACT
Water reuse is a key strategy to enhance water security in drought-prone regions such as South Africa. The ecReUse project demonstrates how targeted, energy-efficient upgrades of existing wastewater treatment plants (WWTP) can unlock new reuse potentials while reducing operational costs. At the East Bank WWTP in East London, a modular demonstration plant was implemented to test and showcase three integrated measures: enhanced
primary treatment with anaerobic sludge digestion and biogas recovery, a containerized membrane bioreactor (MBR) for high-quality effluent production, and continuous sand filtration for agricultural reuse. Together, these modules aim to improve effluent quality, reduce energy demand, and provide up to 15m³/day of reuse-ready water. The flexible, small-scale setup allows real-world performance testing, supports operational training, and serves as a blueprint for scalable and locally adapted reuse solutions. The results will inform future strategies for sustainable wastewater reuse and capacity development in South Africa and similar urban contexts facing water stress and infrastructure challenges.
South Africa is one of the most water-scarce countries in the world, with an average annual precipitation of approximately 450mm (Botai et al., 2018). Regional differences are stark: while the arid northwest receives less than 200mm per year, the wetter southeast can experience up to 1,000mm annually (Lynch, 2004). Historically, South Africa’s rainfall patterns have followed long-period cycles of wet and dry periods (Malherbe et al., 2016; Du Plessis & Kibii, 2024). However, recent studies suggest that these cycles are becoming increasingly irregular due to climate change, with potentially severe consequences for water availability (Ndlovu et al., 2021; Kruger, 2025).
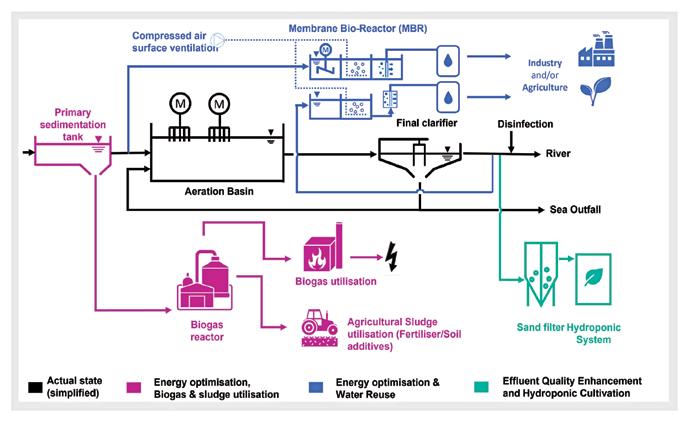
FIGURE 1: Process flow diagram of the East Bank WWTP showing the three optimization measures: (1) Energy optimization, biogas and sludge utilization; (2) Energy optimization and water reuse; (3) Effluent quality enhancement and hydroponic cultivation.
Regions highly dependent on surface water are particularly vulnerable. A prominent example is the Buffalo City Metropolitan Municipality (BCMM), whose water supply relies almost entirely on surface water sources (Buffalo City Metropolitan Municipality, 2022a). Rapid urban growth, ageing infrastructure, an unstable energy supply, and recurring droughts are putting the region’s water security under mounting pressure. Structural and operational challenges in the wastewater sector can result in partially treated effluents reaching natural water bodies.
In this context, the reuse of treated wastewater is an increasingly promising strategy for enhancing the resilience of urban water systems. Technological advances in water treatment now enable the production of tailored water qualities—from agricultural irrigation water to ultrapure process water for industrial applications. Simultaneously, improvements in energy efficiency and the integration of on-site renewable energy generation (e.g., photovoltaic systems) offer opportunities to reduce operational costs and promote sustainable, circular use of local water resources.
The research and demonstration project ecReUse addresses these challenges by redesigning a conventional South African WWTP into an energy-efficient, multifunctional water reuse facility. The East Bank WWTP in Nahoon, East London, serves as the pilot site. Originally built in the 1980s, the plant has a design capacity of 40 million litres per day and operates using the widely adopted activated sludge process.
The ecReUse project focuses on targeted upgrades to increase both energy efficiency and water reuse potential of the East Bank WWTP.
Three key technical interventions are being piloted at a small scale:
• energy optimisation through primary sedimentation and anaerobic sludge digestion,
• advanced treatment using a MBR system,
• continuous sand filtration to produce irrigation-grade water.
All three components are implemented as modular pilot units to allow flexible testing and demonstration. The solutions developed and tested in ecReUse are intended to inform future upscaling, policy development, and the implementation of resilient, decentralised water reuse strategies in similar urban contexts.
The technical transformation of the East Bank WWTP is structured into three key optimization measures, which are illustrated in the process flow diagram of the plant in Figure 1.
The existing WWTP comprises a conventional activated sludge system designed for municipal wastewater. The process line begins with inlet works that include mechanical screens and grit removal units, ensuring the removal of coarse solids and inert materials. Pre-treated influent then
flows into aeration basins equipped with surface mixers, which provide the necessary oxygenation and mixing for biological treatment. The effluent from the aeration stage is directed to final clarifiers for solid-liquid separation. A disinfection unit is installed downstream of the clarifiers to reduce pathogen loads before discharge into the receiving environment.
The first measure addresses energy consumption, a major cost factor in many South African WWTPs operating with conventional activated sludge systems. In many such plants, the lack of primary sedimentation leads to excessive chemical oxygen demand (COD) in the biological treatment stage, increasing oxygen requirements and, consequently, electricity consumption. To address this, the ecReUse pilot at the East Bank WWTP includes a dedicated primary sedimentation tank to demonstrate the energy-saving potential of this measure and to evaluate its integration with downstream biogas production. The stainless-steel tank, with a volume of 10m³ and a hydraulic capacity of 10m³/h, enables the separation of settleable solids and the diversion of primary sludge into an anaerobic digester. The anaerobic reactor, with a volume of 2m³ and a hydraulic retention time of approximately 20 days, ensures effective sludge stabilization and a steady biogas production of around 600 litres per day.
To maintain optimal operating temperatures, the reactor is heated by an external electric unit wrapped around the vessel, while a high-performance thermal insulation layer minimizes heat loss. In addition, a time-controlled centrifugal pump ensures continuous internal circulation, promoting uniform temperature distribution and stable digestion conditions. The biogas generated can be used in a combined heat and power unit to partially offset the plant’s electricity demand. By reducing the organic load entering the activated sludge tank, the oxygen demand for aerobic degradation is lowered, resulting in potential energy savings of up to 30%. The integration of anaerobic digestion further supports decentralized sludge management and resource recovery. Additionally, it reduces the amount of excess sludge and improves the dewaterability of the digested sludge.
Production of high-quality reuse water via containerized membrane bioreactor (MBR)
The second intervention focuses on the production of high-quality effluent suitable for reuse in industrial applications. For this purpose, a pilot-scale MBR is housed in a 40-foot high-cube shipping container. The system comprises two parallel treatment lines that differ in membrane configuration and biological pretreatment. In one line, a dry-installed ultrafiltration membrane is used, while the other features a submerged “seaweed-type” membrane module. Figure 2 illustrates the process flow of both MBR lines. The two configurations differ in terms of energy consumption, transmembrane

FIGURE 2: Process flow diagram of the two parallel MBR treatment lines installed in a 40-foot container. Line A uses a dry-installed ultrafiltration membrane, whereas Line B applies a submerged “seaweed-type” membrane. The setup allows comparative assessment of energy use, operating conditions, and membrane cleaning needs under realistic conditions.
pressure requirements, and membrane cleaning strategies. Their parallel operation enables direct performance comparisons under in situ conditions.
The treated water meets high-quality standards suitable for demanding industrial applications, such as boiler feed water or high-grade process water. Effluent quality is aligned with international reuse criteria, enabling safe and efficient reuse. Remote control and monitoring of the MBR system are enabled via an integrated control cabinet with both local and online access. In future extensions, the system could be complemented by a reverse osmosis (RO) unit, allowing the production of fully demineralized water (e.g. for ultrapure applications in automotive, energy or electronics industries).
Effluent quality improvement and Agricultural reuse via continuous sand filtration and hydroponic demonstration
To complement the industrial reuse pathway, a third line focuses on agricultural water reuse. A continuous sand filtration system is installed to produce effluent suitable for irrigation and hydroponic cultivation. The filter consists of a downward-flowing sand bed with integrated sand washing, which ensures continuous operation without the need for backwashing. This process provides a stable effluent quality, even under fluctuating influent loads, and can be enhanced with activated carbon to remove micropollutants such as pesticides or pharmaceutical residues.
On the premises of the treatment plant, a hydroponic demonstration system is set up to evaluate the feasibility and safety of agricultural reuse. The system allows for controlled cultivation of crops using the filtered effluent, enabling researchers to address several key questions: How can nutrients recovered from wastewater be effectively used in hydroponics? What are the risks related to water and food safety in recirculating agricultural systems? And what type of management, monitoring, and governance structures are required to ensure safe and acceptable reuse? Figure 3 shows an example of crop cultivation using a closed-loop hydroponic setup based on the Dutch Bucket system, implemented under arid conditions in Tunisia.
The aim is to develop a transferable model for the safe, water-efficient, and economically viable hydroponic reuse of treated wastewater. In addition to closing local nutrient cycles, the approach explores potentials to support urban agriculture and contribute to both food and fodder security under water-limited conditions.
An additional module addresses the challenge of real-time process control in low-resource settings. A camera-based monitoring system is implemented at the outlet of the WWTP to track effluent quality and quantity, supporting remote operation and maintenance. This digital solution allows decentralized monitoring without permanent staff presence or grid dependency and contributes to the robustness and autonomy of the overall system.
Together, these upgrades form a comprehensive platform for evaluating technical performance, integration potential, and reuse viability. Beyond their immediate technological purpose, the pilot units are also used as
hands-on training environments for engineers, operators, and technicians. By embedding capacity development into the demonstration, ecReUse aims to foster long-term operational know-how and support the diffusion of innovative wastewater technologies across the region.
3.1
As of mid-2025, the core infrastructure of all four pilot modules – primary sedimentation and anaerobic digestion, MBR unit, continuous sand filtration, and off-grid monitoring – has been completed and is installed on site at the East Bank WWTP. The containerized MBR unit, including its dual membrane configuration, is fully assembled and placed on its designated platform.
The prefabricated stainless steel sedimentation tank and the downstream anaerobic reactor have been constructed and hydraulically connected to the existing inflow line of the biological treatment stage. Similarly, the sand filtration unit has been delivered and is currently being integrated into the water reuse line for agricultural purposes.
The electrical installation and the integration of control and automation components across all modules are scheduled for completion in Q3/2025. This includes the setup of the camera-based monitoring system, which will be used to track key operational parameters – such as flow rates, and turbidity – without the need for constant on-site supervision. Once finalized, the system will undergo a phased commissioning process, including hydraulic testing, sensor calibration, and functional checks for all subsystems. In parallel, a hydroponic demonstration unit is under construction adjacent to the treatment plant. This system will serve as a practical testbed for evaluating the suitability and safety of reclaimed water in controlled agricultural applications. The design allows for modular planting beds with integrated monitoring of water quality and nutrient uptake.
The physical implementation of the demonstration modules is nearly complete, and the project is entering a crucial transition phase from construction to commissioning and pilot operation. Figure 4 shows the pilot units already installed on the designated platforms at the East Bank WWTP.
The pilot modules implemented in the ecReUse project target substantial improvements in both water quality and energy efficiency. Drawing on prior research, literature benchmarks, and design specifications, several performance gains are anticipated for each module.
Primary Sedimentation and Anaerobic Digestion: The installation of a compact primary sedimentation tank upstream of the biological treatment aims to assess the potential for reducing the organic load – expressed as biochemical oxygen demand (BOD) – prior to aeration. If applied at full scale, this could lead to a reduction in overall energy consumption of up to 30%,

3: Example of closed-loop hydroponic systems for crop production. The setup enables efficient nutrient and water use through recirculation and localized drip irrigation and is particularly suitable for semi- arid and arid conditions.
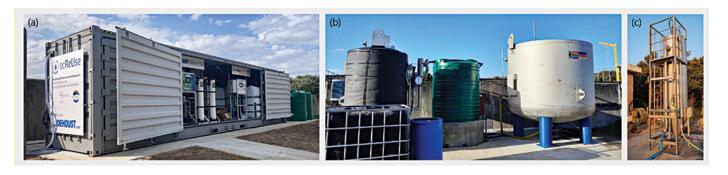
primarily by lowering the energy required for aeration. This figure remains theoretical and is subject to validation through pilot-scale experimentation. In the pilot setup, the separated sludge is further stabilized in an anaerobic reactor, which can generate up to 600L of biogas per day under optimal conditions. This biogas could potentially be used to offset auxiliary energy demands or, in future applications, be integrated into a combined heat and power (CHP) system.
Membrane Bioreactor (MBR): The containerized MBR unit features two interchangeable membrane lines that will be operated in parallel and compared in terms of energy demand, fouling behavior, and maintenance effort. Effluent quality is designed to meet relevant international and/ or national standards for agricultural and industrial reuse applications, including target thresholds of <10mg/L BOD, <10mg/L TSS, and pathogen removal >5 log units. The expected specific energy demand ranges between 0.6 and 0.9kWh/m³, depending on membrane configuration and influent load.
Continuous Sand Filtration: As a tertiary polishing step, the sand filter provides additional particle and turbidity removal, stabilizing water quality for agricultural reuse. The unit is designed to maintain turbidity <1NTU and TSS <2mg/L under standard conditions. The filtration performance is being monitored, with optional capacity for granular activated carbon (GAC) addition to further reduce micropollutants and odors, if needed.
Hydroponic Reuse and Agricultural Application: The hydroponic demonstration unit will assess the safe and efficient use of reclaimed water in crop production. This includes monitoring nutrient availability (e.g., N, P, K concentrations), potential accumulation of contaminants, and overall system productivity (e.g., yield per m² per cycle). By recirculating nutrient-rich effluent, the system aims to reduce both water and fertilizer inputs, potentially improving water use efficiency by over 70% compared to conventional soil-based irrigation.
3.3 Technological Innovations and Integration Potential
The ecReUse project demonstrates how upgrades and optimization of WWTPs can address water scarcity, energy inefficiency, and aging infrastructure – key challenges in South Africa and other water-stressed regions. While currently containerized for flexible testing, the concept can be adapted for integration into existing plants. Stakeholders from agriculture and industry have shown strong interest, particularly in stable water supply and potential cost savings. Future success will most likely depend on factors beyond technology, including reuse regulations, operational robustness, and user acceptance. Open questions remain regarding long-term performance, economic viability, and concentrate management. To address these, the next phase includes system commissioning, performance monitoring, and
training. A monitoring plan will track energy use, effluent quality, membrane durability, and nutrient recovery, while the pilot also serves as a local capacity-building platform.
3.4
To ensure that the pilot’s lessons and technical know-how are effectively shared and adopted, we developed a structured dissemination and capacitybuilding strategy comprising four key activities. First, the pilot units will be commissioned in close collaboration with the municipal wastewater operations team. During the startup phase, local staff will receive intensive, hands-on training on each demonstration module and will then assume primary responsibility for day-to-day operation. Second, a comprehensive suite of documentation – including slide decks for training sessions, stepby-step operating procedures, safety guidelines, and user manuals— will be provided to the local team. These materials will support both the commissioning process and long-term plant operation.
Third, dissemination will be tailored to the main stakeholder groups— municipal plant operators, water management decision-makers, industrial end-users, and the international technical community. Once installation and staff training are complete (scheduled for Q1 2026), the pilot plant will enter a three-month performance testing phase. Following this evaluation period, insights and performance data will be shared through innovation forums and hands-on technical workshops aimed at representatives from interested utilities and industry partners. These events will feature guided site tours, system demonstrations, and interactive sessions on topics such as WWTP energy-optimization strategies, anaerobic digestion, best practices in MBR and sand-filtration, and plant operation and maintenance. In parallel, specialized operator training courses will be developed for personnel from other utilities, equipping them with the skills needed to replicate and scale the ecReUse approach. Finally, project results will be published in peerreviewed journals and presented at international conferences, ensuring broad accessibility for researchers and practitioners.
The ecReUse project demonstrates how modular, integrative upgrades can transform conventional WWTPs into resource-efficient water reuse systems. By combining established technologies - such as primary sedimentation, MBR, and continuous sand filtration - in an energy-optimized configuration, the project addresses both environmental and operational challenges in the South African context. While the modular layout reflects the pilot character of the current setup, the implemented solutions are fully scalable and adaptable to a wide range of treatment plants and reuse scenarios. With commissioning now underway, the demonstration site at East Bank is set to become not only a testbed for innovative reuse technologies, but also a long-term training platform for engineers, plant operators, and technicians. This hands-on training component is essential to build local expertise,
ensure operational continuity, and facilitate broader adoption of advanced treatment and reuse strategies.
5. Acknowledgements
The project is funded by the German Federal Ministry for the Environment, Climate Protection, Nature Conservation and Nuclear Safety (BMUKN) under the Export Initiative for Environmental Protection and co-funded by Buffalo City Metropolitan Municipality.

6. REFERENCES
Botai, C. M., Botai, J. O., De Wit, J. P., Ncongwane, K. P., & Adeola, A. M. (2018). Drought characteristics over the Western Cape Province, South Africa. Water, 10(4), 386. https://doi.org/10.3390/w10040386
Buffalo City Metropolitan Municipality. (2022). Integrated Development Plan 2022/2023. https://www.buffalocity.gov.za
Du Plessis, J. A., & Kibii, J. K. (2024). Does rainfall trends and patterns of South Africa for the past century demonstrate climate change? Paper presented at the 2024 IMESA Conference, Cape Town.
Kruger, A. C. (2025). Analysis of rainfall trends in South Africa: 1921–2022. Climatic Change, 173(1), 45–62.
Lynch, S. D. (2004). Development of a raster database of annual, monthly and daily rainfall for Southern Africa (WRC Report No. 1155/1/04). Water Research Commission.
Malherbe, J., Dieppois, B., Maluleke, P., Van Staden, M., & Pillay, D. L. (2016). South African droughts and decadal variability. Natural Hazards, 80(2), 657–681. https://doi.org/10.1007/s11069-015-1989-y
Ndlovu, N., Hadebe, S. T., & Dube, T. (2021). Climate variability and water security in South Africa: Emerging evidence and future directions. Journal of Water and Climate Change, 12(3), 475–489. https://doi.org/10.2166/ wcc.2020.242
Giselle Pillay*, Thembekile Mdiya **, Neal Bromley *, Stephen Nash ** and Gervais Sery ** *JG Afrika (Pty) Ltd **Amathole District Municipality
Many municipalities across South Africa are under increasing pressure to improve water supply reliability and compliance, particularly where infrastructure failures at water treatment works (WTWs) and distribution systems which can result in service interruptions, poor water quality, and increased operational costs and health risks. Loadshedding, lack of standby equipment, ageing infrastructure, and limited operator support and underfunded routine operations and maintenance activities all contribute to unsustainable system performance.
In response, Amathole District Municipality (ADM) took a pro-active approach to the challenge by developing a structured, engineering-led strategy to unlock a portion of Municipal Infrastructure Grant (MIG) fundingspecifically the provision in Schedule 5, Part B of the 2023 National Treasury Guidelines, which allows municipalities with non-compliance directives from the Department of Water and Sanitation to allocate up to 10% of their MIG funding toward urgent repairs and refurbishments, provided asset-based evidence such as an Infrastructure Asset Management Plan is available.
Using existing Asset Management Plans, Water Safety Plans and Process Audits, along with condition assessments from engineering site inspections, JG Afrika, the project consultant, formulated a data-driven prioritisation framework. This framework was used to identify, justify and package high-impact infrastructure upgrades for rapid implementation. Priority interventions included the installation of standby pumping and dosing systems, safety enhancements for plant operators, and targeted refurbishment of critical mechanical and electrical components. These measures were designed to restore operational resilience, improve compliance with water quality standards, and reduce unplanned downtime. The initiative also included cost projections, implementation strategies, and socio-economic upliftment opportunities through supporting local suppliers and contractors where possible. This multi-layered strategy successfully enabled the unlocking of MIG funding and partnership with the Amathole District Municipality and JG Afrika developed a Rapid Response Unit which accelerated implementation timelines and initiated the stabilisation of water supply systems previously reliant on unsustainable emergency measures such as water tankering.
This work illustrates a scalable and replicable model for municipalities aiming to convert regulatory directives into actionable engineering solutions. The development of the ADM Rapid Response Unit demonstrates an approach that other municipalities can replicate to turn regulatory noncompliance into targeted investment opportunities. By aligning technical evidence and investigations with funding eligibility criteria, municipalities can reframe infrastructure risk as an opportunity for investment, while reinforcing broader goals of sustainability and service delivery equity.
Across South Africa, the reliable provision of potable water remains a critical developmental and public health priority. However, many municipalities face increasing difficulties in meeting national standards for water quality and supply reliability due to widespread infrastructure degradation, operational inefficiencies and financial resources. Water Treatment Works and pump stations have become focal points of concern. These facilities are increasingly plagued by infrastructure failures that contribute to frequent service interruptions, a decline in treated water quality, and a rise in operational costs. (Department of Water and Sanitation, 2023). These challenges are further compounded by recurrent electricity outages, vandalism, and ageing mechanical and electrical components. In addition, there are insufficient standby systems. This refers both to a lack of backup power generation capacity, such as diesel generators, and to inadequate or earlier failure of standby infrastructure in critical treatment processes. Together, these factors significantly compromise the operational resilience of these facilities (SALGA, 2022).
Recognising these sector-wide risks, the National Treasury introduced a key amendment to the 2023 Municipal Infrastructure Grant (MIG) Guidelines. Schedule 5, Part B of the Division of Revenue Act (DoRA) (Government Gazette No. 48017 of 10 February 2023) which enables municipalities to allocate up to 10% of their MIG allocation for urgent repairs and refurbishments of water infrastructure, provided the interventions are supported by data from Asset Management Plans and non-compliance predirectives or directives from the Department of Water and Sanitation (DWS).
The paper provides a replicable framework and approach that municipalities across the country can use to unlock conditional MIG funding, based on evidence-based prioritisation aligned with national compliance and sustainability goals. The framework contributes to the shift from reactive maintenance towards proactive, risk-informed investment in municipal water infrastructure improving water quality, service continuity, and public health outcomes.
Municipal water-services authorities (WSAs) are grappling with mounting Blue-Drop non-compliance, electricity instability, aging assets, and asset failure. In 2023 only 26 of the country’s 958 water-supply systems (2,7%) achieved full Blue-Drop certification, while 277 systems (29%) were rated “critical” and 46% of all supplies failed microbiological quality limits (DWS, 2023a). These Water Treatment Works are operating beyond their design life with severely degraded mechanical, electrical, and civil components. As a result, municipalities face increasing difficulty in meeting the compliance requirements of the Department of Water and Sanitation in terms of the SANS 241 National Standards for Drinking Water Quality and Blue Drop Certification Programme (DWS, 2023b).
A key challenge is the prevalence of equipment failures in critical treatment infrastructure, particularly at smaller or rural WTWs. Ageing pump sets, corroded pipelines, outdated electrical switchgear, and dosing systems
lead to frequent process interruptions and compromised water quality. In many cases, these facilities lack functional standby units, meaning that a single point of failure such as a dosing pump or motor control centre (MCC) panel can result in complete process failure. The absence of duty-standby configurations significantly reduces system resilience, forcing municipalities to revert to costly and temporary emergency measures such as water tankering or borehole abstraction.
Electricity outages have further exacerbated the situation. Unpredictable power disruptions impair the continuity of treatment processes, including chemical dosing, filtration, and disinfection. Many WTWs are not equipped with reliable backup power systems or automated switchover functionality, making them highly vulnerable to power supply interruptions. The resulting downtime undermines the municipality’s ability to meet basic service delivery mandates, while also exposing communities to water quality risks. This is further compounded over time by increased population and subsequent water demand in the supply system which has reduced the designed buffer storage in command and distribution reservoirs.
From a financial perspective, most municipalities face severe budget constraints, with operational expenditure prioritised for salaries, fuel, and emergency responses rather than long-term asset renewal. The misalignment between operational needs and capital budgeting processes means that critical infrastructure often remains unrepaired until it reaches total failure (National Treasury, 2023).
In some contexts, infrastructure vandalism and theft are a challenge. The lack of perimeter fencing, lighting, and security guards at water treatment facilities exposes critical assets to theft of cables, motors, and pipes often shortly after repairs have been completed. The resulting losses deepen the financial burden on municipalities and delay infrastructure recovery.
The cumulative effect of these challenges is a growing infrastructure backlog and a declining service delivery and operational performance in municipal water services.
Addressing these challenges requires a systematic and controlled approach rather than isolated technical interventions. It necessitates a structured, engineering-led approach to identify, prioritise, and implement infrastructure repairs based on risk, compliance, and service impact. The framework presented in this paper responds directly to this need, offering a methodology to operationalise the 10% MIG allocation in a manner that is both technically sound and administratively defensible.
ENGINEERING-LED PRIORITISATION FRAMEWORK FOR MIG FUNDING
Schedule 5, Part B of the Division of Revenue Act (DoRA) (Government Gazette No. 48017 of 10 February 2023) states “Municipalities with noncompliance pre-directives or directives from the Department of Water and Sanitation may use up to 10% of their MIG allocations for urgent repairs and refurbishments, provided data is based on asset management plans”. This enables municipalities to divert a portion of their capital MIG funding toward urgent refurbishment and rehabilitation works, traditionally not funded through MIG. This provision is not arbitrary but conditional, requiring municipalities to demonstrate regulatory non-compliance (e.g., Blue Drop failures or DWS directives) and to present supporting assetlevel evidence in the form of a verified Infrastructure Asset Management Plan (IAMP).
The approach undertaken is structured around a framework that integrates compliance requirements, asset management systems, and technical condition assessments to support municipalities in unlocking MIG funding for urgent repairs and refurbishments.
The process is initiated through the identification and analysis of noncompliance pre-directives and directives issued by the Department of Water
and Sanitation. These directives serve as formal notifications of infrastructure deficiencies or regulatory breaches and are explicitly referenced in the Division of Revenue Act as a necessary condition for MIG allocation. As such, they provide both a regulatory imperative and a prioritisation mechanism for remedial investment.
In parallel, the municipality must develop/have an Asset Management Plan (AMP) to consolidate information on the condition, function, and criticality of water infrastructure assets. The AMP includes asset registers, age profiles, maintenance histories, and performance indicators forming the data foundation for subsequent funding justification. This plan ensures that infrastructure interventions are not isolated responses, but part of a structured asset life-cycle management process.
With the municipalities AMP in place, targeted condition assessments were conducted across identified WTWs and pump stations which had been identified as high-risk assets. These assessments, led by civil, mechanical, and electrical engineering teams, evaluated the operational state of process units such as:
• Raw and clear water pumps
• Dosing equipment
• MCC panels and electrical switchgear
• Clarifiers and filters
• Pipework and valves
• Reservoirs
• Site security, staff facilities, lighting and fencing
An assessment team from the project consultant comprised civil, mechanical, and electrical engineers supported by the municipality’s operational staff, with field observations visited various strategic sites. The assessment validated against available historical incident logs, operators interviews and visual inspections.
The prioritised scope of work is then used to compile the MIG funding submission. This submission includes the AMP, directive documentation, technical assessment reports, cost estimates, and an implementation plan that outlines procurement strategies and EPWP job creation targets. Risk mitigation measures, environmental compliance considerations, and monitoring indicators are incorporated to ensure alignment with regulatory and transformation objectives.
Once approved, the implementation phase is managed using standard project controls, with progress tracked against defined performance indicators. Local SMMEs and community-based labour are prioritised, linking capital investment to local economic development.
Recognising the high incidence of theft and vandalism at remote and unsecured sites, the implementation sequence was adjusted, where possible, to first secure the physical environment before introducing highvalue mechanical and electrical equipment. As such, initial interventions focused on installing perimeter fencing, security lighting, and access control measures to safeguard the sites. These preventative works were essential to reduce the risk of asset theft and reoccurring damage, common issues that had previously resulted in repeated service interruptions and financial losses.
Once adequate site security had been established, the project proceeded with the installation of priority mechanical and electrical components, including pump refurbishment, MCC panel replacement, dosing system reinstatement, and the provision of standby pumps to restore core treatment functionality. This staged approach improved the longevity of the repairs and ensured that newly installed infrastructure would be protected from immediate compromise. Civil repairs, such as reservoir rehabilitation, the replacement of damaged doors and windows, and the repair of roof structures, were undertaken as a subsequent phase to restore
the structural integrity and operability of the facilities. This staged and riskinformed implementation strategy ensured that critical infrastructure was both protected and functional, enabling a sustainable return to service for affected Water Treatment Works and pump stations.
This framework transforms infrastructure non-compliance from a liability into a structured investment opportunity. It provides municipalities with a replicable, engineering-led approach to infrastructure renewal that is rooted in evidence, aligned with national policy instruments, and responsive to both technical and socio-economic imperatives within a prioritised approach.
RAPID RESPONSE UNIT – DEMONSTRATING IMPACT THROUGH URGENT INFRASTRUCTURE INTERVENTIONS
In support of the MIG-funded engineering prioritisation framework, the municipality’s and project consultant’s Rapid Response Unit provided fasttracked, technically informed interventions at high-risk water infrastructure sites. This response was able to stabilise failing water systems through evidence-based, phased and prioritized refurbishment works, especially in areas where water supply disruptions pose an immediate risk to public health, education, or basic services.
The following implementation examples demonstrates this Rapid Response Unit approach in action.
1. Rehabilitation of a Vandalised Rural School Pump Station
A remote booster pump station supplying a public school with 220 students
had become fully inoperative due to extensive vandalism and theft. The site inspection revealed that only a single pump casing remained, stripped of its motor, with no functional MCC panel and no standby pump in place. The command reservoir, designed to provide gravity-fed water to the school, was reportedly leaking and out of use, forcing the school to depend on a private borehole that was unable to meet demand. To address this, the Rapid Response Unit of the project consultant and the municipality executed an intervention. The site was first secured through the installation of fencing and solar lighting.
A simplified MCC panel was supplied and commissioned along with a new duty pump, electrical cabling, float switches, and pressure protection controls. To restore water access while long-term reservoir repairs are scoped, two elevated 2,500L Plastic tanks were installed and connected to a 600 m HDPE bypass pipeline. Structural works were also completed, including the repair of the pump house roof, doors, and windows to prevent future asset damage. This intervention restored water delivery and significantly reduced the risk of further theft.
A critical Water Treatment Works (WTW) was operating under significant risk due to corroded suction pipework and an outdated MCC panel with no active protection mechanisms. The condition of the infrastructure posed a high likelihood of unplanned shutdowns and pump motor failures, threatening the continuity of potable water supply to the surrounding
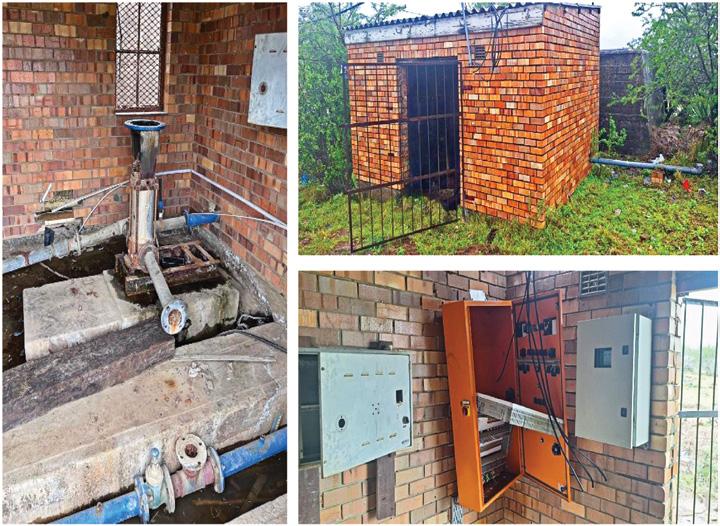
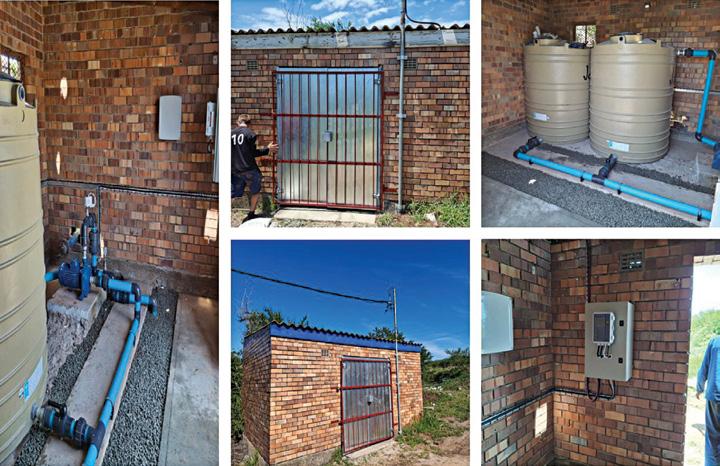
community. In response, the Rapid Response Unit conducted a scheduled 12-hour shutdown to facilitate the safe removal and replacement of deteriorated pipe sections and valves. Temporary pipework was fabricated on-site to allow continuous pump operation while coated permanent pipe spools were prepared off-site for future installation. A temporary MCC panel and distribution board were installed to maintain full power supply to the treatment units during the transitional phase. As part of the scope, Bermad pump control valves were serviced and calibrated to reintroduce pressure and flow regulation. This intervention ensured that operations remained uninterrupted throughout the works and set the groundwork for permanent system upgrades, pending access road improvements for equipment transport.
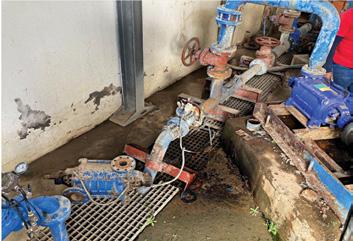
During a routine infrastructure assessment, a clear water reservoir servicing a local community was found to have a severely damaged roof, which compromised the quality of stored potable water. Holes in the roof allowed debris, insects, and light ingress, increasing the risk of microbial regrowth and non-compliance with potable water quality standards. The Rapid Response Unit prioritised an urgent retrofit to address the risk. The failing roof structure was dismantled and replaced with new galvanised portal steel frame and corrugated sheeting. A vapour barrier and wall-toroof sealants were installed to ensure a hygienic storage environment. To improve ventilation and reduce condensation within the reservoir, passive roof vents were incorporated into the design. A lockable access hatch was
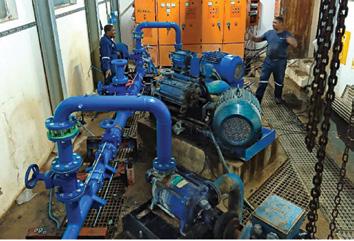
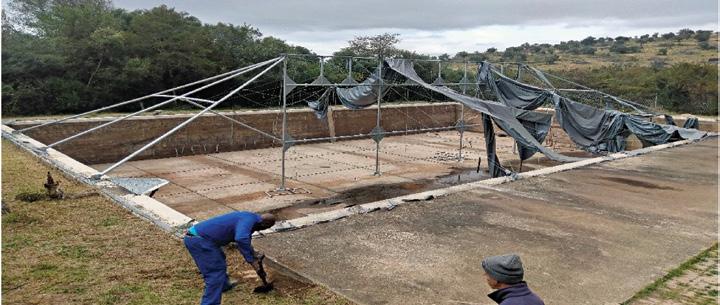
also included to comply with confined-space entry regulations. This work restored structural integrity, reduced water quality risk, and supported improved compliance with the Blue Drop regulatory standards.
The successes documented in ADM’s case are not solely attributable to the existence of the Rapid Response Unit (RRU), but rather to the enabling structure it provided. In principle, any municipality could achieve similar outcomes, provided it has internal capacity to undertake prioritised assessments, rapidly package compliant MIG submissions, and coordinate
implementation in a phased, risk-informed manner. However, in practice, the RRU model significantly enhances agility, technical oversight, and accountability. By embedding engineering expertise, contractor coordination, and municipal liaison into a dedicated unit, the RRU bridges the institutional gaps that typically delay or derail refurbishment efforts. Without such a unit, municipalities would need to rely on standard internal processes, which are often fragmented across departments and not optimised for urgent works. Thus, while the RRU is not the only route
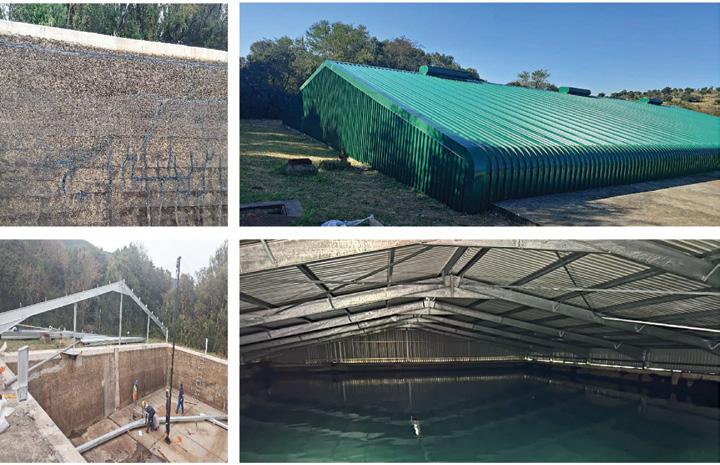
to success, it represents a replicable institutional mechanism to fast-track delivery and mitigate failure risk, especially under tight compliance and funding timelines.
The implementation of the engineering-led prioritisation framework for urgent water infrastructure refurbishment yielded a number of significant outcomes, both in terms of operational performance and institutional capacity.
The phased and prioritised approach is key to preventing knee-jerk responses to infrastructure breakdowns. Instead, it enables the strategic investment of limited funds based on engineering risk assessments. By beginning with condition assessments and risk profiling, followed by physical site security, and then mechanical, electrical, and civil upgrades, the approach delivered measurable improvements in infrastructure performance. Targeted interventions at key water treatment works and pump stations restored core treatment capacity, improved process reliability during electricity outages, and reduced the frequency of emergency service disruptions such as water tankering. The inclusion of standby pumps and MCC panels allowed for more consistent service delivery even during adverse operating conditions.
By addressing security vulnerabilities upfront, including fencing, lighting, and controlled access, the municipality was able to significantly reduce the reoccurrence of theft and asset damage during and after implementation. This not only protected the capital investment but also improved operator safety and community trust in municipal services.
The use of DWS directives, asset management plans, and structured condition assessments provided a credible and auditable foundation for the MIG funding application. This strengthened the municipality’s engagement with national and provincial stakeholders, improved compliance with regulatory instruments, and fostered a culture of proactive maintenance planning rather than reactive response.
Most importantly, the framework has demonstrated that a replicable model for emergency water infrastructure recovery can be operationalised within existing policy and funding mechanisms. With appropriate project management & controls, technical support, and financial management municipalities elsewhere can adapt this model to develop their own regulatory, financial, and operational contexts in the form of a Rapid Response Unit.
Water infrastructure failure remains a persistent barrier to equitable service delivery in South Africa’s municipalities. However, the revised MIG funding provisions offer Municipalities a significant opportunity to address these challenges through targeted technical interventions. These interventions are guided by risk rankings derived from asset condition assessments, compliance urgency (as indicated in DWS directives and Blue Drop audit findings), and implementation feasibility. Persistent non-compliance with SANS 241 National Standards for Drinking Water Quality and the low achievement of Blue Drop certification across the country underscore the
urgent need for structured and timely upgrades (DWSc, 2023a; SANS, 2015).
The Rapid Response Unit, developed in partnership with the Amathole District Municipality and JG Afrika, enabled the implementation of urgent infrastructure upgrades and repairs aimed at restoring both treatment functionality and regulatory compliance and ultimately improving service delivery to the consumers in the ADM supply region.
The development of the ADM Rapid Response Unit is an approach that can enable other municipalities to replicate to turn regulatory non-compliance into targeted investment opportunities. It uses operational risks, such as those highlighted in Blue Drop assessments, as a trigger to implement sustainable improvements in service delivery. By integrating existing asset management data, engineering expertise, and funding criteria, municipalities can proactively address infrastructure deficiencies while advancing broader developmental goals, including public health protection and service equity.
To strengthen municipal water infrastructure resilience and improve compliance with SANS 241 and the Blue Drop Certification Programme, it is recommended that future MIG-funded interventions adopt a structured, phased approach beginning with site security, followed by critical mechanical and electrical upgrades, and lastly, civil repairs. Municipalities should institutionalise Asset Management Plans (AMPs) as living tools to guide funding justification and ensure alignment with DWS compliance directives and Blue Drop audit requirements. Establishing dedicated Rapid Response Units can accelerate urgent works at high-risk sites, reduce system downtime, and safeguard infrastructure from recurring vandalism and theft. Furthermore, the integration of local SMMEs and EPWP labour should be prioritised to enhance socio-economic impact and community ownership. Standardising these practices across municipalities can enable national replication, improve service reliability, and support long-term, sustainable infrastructure recovery.
Department of Water and Sanitation (DWS). (2023a). Blue Drop Progress Report 2023: National Overview of Drinking Water Quality Compliance Pretoria: Department of Water and Sanitation.
Department of Water and Sanitation (DWS). (2023b) National Blue Drop Guidelines. Pretoria: DWS.
Department of Water and Sanitation (DWS). (2023c) Annual National Water and Sanitation Master Plan Progress Report. Pretoria: Department of Water and Sanitation.
National Treasury (2023) Municipal Infrastructure Grant (MIG) Policy Framework and Implementation Guidelines. Pretoria: National Treasury.
SALGA (2022) State of Municipal Infrastructure Report. Pretoria: South African Local Government Association.
MB Wiese, Karen King
1 AECOM SA (Pty) Ltd
2 Atana (Pty) Ltd
ABSTRACT
Often, when flood studies are conducted, the main focus is on delineating the inundation area exposed to flooding and establishing flood levels. This information is important for legal requirements and for designing infrastructure to mitigate flooding. However, these studies have much more to offer and assist in making better informed and more sustainable decisions to manage flood risks. Instead of solely focusing on flood levels, the potential economic impact can also be understood, and this information can be used to plan better ways to protect communities and infrastructure.
This paper shares a real-world example from Prospecton, Durban, where different parties – from private sector (Toyota South Africa Motors (TSAM)) to public sector (eThekwini Municipality) and even international partners (Dutch Disaster Risk Reduction and Surge programme (DRRS)) – collaborated to use flood analysis in a more sustainable manner. Initial flood studies conducted by AECOM between 2019 and 2023 helped everyone understand the complex flood dynamics and exposure factors in the region. Subsequently, Atana (Pty) Ltd and Royal HaskoningDHV partnered with the eThekwini Municipality in 2024 to undertake a detailed economic flood risk assessment. This progressive approach moved beyond simply identifying flood extents to quantifying potential damages and evaluating the financial viability of various mitigation interventions, aiming to optimise the overall flood mitigation strategy.
This example highlights the value of a continuous and adaptive methodology in flood studies. By building upon the initial flood level assessments to incorporate consequence analysis, a more holistic and sustainable understanding of flood risk emerges. This facilitates more informed decision-making regarding resource allocation for flood mitigation, leading to more resilient infrastructure and safer communities in the long term.
Finally, this paper will offer some practical steps and key considerations for municipal engineers and decision-makers who want to adopt this more sustainable approach to flood risk assessment within their own contexts. By embracing a flexible and ongoing methodology for flood studies, more effective and lasting solutions can be developed to protect towns and cities from the increasing threat of floods.
Flooding remains one of the most significant natural hazards in South Africa, frequently causing widespread damage to infrastructure, displacement of communities, and loss of life. The country’s increasing exposure to flood risk is driven by rapid urbanisation, inadequate capacity and maintenance of drainage infrastructure, and uncertainty associated with climate patterns. As a result, robust floodline (or flood risk) studies
have become essential tools for understanding, managing, and mitigating these risks.
These studies typically rely on hydrological and hydraulic modelling to delineate flood extents and determine flood levels for various annual exceedance probabilities (also known as return periods). However, to ensure long-term sustainability and resilience, floodline studies must extend beyond the regulatory compliance typically associated with flood extent mapping. There is growing recognition of the value in leveraging these models for broader applications, including damage estimation, costbenefit evaluations of mitigation strategies, and integration with spatial planning and climate adaptation strategies.
To showcase the evolving role of floodline studies in South Africa and demonstrate how they can contribute to more sustainable, equitable, and climate-resilient flood risk management, the work undertaken by various private consultants will be used as a case study. This case study will examine various flood studies conducted in Prospecton, Durban, following significant extreme flood events, specifically those of 2017, 2019, and 2022.
To effectively address escalating flood challenges, a clear and precise understanding of what constitutes flood risk is paramount. Flood risk can be comprehensively defined as a combination of the probability of a flood event occurring and the consequences of that specific event. These consequences can be far-reaching, encompassing impacts on people, critical infrastructure, the natural environment, and the economy. The United Nations Office for Disaster Risk Reduction (UNDRR) defines flood risk as a function of three primary, interconnected components, as illustrated in Figure 1 (UNDRR, 2017):
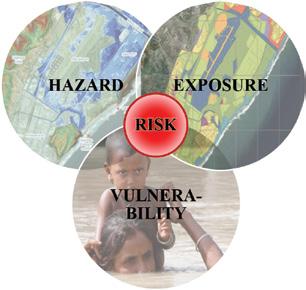
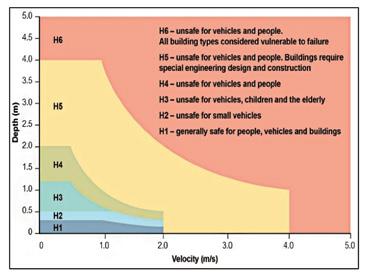
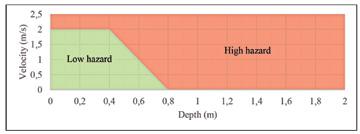
• Hazard: What are the chances of this happening?
This component refers to the physical flood event itself, characterised by its frequency or probability of occurrence and its inherent potential to cause harm. For instance, deep or fast-flowing floodwaters inherently possess a high potential to cause severe harm, whereas slower-moving, shallow floodwaters generally present a lower hazard.
• Exposure: Who will be affect by the event?
This refers to all elements situated within the flood-prone area that could be affected by the event. These typically include people, buildings, infrastructure networks such as roads and utilities, and critical facilities. Exposure is primarily determined by the spatial distribution of these assets and population density, often informed by detailed land-use maps.
• Vulnerability: What is their capability to cope, adapt or recover?
This component describes the susceptibility of exposed elements to harm or damage from a flood event. It is typically influenced by a range of socioeconomic factors (e.g. poverty, access to resources), physical characteristics (e.g. building materials, structural integrity), and adaptive capacities (e.g. early warning systems, emergency response capabilities) that determine their ability to cope, adapt, or recover.
Understanding flood risk, particularly the hazard component, is significantly enhanced by the results derived from advanced hydrological and hydraulic models. Advances in computational capabilities and modelling approaches have considerably improved the ability to simulate flood events and process the resulting model outputs. However, as stated in the IMESA A Best
Practice Guideline for Design Flood Estimation in Municipal Areas in South Africa (Brooker et al.,2023), “floodlines are usually presented as a simple line on a plan. While this may comply with National Water Act (Act No 36 of 1998) (NWA) requirements, it provides little information on risk.” This highlights a critical gap: even though these “simple lines on a plan” meet NWA requirements, the Guideline itself refers to numerous legislative documents that collectively emphasise the broader responsibility to ensure public safety.
A more advanced method, increasingly adopted internationally, involves reporting flood hazard as a function of both flood depths and velocities. For example, the Australian Institute for Disaster Resilience (AIDR) developed six hazard categories that considered the impact various velocity and depth combinations could have on people, vehicles, and buildings, as shown in Figure 2. This type of detailed hazard reporting is especially beneficial when considering multi-purpose flood attenuation facilities, such as recreational parks or sports fields. These facilities are designed to be inundated during extreme flood events, thereby serving as vital flood attenuation infrastructure. Notably, a simplified version of flood hazard categories based on flood depth and velocity combinations has already been successfully adopted by the City of Cape Town, as shown in Figure 3 (CCT, 2009).
With ongoing advancements in modelling software and post-processing capabilities, the inclusion of other crucial flood characteristics can further enhance hazard mapping. Parameters such as the rate of flood level rise, duration of inundation, or even debris potential can be considered to more comprehensively determine flood hazards and identify and map potentially unsafe areas.
The overall flood risk can be mitigated by reducing either (or a combination of) the hazard, exposure, or vulnerability. These risk reduction strategies typically comprise a combination of mitigation measures, including structural and non-structural interventions. Structural mitigation interventions involve physical changes to the built environment or landscape to directly alter flood pathways, reduce flood depths, or manage water flow. They are typically engineered solutions designed to control water, with a specific design return period in mind. The result is that damages would be reduced up to a certain return period (or probability), but damages could increase during more extreme events, as shown in Figure 4(a). Nonstructural interventions reduce flood impacts by influencing how people interact with flood-prone areas, improving preparedness, and enhancing awareness. These measures often complement structural solutions, creating a more comprehensive flood risk management strategy (UNDRR, 2017). Unlike structural measures, non-structural measures are not necessarily designed with a specific return period in mind and could typically reduce damages across all return periods, as shown in Figure 4(b).
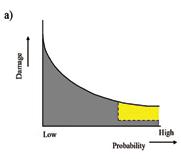
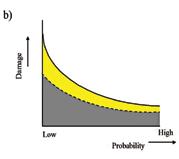
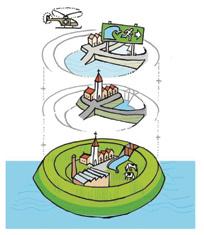
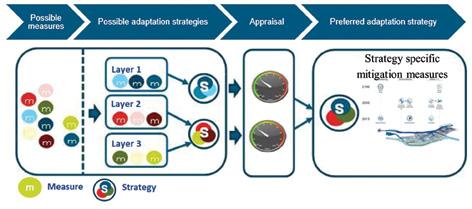
When developing flood mitigation interventions, a combination of structural and non-structural measures should be considered. This approach typically comprises various layers of mitigation, including prevention, preparedness, and response, key components of the disaster risk management cycle. Figure 5 shows a typical example where a structural measure, such as a levee, would form part of the first layer of flood protection - prevention. The second layer, preparedness, can be informed by spatial planning of the town, and the third layer would involve emergency response or evacuation plans. This example illustrates how multiple measures can form part of the various phases of the disaster risk management cycle, resulting in a multi-layer flood mitigation approach.
The various mitigation options identified as part of the multi-layer flood mitigation approach can then be combined to develop potential adaptation strategies for flood mitigation, as shown in the workflow schematic in Figure 6. An appraisal of these strategies can then be conducted based on a multi-criteria assessment. The appraisal could include cost-benefit analyses, environmental and socio-economic impacts, potential risk transfer to other properties, and the technical feasibility of the measures. This appraisal would depend on case-specific requirements, from which the preferred adaptation strategy can be identified for implementation.
5.1 Background
To showcase how floodline studies can significantly add value to understanding a flood regime and its consequences, a recent collaborative effort in the Prospecton area of Durban is presented as a case study. This area has unfortunately been subject to various extreme flood events in recent years. This case study, therefore, aims to demonstrate how understanding the flood hazard, specifically flood depths emanating from advanced modelling, can provide insights into the April 2022 floods and inform the economic impact assessment of proposed mitigation measures.
During the 1960s, the Isipingo and Mlazi Rivers were strategically diverted away from the Isipingo Estuary. This significant intervention aimed to unlock the large, flat floodplain, now known as Prospecton, for extensive development. Flow from the approximately 40km2 Isipingo River catchment was rerouted in a southerly direction towards the Mbokodweni River. Concurrently, the Mlazi River, which has a considerably larger catchment area of approximately 951km 2, was canalised and redirected in a westerly direction towards a new sea outfall, as indicated in Figure 7. These alterations resulted in a substantial reduction of natural flow towards the Isipingo Estuary.
Over the past decade, the Prospecton area has experienced a number of extreme flood events with devastating consequences. These impacts include extensive damage to infrastructure, significant business disruption, severe environmental degradation, and tragic loss of life. The most significant of these events occurred in October 2017, April 2019, and April 2022.
The former two events (October 2017 and April 2019) were primarily characterised by intense downpours within the local catchments that drain directly to the Isipingo Estuary. Rainfall associated with the October 2017 event, specifically for 60- to 120-minute storm durations, exceeded the design rainfall depths for a 1-in-200-year event. This resulted in severe flooding experienced in smaller, local catchments, particularly affecting bulk drainage systems from Isipingo Hills and Prospecton. The rainfall associated with the April 2019 event, on the other hand, exceeded the 1-in-20-year design rainfall depth for storm durations in the order of 12 hours, leading to flooding typically experienced in larger catchments (AECOM, 2019).
The April 2022 event proved to be the most extreme of the three. Rainfall stations along the coast recorded rainfall depths between the 20- and 50year return periods for storm durations of 2 to 3 days. However, inland
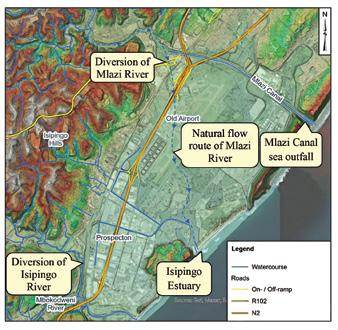
TABLE 1: Highest discharge flow at Shongweni dam since the construction of the Mlazi Canal (AECOM, 2024)
Year Estimated peak flow rate (m3/s) Approximate design return period (years)
1959 1400 100 - 200
1987 1420 100 – 200
2022 2000 - 2400 > 200
stations recorded significantly higher rainfall depths, between the 100and 200-year events, for storm durations ranging from 16 hours to 2 days. The resulting flow in the Mlazi River far exceeded the capacity of the Mlazi diversion berm (referred to as the R102 diversion berm) and canal, leading to overtopping and multiple breaches. Crucially, floodwaters discharged at these breaches followed the natural, historical path of the Mlazi River towards the Isipingo Estuary, directly resulting in the widespread flooding observed in Prospecton. It is important to note that apart from the 2022 breach, the Mlazi Canal has overtopped during only two other flood events since its construction in the mid-1950s: the first being in 1959 and again in 1987. Flow records at the Shongweni Dam, situated along the Mlazi River approximately 43km upstream of the Mlazi River diversion and Mlazi Canal, are summarised in Table 1.
These recent catastrophic flood events triggered significant investment from various parties, including private, public and international stakeholders. This investment was aimed at gaining a better understanding of the complex flood regime in the Prospecton area and, critically, to better inform future flood mitigation interventions. Table 2 presents a clear timeline of the extreme flood events since 2017, and the associated studies conducted by the collaboration partners for the Prospecton area.
Over the period shown in Table 2, several hydrological and hydraulic models were developed to better understand Prospecton’s complex flood regime. The hydrological models, developed using PCSWMM modelling software specifically designed by the Computational Hydraulics International (CHI) for personal computer-based (PC) stormwater management modelling (SWMM), aimed to determine flood magnitudes, such as peak runoff rates and hydrographs, for various flood probabilities or return periods. This data directly informed the hazard component of the risk assessment. The hydraulic models, on the other hand, focused on understanding specific flood characteristics like depth and velocity, which are crucial for both the hazard and exposure components of the risk assessment. These were developed using a combination of PCSWMM for the local catchment and HEC-RAS for simulating the overtopping and breaching of the Mlazi Canal system.
The model developed during the 2019 study was based on the local authority’s existing catchment management model. During this study, the
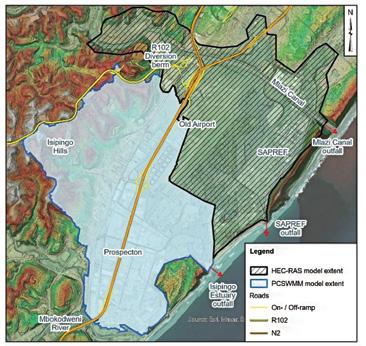
catchment management model was further enhanced to include a twodimensional (2D) modelling component specifically for the Prospecton area. 2D modelling offers significant advantages: it better represents lateral flow in flat areas (showing both flow direction and spread) and allows for the determination of flow paths as part of the simulation process. This capability enabled a more detailed representation of the complex flow regime associated with Prospecton’s flat topography. Furthermore, a ‘Rainon-Grid’ (also known as ‘Direct Rainfall’) modelling approach was adopted specifically for the Prospecton area.
This approach simulates rainfall directly onto a 2D modelling domain, eliminating the need for separate hydrological and hydraulic modelling stages. Initially, this model’s extent only considered the catchment area draining towards the Isipingo Estuary, which notably excluded the old airport site and industrial developments that drained to an additional outfall located north of the Isipingo Estuary, as illustrated in Figure 8. During the 2024 economic risk assessment study, the model was updated to include these previously excluded areas, as well as a developed area north of the Mlazi Canal that drains towards it. The final updated extent was similar to the 2022 Mlazi Canal flood study model’s extent, illustrated in Figure 9. This ensured the economic risk assessment covered the same geographical areas, considering the two different drivers of recent flood events.
During the 2022 study, a PCSWMM model was developed for the Mlazi River catchment to generate hydrographs for various return periods. This PCSWMM model not only generated runoff hydrographs for the different
TABLE 2: Timeline of extreme flood events and studies conducted for Prospecton, Durban
Year Flood event Study conducted
2017 October 2017
2019 April 2019 Flood level assessment of Prospecton (AECOM, 2019)
2022 April 2022 Investigation of Flood Risk Mitigation Measures at TSAM Durban Plant (AECOM, 2024)
2023Desktop study for the Dutch Disaster Risk Reduction and Surge Support (DRRS) programme (RHDHV, 2023)
2024 - Economic flood risk assessment (RHDHV, 2024)
Purpose of the study
Conducted for Toyota South Africa Motors (TSAM) and in collaboration with eThekwini Municipality.
Conducted for TSAM in collaboration with eThekwini Municipality.
To assess the relevance of a request for support to eThekwini Municipality.
Conducted for the DRRS programme and eThekwini Municipality.
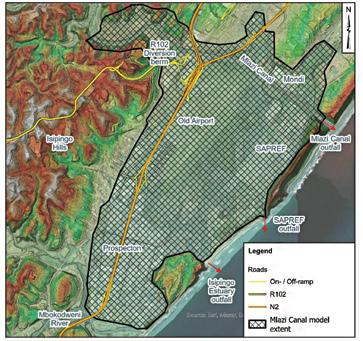
return periods but also investigated the impact of the Shongweni Dam on the flood hydrographs at the Mlazi Canal. A 2D HEC-RAS model was specifically developed to simulate the breaches associated with the Mlazi diversion berm and along the Mlazi Canal, with inflow flood hydrographs based on the results from the PCSWMM model. Various scenarios associated with the breaching of the diversion berm and canal were considered, as shown in Figure 10, to investigate the potential hazards and areas exposed to flooding. Furthermore, these scenarios also quantified the reduction in hazards and exposure expected once the reinstatement works have been completed.
Simulated results for the October 2017 and April 2019 events were compared to the local catchment model results, and the April 2022 event to the Mlazi Canal breach model results, to improve the confidence in the modelling results and associated scenarios investigated.
5.3 Local catchment modelling results
The hydraulic model results directly inform the hazard and exposure associated with flood events in the Prospecton area. A range of different recurrence interval events were simulated to determine the flood properties for various return periods. One of the challenges inherent in the modelling approach, specifically the ‘Rain-on-Grid’ method, is that each modelling cell receives rainfall input, which can initially result in shallow flood depths across the entire model extent. As a result, flood depths less than 50 mm were excluded from the risk assessment to focus on significant
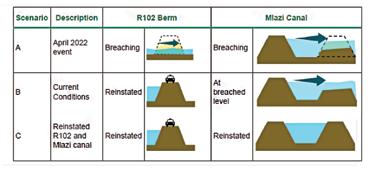
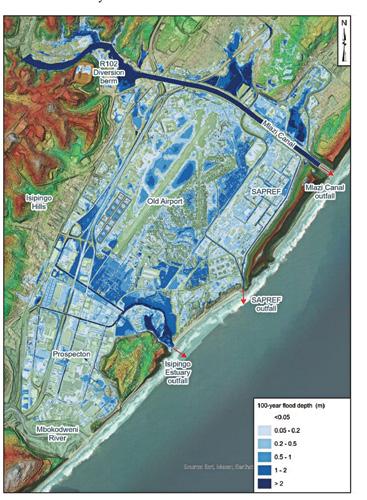
inundation. Figure 11 presents the 1-in-100-year flood depths associated with the local catchment hydraulic model.
From the model results presented in Figure 11, it is evident that during extreme flood events, the bulk drainage system overtops, resulting in flooding of adjacent properties. Furthermore, the low-lying, flat nature of the topography in Prospecton poses a challenge to drain the developed areas once the bulk drainage system has reached its capacity, resulting in large areas being inundated with only a small increase in flood level.
5.4 Mlazi River modelling results
Another significant source of flooding, as experienced during the April 2022 event, is the overtopping of the Mlazi River diversion system, which includes the R102 diversion berm at the and the Mlazi Canal. During the April 2022 event, the diversion system not only overtopped, but the excess flow also resulted in scouring and failure of the flood protection system.
Since the April 2022 flood event, the breach of the R102 river diversion berm, as shown in Scenario A in Figure 10, has been reinstated. However, this scenario provides an understanding of the damages experienced during the April 2022 event and shows the relative impact of the breach on the flood depths when compared to the current condition of the diversion system. To better understand the importance of reinstating the Mlazi Canal breaches, four extreme flood events were simulated for Scenarios B and C in Figure 10. These included the 1-in-100- and 1-in-200-year events, as well as peak flow rates of 2 200m3/s (approximately 1 in 275-year event) and 2 400m3/s (approximately 1 in 375-year event). The latter two flows were derived from the tipping of the Shongweni Dam fuse gates which occurred during the April 2022 flood event.
a)
b)
c)
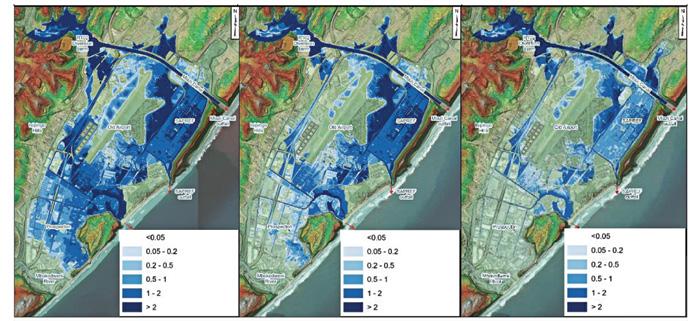
Figure 12(a) presents the hydraulic modelling results for the April 2022 event based on Scenario A in Figure 10, where the R102 diversion berm and Mlazi Canal have breached. As mentioned previously, the April 2022 event is considered greater than the 1 in 200-year event and is therefore compared to the 2 200m3/s flood model results for Scenario B and C, shown in Figures 12(b) and (c) respectively, during this case study.
From the model results, it is clear that the overtopping and breach of the R102 diversion berm had a more significant impact on the flood depths in Prospecton, whereas the Mlazi Canal overtopping and breach would be more severe for the properties between the Mlazi Canal and the Isipingo Estuary.
5.5 Understanding the impact of mitigation strategies
As defined earlier in this paper, flood risk comprises hazard, exposure, and vulnerability. The previous section showcased the hazard and exposure components of the risk assessment. To better understand the vulnerability component of the flood risk, flood depth-damage relationships and maximum damage values were derived for each land-use type. The maximum damage values, presented as a cost per area, are not only a representation of replacement value but also indirect costs associated with a loss in revenue. These total damages (capital and operational losses) were scaled based on depth-damage curves derived from international sources, such as the Rijkswaterstaat (2004) and then modified based on stakeholder interviews.
Scenario Local Catchment
Baseline Represents conditions prior to the implementation of the proposed flood mitigation interventions.
• Additional sea outfall at Clark Road
• Upgrading of the Prospecton Road Canal
Mitigated
• Attenuation facilities in Isipingo Hills
• N2 Relief Culvert and Canal system
This assessment indicated a total loss of approximately 4.1 billion USD as a result of the April 2022 floods, with the largest portion of the loss attributed to industrial land-uses and the associated business disruption (RHDHV, 2024). Since these curves were calibrated for the overtopping and breaching of the Mlazi Canal, modifications had to be made for the assessment of local catchment flood events.
At the time of the 2024 Economic Flood Risk Assessment study, several structural flood mitigation interventions have been planned (or partially implemented) by various stakeholders. Some of these mitigation measures were compared to a baseline model to evaluate their estimated economic impact.
Table 3 presents the interventions included in each of the models.
The impact of these mitigation strategies on the estimated total damage for various return periods is presented in Figure 13.
The flood mitigation interventions presented for the local catchment model had a localised impact on flood levels. This resulted in no significant change in the estimated total damage for all return periods up to the 1-in-200-year event experienced in Prospecton, as shown in Figure 13(a). However, the upgrading and scour protection interventions proposed for the Mlazi River model had a significant reduction in flood depths and extent, significantly reducing the estimated total damage in the Prospecton area for the extreme flood events.
Mlazi River
Assumes the R102 diversion berm and Mlazi Canal are reinstated to pre-flood conditions without scour protection measures, assuming a breach when overtopping.
• R102 diversion berm and Mlazi Canal upgraded to 1 in 200-year flood protection
• Scour protection measures preventing a breach.
• Spillway along the southern berm of the Mlazi Canal near SAPREF
• Upgrading of the bulk drainage system and outfall near SAPREF
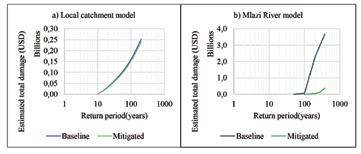
13:
6. CONCLUSIONS AND RECOMMENDATIONS
This case study presented a condensed summary of specific parts of the studies conducted between 2019 and 2024. Its aim was to showcase the benefits of assessing all three components of flood risk: hazard, exposure, and vulnerability. Beyond the work presented in this paper, the reduction in flood damages was also compared to investment costs to further optimise the design and development of these flood mitigation strategies and inform the appraisal of mitigation strategies.
A key consideration for ensuring the sustainability of floodline studies— or more broadly, flood hazard assessments – is to move beyond the “simple line on a plan” approach. Instead, the scope of these assessments should include more detailed flood characteristics, such as depth and velocity combinations (to identify various hazard classifications), rate of flood level rise and duration of inundation. These richer flood characteristics can then be used for more than just identifying potential areas exposed to flooding, but also assist in disaster management, as well as determining potential damages. They can, in fact, facilitate a multi-layer approach to flood mitigation strategies. Ultimately, these strategies can then be optimised and appraised to better inform robust flood adaptation strategies. Unlocking this full potential of flood level assessments, however, truly necessitates moving beyond the basic “line on a plan” approach.
7. REFERENCES
AECOM. 2019. Investigation of Flood Risk Mitigation Measures at TSAM Durban Plant. Report compiled by AECOM SA (Pty) Ltd for Toyota South Africa Motors (Pty) Ltd (TSAM) during March 2024.
AECOM. 2024. Investigation of Flood Risk Mitigation Measures at TSAM Durban Plant. Report compiled by AECOM SA (Pty) Ltd for Toyota South Africa Motors (Pty) Ltd (TSAM) during March 2024.
Australian Institute for Disaster Resilience (AIDR). 2017. Australian disaster resilience guideline 7-3: Flood hazard, AIDR, East Melbourne. Brooker, CJ, du Plessis, JA, Dunsmore, SJ, James, CS, Gericke, OJ and Smithers , JC. 2023. A Best Practice Guideline for Design Flood Estimation in Municipal Areas in South Africa. WRC Report No. TT 921/23. Water Research Commission, Pretoria, South Africa.
City of Cape Town. 2009. Floodplain and River Corridor Management Policy Approved by the City of Cape Town Council on 27 May 2009. Gersonius, B., Ashley, R., Salinas Rodriguez, C. N. A., Rijke, J., Radhakrishnan, M.,Zevenbergen, C. and Pauwels, V. (2014) Flood Resilience in Water Sensitive Cities. Guidance for enhancing flood resilience in the context of an Australian water sensitive city, Victoria, Australia: Cooperative Research Centre for Water Sensitive Cities.
Republic of South Africa (RSA). 1998. National Water Act. (Act No 36 of 1998). Pretoria. Government Printer. Rijkswaterstaat (2004). Standaardmethode 2004 Schade en Slachtoffers als gevolg van overstromingen. DWW-2005-005, November 2004.
Royal HaskoningDHV. 2023. DRR-Team desktop study eThekwini South Africa 2023 – Study following April 2022 floods. Ref: MD6394-RHD-XX-XXRP-X-0001. 3 July 2023
Royal HaskoningDHV (RHDHV). 2024. Economic Flood Risk Assessment South Durban Basin (Prospecton). Report compiled by Royal HaskoningDHV (Pty) Ltd for the Netherlands Enterprise Agency during June 2024.
United Nations Office for Disaster Risk Reduction (UNDRR). 2017. The Sendai Framework Terminology on Disaster Risk Reduction. Accessed 6 June 2025. https://www.undrr.org/terminology/.
World Meteorological Organization (WMO). 2017. Selecting measures and designing strategies for integrated flood management: A guidance document . Guideline compiled by Associated Programme on Flood Management (APFM), World Meteorological Organization (WMO), Global Water Partnership and Deltares during April 2017.
WILL THE NEW PUBLIC PROCUREMENT ACT HAVE A POSITIVE EFFECT ON MUNICIPAL PROCUREMENT?
Chris Wilcock WSSA (Pty) Ltd
ABSTRACT
The blockages in the service delivery pipeline at municipal level are a cause for concern with ineffective procurement being blamed for at least part of the problem.
It is hoped that the “new” Public Procurement Act, 28 of 2024, which will come into effect on a date to be proclaimed once the enabling regulations have been made by the Minister, will greatly assist in the unblocking of the pipeline.
There are a number of positive aspects of the Act, including the efforts to reduce the fragmentation of public procurement legislation, the promotion of technology in the procurement process, the renewed focus on developmental procurement, the efforts to improve the skills of procurement practitioners and the reduction in the time and money spent on disputes around the awarding of tenders. Some of the aspects that have attracted criticism are the centralisation of power and the lack of focus on local government procurement, which is large enough to justify special provisions.
There is an acknowledged lack of capacity in public procurement, currently known as supply chain management (SCM), with procuring institutions struggling to attract and retain sufficient skills to implement effective and compliant procurement. This is particularly difficult in the built environment.
Another problem facing the procurement of infrastructure and specialist technical services is the tension that sometimes occurs between the technical departments and the procurement (SCM) practitioners. The Act, together with various initiatives within the industry, is striving to upskill and professionalise public procurement practitioners. This will help the credibility of procurement practitioners and improve the effectiveness of municipal procurement.
Public procurement is a dynamic and complex field. There are fewer, but still, numerous bits of legislation directly and indirectly impacting on public procurement. There are potential uncertainties which are going to require court judgments to clarify.
The numerous challenges to tender awards, many of which end up in court, hamper service delivery. Significant amounts of time and money is spent to defend awards resulting in delays to the conclusion of the contracts and depletion of budgets. A Tribunal will be established to more speedily and cost-effectively resolve challenges and disputes.
The challenges of procuring goods and services are many and will stretch the resources of even the highest capacity municipalities. These are not insurmountable problems but will take a lot of work, determination and cooperation to overcome.
It has been said that municipal engineers have to do with R1 what private
sector engineers need R2 to do. In today’s environment that is now only partially true. Municipal engineers have to do so much more than merely implementing, operating and maintaining essential infrastructure with severely limited resources. The other objectives to be achieved include promoting local development, developing the previously disadvantaged, managing conflicting objectives and mentoring the next generation of municipal engineers, among others.
In order to do this, municipal engineers rely on the effective and efficient procurement of these goods and services, for the right price, while satisfying the developmental objectives. The procurement function has become increasingly important as the capacity to do work in-house declines.
The procurement function, however, is no easy task. South Africa’s public procurement legislative framework has been described as “complex and fragmented” (MAPS 2024: 30). There is a plethora of statutory provisions to be adhered to as well as guidelines, policies and standard procedures to be followed. Any gathering of academics, legal professionals and procurement experts gives rise to vigorous debate and differences of opinion. Little wonder then, that so many public procurement decisions get challenged.
It is clear that public procurement at municipal level is in trouble. Any number of Auditor-General reports detail the problems and the number of awards that end up being judicially reviewed is further evidence of the shortcomings. For example, In S A Post Office v De Lacy Nugent JA remarked at [1] that “Cases concerning tenders in the public sphere are coming before the courts with disturbing frequency.” These challenges, even the unsuccessful ones, delay and even prevent the provision of services.
With much fanfare the “new” Public Procurement Act – Public Procurement Act, 2024 (Act No. 28 of 2024) referred to hereafter as the Act – was signed into law by the President of the Republic of South Africa on 18 July 2024 to come into effect on a date still to be gazetted. The Act is ambitious and wide-ranging in scope. The Act will repeal various other pieces of legislation and seeks, among other things, to reduce the fragmentation, to improve efficiency, to regulate and promote effective preferences, to combat corruption and provide better dispute resolution mechanisms (Section 2).
The purpose of this paper is to analyse and discuss some of the provisions of the Act that impact on service delivery at the local government level.
For ease of reference in this paper, any reference to the Act is a reference to the Public Procurement Act, 28 of 2024 and any reference to the Minister is a reference to the Minister of Finance. The definition section of the Act in fact defines the Minister to be the “Cabinet member responsible for financial matters” which I have assumed to be the Minister of Finance.
2 THE LEGISLATIVE FRAMEWORK
2.1 Brief overview of the current situation
Public procurement legislation, like all legislation, in South Africa, is subject to the Constitution of the Republic of South Africa, 1996, in particular section 217. Section 217.(1) of the Constitution requires public procurement to be conducted according to a system which is fair, equitable, transparent,
competitive and cost-effective. Furthermore Section 217.(2) of the Constitution provides for preferences to be granted and finally Section 217. (3) requires legislation to be enacted to implement the preferences.
Various pieces of legislation have been enacted to regulate public procurement including the Municipal Finance Management Act, 2003 (Act No. 56 of 2003) (MFMA), the Public Finance Management Act, 1999 (Act No. 1 of 1999) (PFMA) and the Preferential Procurement Policy Framework Act, 2000 (Act No. 5 of 2000) (PPPFA), which gives effect to section 217.(3) being the Acts which directly regulate public procurement. Regulations to flesh out these Acts have been gazetted.
Other pieces of legislation which also affect public procurement in South Africa include, but are not limited to, the Construction Industry Development Board Act, 2000 (Act No. 38 of 2000), the Broad-Based Black Economic Empowerment Act, 2003 (Act No. 53 of 2003), the Promotion of Administrative Justice Act (PAJA) and the Municipal Systems Act, 2000 (Act No. 32 of 2000) as well as a number of sector-specific Acts.
Among the regulations made in terms of their respective Acts are the Supply Chain Management regulations made in terms of the MFMA, the Treasury Regulations made under the PFMA and the Public-Private Partnership Regulations, which were recently amended.
In addition to this are numerous quasi-legal instruments such as National Treasury circulars, guidelines and instructions as well as Auditor-General findings which carry varying weight under law. Volmink (2022), noting that South African public procurement is in an uncertain period, states in his inimitable way that “new rules appear and disappear with alarming frequency. Uncertainty abounds.”
Finally, there is a vast body of case law that are the court judgments over the years made in terms of the above-mentioned legislation.
Clearly this complex and fragmented quagmire of law, subordinate law and quasi-law is untenable and unworkable.
2.2 How the legislative framework will look under the new Act
The new Act will indeed tidy up and consolidate a lot of the legislation. The procurement provisions of the MFMA and PFMA will be removed from those Acts and are incorporated into the Act. The PPPFA will be repealed in its entirety, which means that the Preferential Procurement Regulations 2022 will also fall away since the regulations cannot exist without the Act in terms of which they were made. The section 62 appeal under the Municipal Systems Act will be replaced by the non-judicial dispute mechanisms under the Act while codes revised or issued under the BBBEE Act must align with the provisions of the Public Procurement Act.
The main set of statutes with direct effect on public procurement will then be the Constitution, the Public Procurement Act, the regulations made by the Minister under the Act and PAJA.
The new Act requires numerous regulations to be made by the Minister to give effect to the Act. These are currently being drafted before the public participation stage prior to being gazetted.
Section 24.(1) requires that The Minister must prescribe a framework within which a procuring institution must develop and implement its procurement system, referred to in section 8(1)(b).
2.3 Current uncertainties
An issue which remains uncertain is the role which BBBEE ratings will play. Section 18.(1)(b) of the Act makes only one reference to BBBEE and then only in connection with pre-qualification.
One of the criticisms levelled against the new Act is that it imposes obligations on procuring institutions but limits their power and restricts their discretion (APLU 2023, 6).
Not much can be said about the functioning of the Act, chapters 4 and 5 in particular, until the regulations are made available for comment. While hopefully imminent, this had not happened at the time of writing.
The regulations which are required to give practical effect to the Act must be subject to public participation, must be sent to NEDLAC for input and must serve before Parliament for scrutiny. It is thus not anticipated that the Act will be in effect before the first quarter of 2026, at the earliest.
3.1 Overview
The new Act has been long in the making and was finally signed into law by the President on 18 July 2024 after the Bill was debated by NEDLAC, passed through the public participation process and being passed by the National Assembly after accepting some amendments required by the National Council of Provinces.
The Act is wide-ranging and will require regulations for many of its 69 sections to be fully in effect. The Act contains more than thirty references to matters that must be “prescribed” which, per definition means by regulations. In addition, section 63 contains a list of fourteen matters for which the Minister must make regulations and another list of seven matters for which the Minister may make regulations. Owing to the time needed to make all of these regulations it has been suggested that the Act can come into effect in phases requiring then only the regulations for those chapters or sections to be made.
It should also be noted that the implementation of the Act has to be reviewed within 24 months of its publication in the Government Gazette (Notice No. 5051, Government Gazette No. 50967 published on 23 July 2024), which will be 23 July 2026 even though, at the date of writing, it is not in effect yet.
3.2 Chapter 1 – Definitions, objectives and application of the Act
After the Preamble which introduces the Act, the first chapter (Section 1–3) deals with the definition of the key terms of the Act, states the objectives and declares to whom the Act applies.
Section 1 contains the definitions and already introduces some difficulties:
3.2.1 As pointed out in the submission to Parliament’s Standing Committee on Finance, by the African Procurement Law Unit which is a unit of Stellenbosch University headed by Professor Geo Quinot, a world authority on public procurement law, the definition of the Act includes non-statutory instruments i.e. “codes of conduct and instructions” (APLU 2023: 3). This could again lead to a proliferation of provisions, in addition to the subordinate legislation necessary to give clarity to public procurement law and again result in the fragmentation of public procurement law.
3.2.2 The vagueness and the wideness of the words “or on an easily accessible central online portal that is publicly available” in the definition of “publish” could open the door for circumvention by publication on an obscure portal known only to a chosen few.
On the positive side, the definition of procurement does confirm that letting and leasing disposal of assets is included in public procurement.
Section 2 contains the objectives of the Act which are, without going into detail here, too wide-ranging and too numerous to be effective.
Section 3 makes the Act applicable to all organs of state including those which were previously exempt from compliance with the public procurement legislation. There are provisions in the Act for organs of state such as Transnet, which compete against private sector operators, to apply for exemption from compliance with the Act. The details, terms
and conditions to be granted exemption will become evident when the Minister makes the applicable regulations.
Sub-sections 8.(3) (a) – (c) which extend the reach of the Act to donor funded procurement, suppliers who have been awarded a contract and those procuring on behalf of the organ of state are of importance and are potentially problematic. Just how these will be implemented remains to be seen and will probably play out in the courts. This is because Section 8.3(a) essentially overrides any terms and conditions set by donor and funding agencies which often come with their own sets of terms and conditions.
In the South African legal system, the Constitution is the supreme law with acts of parliament being next in the hierarchy with regulations and other sub-ordinate legislation following. That is why a municipal by-law, policy or procedure cannot override the provisions of an act, as pointed out by Shapiro AJ in Maximum Profit Recovery (Pty) Ltd v Umkhanyakude District Municipality and Another
In theory then all acts are equal and subordinate only to the Constitution but s8.(4) places this Act above the others in the event of a conflict because it reads “in the event of a conflict between a provision of this Act and a provision of any other legislation, the provision of this Act prevails”. The problem here is that other Acts have some kind of trumping provisions as well. Notably the BBBEE Act Section 3.(2) is such a provision, albeit it does not conflict with the Public Procurement Act.
The first part of this chapter, Sections 4 and 5, deal with the establishment of a national Public Procurement Office (PPO) which appears to be a restructuring of the current Office of the Chief Procurement Officer (OCPO). The Office is intended to assist and guide the procuring institutions with their procurement of goods and services.
According to Section 5.(2)(a) the PPO is empowered to issue binding instructions on the PFMA procuring institutions but only non-binding circulars on municipalities and municipal entities, per Section 5.(2)(b). These circulars only become binding if adopted by the municipal council, as per Section 5.(4).
The Office is tasked with wide-ranging powers and duties. Of concern is that the current structure (OCPO) does not have the resources for this greatly expanded role. As noted by Brunette & Klaaren (2020: 9) there is a lack of capacity, not just within the procuring institutions, but also within the regulatory authorities. For the PPO to function effectively it needs to be adequately resourced. This will not take place overnight but certainly needs to be in place by the time that the Act comes into effect.
Provincial Treasuries also have support, monitoring and oversight roles and can also issue binding instructions to PFMA entities and non-binding circulars to the local government sector which can become binding if adopted by the affected council.
Section 7 confirms the current situation which confers on the accounting officer, being the municipal manager at local government level, the duty to make the decisions required in terms of the Act.
Section 8 further imposes duties and obligations on procuring institutions to comply with the Act and to carry out efficient and effective procurement and, in particular, to develop a procurement policy in compliance with the Act. At first glance this appears to mean that municipalities will have the freedom to determine their own procurement methods, preference systems and development policies. However, it comes with a rider that the system, policy etc. must be made within a framework to be prescribed by the Minister. The degree of freedom is thus still to be established.
Other than the two remarks made below, due to time and space constraints, I will not deal with this chapter in this paper. These two topics are important enough to warrant a separate study especially in the light of the findings of the Zondo Commission that procurement played a key role in state capture coffers and the looting of state.
The first remark is that section 14 can be read to introduce a type of mandatory and open whistleblowing which, while any anti-corruption measures are to be welcomed, could place procurement practitioners in an intolerable position.
Secondly the debarment measures, which should be rigorously applied, are draconian in nature and potentially violate the audi rule. Following of due process is advised to avoid subsequent challenges.
Books and scholarly papers will still be written about chapter 4, which contains far-reaching measures and largely replaces the Preferential Procurement Policy Framework Act together with its Preferential Procurement Regulations, 2022. It seeks to clear up the confusion around preferential procurement and to set clear rules in place. This is one of the parts of the Act that needs extensive regulations to be made.
Briefly, provision is made for a continuum of measures to redress past inequities ranging from complete exclusion (set-asides) through prequalification to open competition as the value increases. In addition, provision is made for compulsory subcontracting.
The issue of local content thresholds is being dealt with by the Department of Trade and Industry, the Minister of which must make the necessary regulations. The discussion of local content is outside the scope of this paper but will need to be adhered to once the regulations are promulgated.
Section 69.(2) of the Act makes provision for a phased commencement whereby different parts of the Act can come into effect at different times. Owing to the urgency to implement preferential procurement it has been suggested that chapter 4 be the first part to come into effect and that those regulations be fast-tracked. Due to the need to clarify the preference system as well as the methodology of procurement, it is probably necessary to implement chapters 4 and 5 at the same time.
Three significant aspects of this chapter bear discussion here:
3.5.1 The preference points system
Practitioners and bidders are familiar with the ratio of points for price and points for preference, i.e., the “80/20” and “90/10” systems, which have been in place since the promulgation of the PPPFA and the subsequent sets of regulations. Nowhere does the Act talk about allocation of points, so it remains to be seen if such a points system will be prescribed and what the limits are. There has been speculation that 70/30 and even 50/50 systems could be in the offing, but it must be borne in mind that there is a tradeoff between the granting of preferences, permitted by section 217.(2) of the Constitution, and obtaining maximum value for money, as required by section 217.(1) of the Constitution. Thus, it is unlikely that there will be unfettered discretion allowed.
In fact, in the case of set-asides and pre-qualification, it would appear that there need be no preferences granted to any of those eligible to bid unless sets preference measures to be achieved when a contract is granted. Again, this is to be within the conditions set by the regulations. The degree to which the procuring institution has discretion will become clear once the regulations have been published.
Local economic development measures including job creation, development of small business and innovation are provided for under section 22, but again subject to prescription by the Minister.
When the Preferential Procurement Regulations 2022 came into effect, some organs of state retained the allocation of points according to BBBEE level only, while some applied a combination of BBBEE level and locality. Many organs of state dispensed with BBBEE levels and applied methods including ownership, the development of SMMEs and locality. The diversification of scoring methods makes it time-consuming and difficult for bidders who have to prove their entitlement to points under so many different systems. The decision of some organs of state to dispense with BBBEE levels was challenged in court. One of these cases was H & I Civil & Building (Pty) Ltd and Another v City of Cape Town and Others where the new scoring system was challenged. The court however, held that the City was entitled to implement their own system. This being a judgment of a full bench of the Western Cape High Court potential challengers seemingly believe that other high courts are unlikely to not follow this approach and the current system proceeds unchallenged until clarity is provided by the new regulations.
3.5.2 The degree to which the allocation of preferences will be prescribed As shown in 3.5.1, the 2022 regulations still require the 80/20 and 90/10 systems, but the allocation of the 10 or 20 preference points remains at the discretion of the procuring institutions.
The PPPFA, which stipulates the 80/20 and 90/10 requirements, will be repealed in full and be replaced by the provisions of the regulations to be made under the Public Procurement Act. None of the sections of the Act make any mention of a points system. Unless the regulations or the framework contemplated by section 24 do so the method of granting preference will be entirely up to each individual procuring institution. If this is allowed to happen the sheer range and diversification will make life very difficult for bidders – especially the smaller ones which do not have sophisticated or dedicated tendering departments. This kind of situation will thus hinder the very ones which the Act seeks to promote so it is unlikely that the Minister will let go of the reins completely.
3.5.3 Functionality
A common complaint emanating from technical departments is that “Supply Chain” only looks at the price and then the wrong contractor gets appointed leading to poor quality, time overruns and cost overruns to rectify defects.
The evaluation of the “functionality” of bidders to ensure quality and prevent incompetent bidders getting contracts has become an important part of the bid evaluation process. Getting the right contractor on site is critical to delivering projects on budget and on time.
This use of functionality is open to abuse and technical departments can make themselves guilty of tailoring the functionality requirements to suit a bidder in whom they have confidence or a good, not necessarily fraudulent, relationship. People like to work with people that they know and trust, but space has to be made for new entrants into the market provided reasonable safeguards are in place.
Section 24.(1)(d) provides that the procurement system must provide for evaluation of criteria such as capability, functionality and cost-effectiveness but must, very importantly in my opinion, do so “without limiting new entrants or emerging suppliers or both”.
Growing the economy requires making room for new entrants.
Section 24 requires the procuring institution to develop and implement a procurement system within the framework to be prescribed by the Minister. It is this prescription which causes concern that, while the obligations are decentralised to the municipal managers, their discretion may be significantly fettered by the restrictions that may be imposed by the framework.
Volmink (2014, 44–46) warns of the consequences of too rigid a system which overly restricts the discretion of the procuring institution. At the same time, he also warns that too much flexibility or discretion can lead to inconsistency and even fraud. A balance needs to be found between a rigid check-box system which can eliminate competent, cost-effective bidders and a lax system which can be manipulated and which leads to a lack of certainty. It is hoped that the framework achieves that balance.
Section 24.(4) states that the PPO may determine standard bid documents. It must be remembered that PPO instructions are only binding on municipalities if the council adopts the instruction. This does leave the door open to the local government sector to use bid documents tailor-made for their own situation.
Section 25 of the Act does permit the current situation whereby organs of state may contract with each other without going through an open tender process. The language of the section is not peremptory so municipalities will be able to decide whether or not they want to go that route. There are however exceptions to that rule in the case of transversal contracts and certain sector-specific rules such as those imposed by the State Information Technology Act, No. 88 of 1998 (SITA Act).
The procurement must take place via a bid committee system to be prescribed by the Minister. The current bid committee system is tried and tested, and I see no reason why it would be changed.
One of the aspects of the Act that will surely be warmly welcomed by municipal engineers is the increased focus on the procurement of infrastructure and indeed, the elevation of infrastructure procurement, by section 24.(1).a.(ii), to strategic status. Infrastructure procurement is arguably the lifeblood of service delivery, especially in local government sphere of government, and thus requires this focus and status.
Section 24.(1)(a)(ii) provides that a separate system may be implemented for the procurement of infrastructure and capital assets. At first glance the technocrats would welcome this as it is often stated that building a freeway is different from buying pens and pencils. While this is certainly true, there are two schools of thought on the matter. One school of thought is that the procurement of infrastructure is so specialised that a unique and separate system is needed. An alternative proposition is that the further fragmentation of public procurement needs to be avoided so a separate system should not be created but appropriate methods, within the system, need to be selected for infrastructure procurement. It should be borne in mind that there are instances where infrastructure and capital asset procurement may overlap with the procurement of the non-capital goods and services required to operate and maintain the works. It would be confusing to have to choose between two systems or, worse, use two different systems. It would, in such cases, be preferable to have one system from which appropriate methods can be selected.
The final say on the systems and methods approved by regulation will lie with the Minister and the regulations which must be published under sections 63.7.(b).(i) and (ii) will clarify and give direction to the procurement of infrastructure.
My closing remark on this matter is to align my views with Anthony (2020, 27), writing on the then Bill, that the definition of “Infrastructure” in the Act should align with the CIDB definition of “Construction Procurement”. The Act does repeal certain sections of the CIDB Act but the two Acts will largely co-exist.
3.8 Chapter 5, Parts 2 and 3
These parts deal with the promotion of the use of technology and access to
procurement information respectively. In trying to limit the paper to topics of interest to municipal engineers, these sections will not be discussed here. I acknowledge that the use of technology is of interest to engineers, but the sections are still quite vague and not yet clarified by regulations.
3.9 Chapter 6 – Dispute resolution
This is a weighty chapter and introduces some important new concepts and mechanisms not yet used in South African public procurement.
3.9.1
As early in the Act as section 8.(2), the procuring institution is granted, as prescribed of course, the authority to correct any decision it made. Furthermore, section 35.(1) grants dissatisfied bidders a genuine appeal mechanism as an internal, non-judicial review. Currently the MFMA envisages only an objection and Section 62 of the Municipal Systems Act grants an appeal only if the contract has not been awarded. As can be inferred from sections 8.(2) and 35.(8) the award of a contract can be withdrawn at any time.
This right of self-review is welcomed as it can afford a bidder, without the appetite or resources for expensive and time-consuming litigation, a real remedy against an unfair decision. A procuring institution which finds that it has made a mistake or has uncovered fraud within its ranks can do a self-review without having to resort to litigation. Due to the backlogs in the courts the matter may well be moot by the time a court date is obtained, as was the case in Moseme v King.
The section does not however, place a time limit on the right to self-review. This can lead to uncertainty as an innocent supplier can never be certain that a fairly won contract will not be reviewed somewhere down the line. Should this happen then the impugned decision would have to be referred to the Tribunal Sections 35.(8), 47.(1) and 52.(1) and the courts should the Tribunal decision be unfavourable.
This is an entirely new concept on a national level although the Province of Kwa-Zulu Natal did have a functioning provincial tribunal.
The Tribunal provides a non-judicial external dispute process. It is relatively cheap and quick compared to judicial reviews by the courts.
In terms of the Act a party dissatisfied with a decision of a procuring institution, including a decision to debar, may, having exhausted the internal processes, request the Tribunal to review the decision. The timelines imposed are short so as to not delay service delivery or to disrupt contracts which have advanced to a significant extent.
The Tribunal will hear the matter in much the same way as a court would and can make rulings similar to a court, including to dismiss the application, refer the decision back for reconsideration, review the decision and may make cost orders.
This seems to be a positive step in that the Tribunal, if adequately resourced, can make quicker decisions than the overburdened courts can at a lower cost; thus, making administrative justice more readily available. However, I have one serious concern over the provisions of section 52.(1) which states that a person dissatisfied with an order of the Tribunal may take the order on judicial review. This could mean that a party with deep pockets and determined to litigate can merely continue the fight after the Tribunal stage. The Tribunal could thus become just another link in the whole chain and result in the dispute process becoming even longer, more drawn-out and expensive. For a small or medium municipality with limited resources trying desperately to implement a project this additional step could well scupper the project.
3.9.3 The stand still process
The stand still process, used in various jurisdictions around the world including the United Nations Commission on International Trade Law (UNCITRAL) model law Article 65.1, is a new development in South African public procurement law.
Under the current dispute system a procuring institution can, sometimes recklessly, simply continue implementing a contract despite challenges. This can have the effect, that by the time the matter, plus any appeals, is finalised the contract can be substantially, if not fully complete rendering the court proceedings moot. If an aggrieved bidder or other party with standing, wants to halt the execution of the contract they have to request the procuring institution not to proceed. If they do not obtain that agreement they have to approach a high court for an interdict.
The stand still process introduced by Part 4 of Chapter 6 is a very welcome innovation. It prevents the conclusion of the contract, other than in the case of an emergency, during the re-consideration period and, if applicable, until after the review process by the Tribunal has been completed. There is provision in Chapter 6 to prevent spurious or vexatious challenges from holding up the service delivery.
3.10 Chapter 7 – General provisions
This chapter covers a number of aspects, which while of importance, are not of particular interest here.
What needs some attention is the previously mentioned aspects of the issuing of instructions by the PPO and the making of regulations by the Minister as well as the following sections.
3.10.1 Section 58
This section, which absolves persons acting in good faith from civil or criminal liability, will be welcome to those officials who may be alarmed by some recent high court judgments imposing personal cost orders on officials. Fraudulent and corrupt behaviour will be dealt with under the provisions of sections 59 and 60.
3.10.2 Section 65
This section requires all formal communications to be in writing. Note that under South African law an electronic mail (email) is regarded as being in writing.
4 CONCLUSIONS
The “new” Public Procurement Act, many years in the making, was finally assented to by President Ramaphosa and signed into law on 18 July 2024. Almost a year later, at the time of writing, the Act is not yet in effect as it needs extensive regulations to give it practical effect. Public procurement in South Africa is thus somewhat in limbo anxiously awaiting the publication of the regulations which may be done in stages as permitted by the Act.
Responsibility for procurement is decentralised by the Act but the regulations will clarify the extent to which power to determine policies and procedures is centralised.
The Act seeks to reduce the proliferation of legislation and streamline the fragmented public procurement framework into this one act, albeit in concert with other acts such as the CIDB Act and the BBBEE Act and subject to the Constitution.
The Act is applicable to all organs of state including all those entities governed by both the MFMA and PFMA but also extending its reach to private contractors who have been awarded contracts and to those procuring on behalf of organs of state.
Set-asides, prequalification and compulsory subcontracting are among the mechanisms enacted to promote disadvantaged groups and develop under-developed sectors and areas.
A new development is the transferring of duties and powers from the Office of the Chief Procurement Officer to the newly created Public Procurement Office together with extensive new powers and functions. Significant resourcing will be required for this office to function effectively.
Dispute resolution is currently ineffective, time-consuming and expensive. Self-review by procuring institutions has been introduced and a Tribunal created to speed up challenges to decisions and awards and to make effective dispute resolution more accessible. The Tribunal may however, just become another link in the chain as its decisions are subject to judicial review. An important development is the introduction of a stand still period to prevent unlawfully awarded contracts from proceeding while the review process is happening.
The Act is wide-ranging with far-reaching provisions which will take much work to implement. Ultimately the Act should have a positive effect on public procurement but, to achieve continual improvement, is subject to review after two years.
The different groups at the coalface of service delivery, including municipal engineers and the procurement officials, currently known as “Supply Chain” will need to recognise the fact that effective procurement is the lifeblood of local service delivery and will need to work together for the greater good of achieving the sustainable service delivery so desperately needed at local government level.
5.1 Preparation
While much has to be done before the “new” Public Procurement Act comes into effect and while there is still considerable uncertainty about exactly how the system will work, I strongly advise the engineers and procurement practitioners alike not to sit back and wait for instructions.
There is a lot to be done now to read and get to know the Act, talk about the ramifications for your municipality, get to know your local needs and resources, do market analysis, read all the articles you can on and determine training needs.
5.2 Teamwork
If unnecessary time and energy is spent in the “us and them” conflict between the technical departments and “Supply Chain” we run the risk of wasting our scarce resources in fruitless gamesmanship which does not advance the critical objective of service delivery.
The Act puts in place the mechanisms to unblock the service delivery pipeline. It is up to the main players to use these mechanisms. The initiatives in the Act to upskill and professionalise the procurement function should be used to build trust between the various players.
Recognising that all parties are there to serve our communities, get to know each other, have understanding for other points of view and, to use an awful cliché, break down those silos which are placing artificial barriers in the way of service delivery.
African Procurement Law Unit (APLU). 2023. Comments on the Public Procurement Bill [B18-2023]. Available at https://static.pmg.org.za/230913_ APLU_Submissions_on_the_Public_Procurement_Bill_2023.pdf [Accessed 28 June 2025]
Anthony, A.M. 2020. South African infrastructure procurement under the new Public Procurement Bill. 7 African Public Procurement Law Journal 26: 27.
Brunette, R. & Klaaren, J. 2020. Reforming the Public Procurement System in South Africa. Position Papers on State Reform. Public Affairs Research Institute.
H & I Civil & Building (Pty) Ltd and Another v City of Cape Town and Others (59/24) [2024] ZAWCHC 329 (18 October 2024). Published Case Law. Maximum Profit Recovery (Pty) Ltd v Umkhanyakude District Municipality and Another (D12061/2024) [2025] ZAKZDHC 32 (23 May 2025). Published Case Law.
Moseme Road Construction CC v King Civil Engineering CC (385/2009) [2010] ZASCA 13 (15 March 2010). Published Case Law.
Methodology for Assessing Procurement Systems (MAPS). 2024. Assessment of South Africa Public Procurement System. Available at: https://www. treasury.gov.za/comm_media/press/2024/MAPS%20Assessment%20 South%20Africa.pdf [Accessed 28 June 2025]
Republic of South Africa. 1996. The Constitution of the Republic of South Africa, 1996
Republic of South Africa. 1998. State Information Technology Act, No. 88 of 1998
Republic of South Africa. 1999. Public Finance Management Act, No. 1 of 1999
Republic of South Africa. 2000. Local Government: Municipal Systems Act, No. 32 of 2000
Republic of South Africa. 2000. Preferential Procurement Policy Framework Act, No. 5 of 2000
Republic of South Africa. 2000. Construction Industry Development Board Act, No. 38 of 2000
Republic of South Africa. 2003. Local Government: Municipal Finance Management Act, No. 56 of 2003
Republic of South Africa. 2003. Broad-Based Black Economic Empowerment Act, No. 53 of 2003
Republic of South Africa. 2005. Municipal Supply Chain Management Regulations - Gen N 868/2005
Republic of South Africa. 2022. Preferential Procurement Regulations, 2022 - GN 2721/2022
Republic of South Africa. 2024. Public Procurement Act, 2024 (Act No. 28 of 2024)
Republic of South Africa. 2024. Government Gazette No. 50967: 5051 23 July. S A Post Office v De Lacy (19/08) [2009] ZASCA 45 (13 May 2009). Published Case Law.
The Public Procurement Reform Project. 2023. Submission to the Standing Committee on Finance Parliament of the Republic of South Africa on the Public Procurement Bill [B18-2023] Available at: https://drive.google. com/drive/folders/15qrqXmRQrSK77zwCaf2kDVrsKEcrI6AR?usp=sharing [Accessed 28 June 2025]
United Nations. 2011. UNCITRAL Model Law on Public Procurement. Volmink, P. 2014. Legal consequences of non compliance with bid requirements. African Public Procurement Law Journal 41(1): 44–46. Volmink, P. 2022. Deviations and variations in South African public procurement [A note on SCM Instruction 3 of 2021/22]. 9 African Public Procurement Law Journal 52: 52.
JG Palm¹, Chris Koch² Director, JPCE (Pty) Ltd ¹
Director Infrastructure, Weskus District Municipality ²
The regionalisation of waste disposal is promoted by provincial and national government with the aim to close and rehabilitate all the small and often polluting local waste disposal sites in favour of larger properly designed waste disposal facilities in order to reduce potential pollution sources.
Article 84 of the Municipal Structures Act has given District Municipalities the function of establishing and operating waste disposal facilities for more than one local municipality in the district and to develop a waste disposal strategy for the district. The Weskus District Municipality commissioned an investigation into the status of waste disposal in the district in 1997 and after the amalgamation of the municipalities in 2000 developed a Waste Disposal Strategy for the five local municipalities within the district. Due to the fact that none of the existing 20 waste disposal sites within the Cederberg and Matzikama municipal areas had any long-term capacity and most were poorly located, not engineered to protect the environment and with limited operational control, the strategy recommended a new regional waste disposal facility to be established to serve these two northernmost municipalities in the district.
After a number of potentially suitable locations were identified, full Environmental Impact Assessment processes were conducted, including public participation, and the preferred location received Environmental Authorisation and a Waste Management Licence in 2014. The property was procured by the district and rezoned, again with the required public participation process. This was followed by the final design of the facility and eventually construction commenced in December 2023 and was completed in January 2025. The facility received its first waste in May 2025.
Regional waste disposal sites have on the one hand the economy of scale with regards to disposal costs resulting from an engineered basal lining system and proper operational resources, but on the other hand there is an increased cost of transporting waste to a remotely located waste site. Affordability is often questioned by the local municipalities, but when comparing apples with apples, regionalisation has proven to be more affordable than local, properly designed and operated waste disposal sites. Then there is also the additional benefit of reducing the risk to the environment that is often overlooked.
None of the existing landfills within the municipalities of Cederberg and Matzikama have any long-term capacity to serve the waste disposal needs of the municipalities. When given the option by the Weskus District Municipality in 2001, these two municipalities opted for a new regional landfill to serve these two municipalities.
The Weskus District Municipality identified suitable locations for a future regional landfill, conducted a lengthy Environmental Impact Assessment process and obtained a waste management license for the preferred site in
2014. The final design of the facility commenced in 2021 and construction was completed in January 2025.
The first load of waste for disposal was received on 19 May 2025, more than twenty years after this project was commissioned. The paper will discuss the technical detail and the design changes as result of changing legislation, and also the unique complications when more than one municipality is involved.
The cost of regional landfills with its associated transport cost versus local landfills will also be discussed.
Vision: Weskus the caring centre for innovation & excellence.
Mission: Promote drivers of change, by leading well-co-ordinated and innovative initiatives to achieve sustainable and integrated development of West Coast.
The slogan “Laat waai”, popularised by our Executive Mayor, Boffie Strydom, has been a recurring theme for numerous presentations throughout the duration of this project. It captured the motivation that guided us through to the completion and operationalisation of the Weskus Regional Solid Waste Site and on all endeavours of the District Municipality. Translated as “Don’t waste time”, it has come to symbolise the drive, urgency, and commitment that underpinned our efforts led by a dynamic and stable Council, backed by an enthusiastic competent, able and motivated workforce.
The Weskus Regional Solid Waste Site is now officially renamed the Weskus Regional Landfill to align with the entrance signage design developed by the Provincial Roads Department.
The office of the Auditor General of South Africa (AGSA) has published its annual review of local municipalities, covering audit results for the 2023/24 financial year, revealing the Weskus District Municipality as the best-run in the country after it has achieved a clean audit for 14 years in a row (the most in South Africa).
The development and successful commissioning of the Weskus Regional Landfill, a landmark infrastructure project led by the Weskus
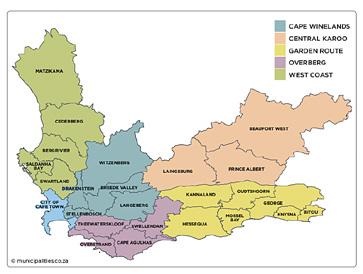
District Municipality (WCDM), was guided by the principles of regulatory compliance, sustainable development, and inter-municipal cooperation. The project addresses the long-standing waste management challenges in the Cederberg and Matzikama municipalities. It further showcases best practices in stakeholder engagement, public-private collaboration, and local economic empowerment. The Weskus Regional Landfill stands as a replicable model for regional infrastructure execution and governance excellence.
Background and Legislative Context
Pursuant to Section 84(e) of the Municipal Structures Act, the WCDM initiated a long-term regional waste management solution. A formal strategy was adopted following the West Coast District Waste Disposal Strategy (2001), which built on consultancy assessments dating back to 1997. The preferred strategic option was the construction of a single regional landfill to consolidate and replace aging, non-compliant local waste sites in Cederberg and Matzikama.
The approved site, Farm Vaderlandsche Rietkuil No. 308, was a decommissioned gypsum mine selected following a rigorous Environmental Impact Assessment (EIA) process. On 10 March 2014, the Department of Environmental Affairs issued a Class B Waste Management Licence stipulating that the activities of the Licence must commence by 10 March 2024 — a statutory deadline that defined the implementation trajectory.
Intergovernmental and Political Coordination
Initial efforts were hampered by inter-municipal complexities, including fragmented procurement responsibilities and political misalignment. The WCDM addressed this through persistent and structured consultations with the Cederberg and Matzikama Municipal Councils and eventually by August 2022, both municipalities passed enabling resolutions, followed by the final approval from Weskus District Municipality Council in January 2023 clearing the path for project implementation.
Schedule 5 of the South African Constitution gives local municipalities the function, amongst others, of refuse removal, refuse dumps and solid waste disposal.
Section 84 of the Municipal Structures Act (Act 117 of 1998) gives district municipalities the function, amongst others, of solid waste sites, in so far it relates to the determination of a waste disposal strategy, the regulation of waste disposal and the establishment, operation and control of waste disposal sites, bulk transfer facilities and waste disposal facilities for more than on local municipality in the district.
The above functions require that when a waste disposal site is served by only one municipality, the responsibility to establish, operate and control that facility resides with the local municipality, but when more than one municipality in a district disposes waste at a waste disposal facility, the responsibility to establish, operate and control that facility resides with the district municipality.
It also requires that when a municipality decides to dispose of its waste at an existing facility of a neighbouring municipality, the responsibility of that site remains with the local municipality since it is an existing site.
Having commissioned a study into the status of waste disposal within the
district in 1997, the Weskus District Municipality extended the study, after the promulgation of the Municipal Structures Act, to develop a district waste disposal strategy and to investigate the establishment of four sub-regional waste disposal sites. However, after the 2000 amalgamation, the number of municipalities within the Weskus District Municipality was reduced to five, i.e. Swartland, Saldanha Bay, Bergrivier, Cederberg and Matzikama.
The waste disposal strategy had to allow for the option of municipalities opting to operate and maintain their own disposal sites, the option to transport and dispose its waste at a neighbouring municipality’s disposal site or for the option to dispose at a new regional waste disposal site. Eight scenarios with cost analyses were therefore developed and presented to the municipalities to choose their preferred scenario.
The most-used arguments against regionalisation of waste disposal are the excessive transport costs because of vast distances and comparing the costs of refuse dumps with that of engineered landfills. The waste disposal strategy that was developed in 2001 compared the costs of regional waste disposal inclusive of the transport costs with the costs of developing and operating local landfills of the same standard and it was shown that the saving in the unit rate of disposal exceeded the additional transport cost, simply because the capital cost of the waste site and the fixed portion of the operational cost were divided by more tonnes of waste.
As example, in current values, the capital and operational transport cost for Cederberg Municipality to get their waste to the regional facility would cost an additional R1,219.41 per tonne, but their saving in disposal capital cost is R1,629.38 per tonne and their saving in disposal operational cost is R474.89 per tonne. Thus a total saving of R884.86 per tonne to transport and dispose their waste at the regional landfill rather than establishing their own local landfill. Matzikama Municipality does not have a transport cost component since the regional landfill is within their municipal boundaries.
Swartland and Saldanha Bay Municipalities, the two southern-most municipalities with existing landfills, opted to continue with their own waste disposal sites. Bergrivier, with no future landfill capacity, opted to transport and dispose its waste at the Swartland and Saldanha Bay sites and Cederberg and Matzikama, the two northern-most municipalities, opted to have a new regional landfill established for their use. The Weskus District Municipality had, in terms of their function, to establish, operate and control such a facility.
The scenarios selected by the five local municipalities were incorporated into the Municipal Solid Waste Disposal Strategy of the WCDM in September 2001.
The WCDM embarked on the identification of the suitable areas for the establishment of a regional waste disposal facility within the boundaries of the Cederberg and Matzikama municipal areas in 2008.
The identification of potentially suitable areas where a landfill can be established is done with a methodology referred to as negative mapping where all the areas that are unsuitable in terms of criteria published in the Minimum Requirements guideline (then Department of Water Affairs), are eliminated. The remaining areas are then investigated and evaluated according to environmental and technical grounds.
The criteria used to provisionally eliminate areas from further consideration were based on the identification of areas with inherent Fatal Flaws as defined in the Department of Water Affairs and Forestry’s Minimum Requirements
document (DWAF, 2005). These include the following:
• Areas in proximity to significant surface water bodies,
• Sensitive ecological and/or historical areas,
• Catchment areas for important water resources such as dams,
• Area overlying or adjacent to important or potentially important aquifers,
• Areas overlying or adjacent to major fault zones,
• Areas with highly permeable soils,
• Areas associated with steep slopes, and
• Areas in close proximity to land uses which are incompatible with waste disposal.
All the overlays showing the above criteria are superimposed on each other to produce a composite map, areas where none of these criteria are present are indicated as “windows” of potentially suitable land for the establishment of a waste disposal site.
The study has shown that important and vulnerable aquifers under most of its municipal area make Cederberg an unsuitable location for waste sites. Since some of the map sets used are relatively old, site visits to these areas were undertaken to verify the information on the maps. Potential sites were identified within these windows and subjected to an Environmental Impact Assessment (EIA) process to determine the most suitable site.
Of the four candidates indicated in the above figure, the site near Klawer was rejected on grounds of visual impact and incompatible land use and the northern three were submitted to an EIA, inclusive of extensive public participation and specialist studies on geohydrology, geotechnics, visual impact, botany, agricultural impact, air quality impact and heritage.
After a lengthy EIA process, the site labelled as Site C was considered the most suitable site, and an Environmental Authorisation was issued to the
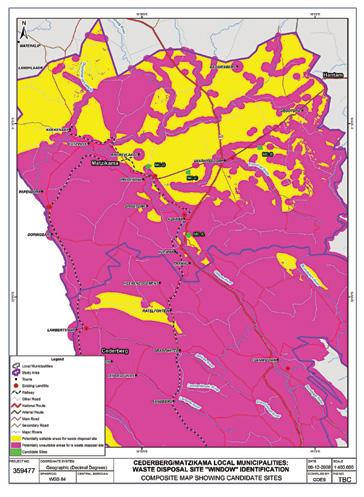
FIGURE 2: Composite map indicating suitable areas
WCDM on 24 February 2014 to establish a waste disposal site and associated infrastructure on this site. This site is located approximately 1km south of the R27 (Vredendal – Vanrhynsdorp road) and approximately 8.5km east of the R27 and R362 (Vredendal – Klawer road) intersection.
At the time that the EIA was conducted, waste licensing resided under the Environment Conservation Act (Act 73 of 1989) and the process consisted of obtaining Environmental Authority for the activities planned on a specific site, followed by a waste permit application to the Department of Environmental Affairs and Tourism. However, during the environmental impact assessment process, the National Environmental Management: Waste Act (Act 59 of 2008) was promulgated as the first comprehensive act to regulate waste management in a proactive way. This changed the waste management licence application process to a combined application that included both the environmental authorisation process and the licence application. Since the licensing process had already commenced with the promulgation of the Waste Act, this application was in the transitional period and the “old” licensing process was allowed to be finalised.
Also, since the design engineers were aware of planned amendments to the design requirements as reflected in Minimum Requirements, the licence application for Site C was accompanied by a design of the basal liner in accordance with the anticipated National Norms and Standards for disposal of waste by landfill for Class B sites. These Norms and Standards were published on 23 August 2013 in the Government Notice No R636 in Government Gazette No 36784 and the licence issued in 2014 stipulated a containment barrier for a Class B waste disposal facility. The design submitted with the licence application was approved and obtained a positive Technical Record of Decision from the then National Department of Water Affairs.
On 10 March 2014 a Waste Management Licence was issued by the provincial Department of Environmental Affairs and Development Planning for the establishment of a Class B waste management facility on Portion 2 (a portion of portion 1) of the farm Vaderlandsche Rietkuil No 308 Vanrhynsdorp. A period of five years was stipulated in the licence in which the activity, amongst others the construction of the facility, must commence.
No appeals were lodged against the issuing of the waste management licence.
The property, 151.5 hectares in size, was previously used for mining activities and was procured in 2019 by the Weskus District Municipality after being appraised by an independent valuator.
The zoning of the property was Agricultural Zone 1 and an application was lodged at the Matzikama local municipality for the rezoning to Authority Zone in order to establish a regional waste management facility. After again following a public participation process the rezoning was approved in June 2020.
Since this project was the establishment of a new regional waste facility, the following infrastructure was required:
The licence conditions stipulated that a two-way access road be constructed with material that will create minimal dust, an asphalt surfaced access road of approximately 1.1km was designed between the R27 and the site entrance.
Segmented paving roadworks were designed at the site entrance and the weighbridge area as well as gravel surfaced site roads from the weighbridge to the base of the disposal cell.
As per the licence conditions the whole of the site had to be fenced with security fencing.
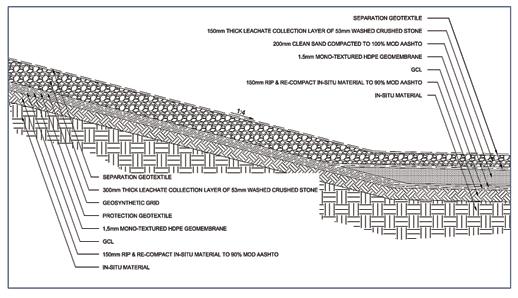
Access control facilities were designed as well as a weighbridge to accurately record incoming waste loads. Accurate waste recording and monthly reporting to the licensing authority is a statutory requirement. Offices, an ablution facility and a small workshop were added to cater for the day-today operations.
Waste diversion facilities such as a recycling facility, builder’s rubble crushing area and garden waste chipping area have spatially been provided for, but will only be designed and constructed if required. The intention is that the two contributing municipalities will provide local diversion infrastructure to reduce transport costs and to create local work opportunities.
It is a requirement that external and internal storm water be separated to minimise the risk of storm water contamination and as such a storm water drainage system must be provided to accommodate a 1 in 50-year storm of 24-hour duration.
The design and specified operation of the cells are such that all run-off water from the sides of the landfill will be uncontaminated and all contaminated or potentially contaminated water will remain on the waste area.
Leachate Management Structures
Leachate will drain from the disposal cell to a pump sump from where it will be pumped to a double-lined leachate evaporation pond.
In accordance with the Norms and Standards (2013) a class B containment liner is required for the disposal of general waste.
A typical class B liner consists of 600mm compacted clay overlain by a 1.5mm High Density Polyethylene (HDPE) overlain by a protection layer and finally overlain with a stone layer for the drainage of leachate.
The local soils were found to be of insufficient quality to be used as compacted clay layers in the basal liner and was replaced with a geosynthetic clay liner (GCL).
The basal liner that has been designed (and approved) for the Weskus Regional Landfill is indicated in the following figure.
The first cell has 271,000m3 airspace and has been designed for a sevenyear lifespan based on projected waste volumes from Matzikama and
Cederberg calculated from population data since no weighbridges exist at current local facilities.
Tender Process
A public tender for the construction of the new landfill closed on 14 March 2023 with a pre-qualification of a specified minimum square meters of geocomposite landfill or mining liners on previous projects to ensure that an experienced contractor be appointment.
The construction contract was awarded with the commencement date of 8 December 2023 and a construction duration of 40 weeks.
An important aspect with the construction of landfill liners is the construction quality assurance that must be conducted on the installation of various layers of the composite liner over and above normal construction monitoring. This includes amongst others quality assurance, with independent laboratory tests, of the compliance of the manufactured geosynthetic materials with the specifications, the quality of installation with regards to the integrity of the welding joints of the HDPE, thickness of layers and ensuring that all material used conforms to the specification both for supply and installation. Construction quality assurance requires full time personnel on site for the duration of the liner installation. All the construction quality assurance results must also be compiled in a summarized report, the Construction Completion Report, and submitted to the Department of Water and Sanitation before the construction of the cell is approved and disposal of waste may commence.
Initial indications were that construction would be fairly trouble free considering the remoteness of the site. However, it turned out to be one of the wettest seasons in over a decade and the clayey soils caused many delays, not only for the abnormal weather but also for consequential delays. Excessive wind speeds also made the installation of the geomembrane difficult as the sheets were simply blown away before it could be welded in place and covered with the sand protection layer. High wind speeds seemed to occur from midday to late afternoon, and the installation of the geomembrane was limited to morning and night shifts. This resulted in numerous claims for extension of time.
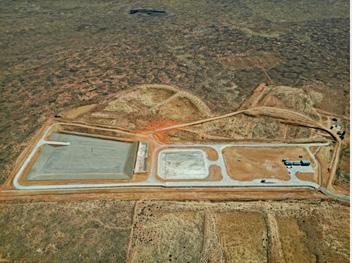
Practical Completion of the construction was issued on 31 January 2025.
See below photograph for an aerial view of the waste site.
A key component of the project was local economic development, specifically:
• Sourcing materials and fuel locally,
• Subcontracting local SMMEs
• Employing community labour
• Installation of a Weskus designed, prefabricated wastewater treatment plant enabling us to re-use the effluent for gardening purposes.
• 77 direct jobs created (including 4 women and 21 youth)
• R13.7 million (excl. VAT) in local procurement Community cooperation was exemplary, with no reported project resistance or disruption.
Landfill construction must, in accordance with the Technical Record of Decision issued with the approval of the design by the Department of Water and Sanitation, be approved by the department after scrutinizing the Construction Completion Report and a site visit by departmental officials. Even though a Construction Completion Report was not requested in the Technical Record of Decision issued in 2014, the department still insisted on it being compiled and submitted. Fortunately, the departmental officials were visiting another landfill in the Western Cape and decided to, at the same time, conduct the site visit on 10 April 2025.
Since the amended National Norms and Standards of 7 November 2024 lists the placing of the pioneering layer of waste (first layer of waste on the liner) as soon as possible after completion of construction to protect the separation geotextile on top of the leachate drainage layer, as good engineering practise, correspondence was sent to the licensing authority to immediately start with the placement of the pioneering layer of waste – to which there was no objection.
The operation and management of the landfill up to 30 June 2027 was put out on a public tender process. The tender had a minimum number of years of landfill operating experience as pre-qualification criteria, again to ensure that an experienced contractor be appointed.
The operating contractor was appointed, completed their establishment on site and received training from the weighbridge software provider.
The first loads of waste were received on 19 May 2025 from Matzikama Municipality using their collection vehicles, but waste from Cederberg Municipality cannot yet be transported economically to the new regional facility due to their transfer infrastructure not yet constructed.
The operational contract is being managed by monthly contractual meetings and third-party certification of monthly payments due to the contractor.
The costing of the regional facility was regularly updated during the years of planning by using a business case model to indicate the capital, operational and future rehabilitation costs associated with the regional landfill as well as the waste infrastructure required by the two local municipalities to get their waste to the regional landfill. All of the above costs were presented as a municipal household tariff per month to illustrate the affordability of the project. Although the projected household monthly tariffs for refuse removal of the two municipalities were to increase, it would still represent approximately the median of monthly tariffs charged by all municipalities in the Western Cape.
The cost of the completed landfill was R93,965,971 (incl VAT), R3.27 million under budget – a rare feat for infrastructure projects of this magnitude and also considering the inclement weather encountered.
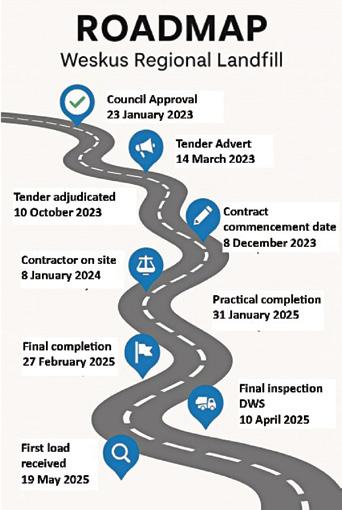
• Funding secured via the Development Bank of South Africa (DBSA)
• Municipal loan structured over 20 years.
• Initial 2-year capital repayment holiday negotiated to stabilize cash flow and tariff structures.
• Tariff modelling agreed upon with Cederberg and Matzikama municipalities to ensure affordability and includes a pro rata availability amount plus an operational tariff and a rehabilitation tariff. This structure reflected sound financial stewardship and sensitivity to the municipalities’ participation in the Eskom Debt Relief Program.
The Weskus Regional Landfill project represents:
• Full compliance with national and provincial environmental regulations
• Sustainable, regionalized service delivery in solid waste management
• Effective intergovernmental collaboration
• Significant local socio-economic benefits
• Fiscal discipline and risk mitigation
This project sets a high standard for integrated, sustainable, and peoplecentred infrastructure delivery in South Africa.
The Weskus Regional Landfill project has a long history of over twenty years from the moment the regional scenario was selected up to the point where Council may the decision to proceed.
Below is a timeline indicating the relative short time span of two years from when the decision to proceed was made until the landfill was constructed. In terms of the waste hierarchy of preferred waste management options the generation of waste should be avoided, and the waste that was generated should be diverted from disposal. Only the waste that cannot be diverted should be disposed at properly designed and operated landfills.
The Weskus Regional Landfill is a properly designed and operated landfill and will serve as a safety net for all waste generation that cannot be avoided or diverted through other beneficial technologies or uses, even when such technologies are down for maintenance. It is the responsibility of the Weskus District Municipality to ensure that the operation, maintenance and further development of the Weskus Regional Landfill is in accordance with best environmental practise.
It is the responsibility of the local municipalities to divert as much of their generated waste from landfill through technologies such as recycling, composting, etc. not only to pay less disposal costs or transport costs, but to improve the environmental sustainability of waste management as a whole.
Constitution of the Republic of South Africa, (Act 108 of 1996)
Department of Environmental Affairs, National Environmental Management: Waste Act, National Norms and Standards for Disposal of Waste to Landfill, Government Gazette, 23 August 2013.
Department of Water Affairs and Forestry, Minimum Requirements for Waste Disposal by Landfill, Second Edition. 1998
Environment Conservation Act (Act 73 of 1989)
Local Government: Municipal Structures Act (Act 117 of 1998)
Matzikama/Cederberg Local Municipalities: Waste Disposal Site “Window” Identification, SRK Consulting. October 2008
National Environmental Management: Waste Act (Act 59 of 2008)
West Coast District Municipality, Municipal Solid Waste Disposal Strategy, Entech Consultants (Pty) Ltd. September 2001
Graeme Taylor Tecroveer
This paper identifies critical innovations in treatment technologies and delivery frameworks, offering a scalable model for infrastructure development across South Africa and globally. It also applies a qualitative case study methodology. It incorporates project documentation, technical performance reports, and publicly available governmental and media sources. Operational metrics were analysed in order to evaluate the efficacy of the system. Stakeholder interviews and published public statements were used to reconstruct the coordination efforts.
Beyond constructing a treatment plant, the project aimed to:
• rebuild public trust in service delivery,
• demonstrate the power of local innovation,
• offer a scalable and replicable solution to address national water infrastructure challenges, and
• circumvent threats from criminal interference and bureaucratic inertia.
The project served as a crucial test of South Africa’s ability to rapidly and collaboratively deliver critical infrastructure, without compromising water quality or safety. The awarded tender specified the construction of four 12.5 megalitres per day (MLD) modular treatment units, housed within a single structure and equipped with an overhead crane to enable efficient installation and streamlined operations.
1.1 The Background
Access to clean, safe drinking water is a persisting global challenge. Urbanisation, ageing infrastructure, water source contamination, and climate variability all intensify the pressure exerted on water supply systems. In South Africa, these problems are compounded by collapsing wastewater treatment facilities that pollute water sources, public health emergencies, inadequate rural services, criminal syndicates controlling water delivery, and political challenges.
South Africa faces a mounting water crisis that demands immediate and innovative solutions. Its water infrastructure is under unprecedented pressure due to a convergence of climate unpredictability, population growth, ageing assets, corruption, and institutional weakness (Hlahla & Hill, 2024).
Infrastructure News reports that many pipelines are over 70 years old. Pipe theft and meter tampering add pressure to already strained urban and rural systems, while vandalism and mismanagement further erode their reliability. Criminal syndicates, dubbed the ‘water mafia’, further complicate the implementation of recovery models for traditional infrastructure. In Gauteng, the Financial Times documents frequent water cuts, despite full dams, driven by ageing infrastructure, poor maintenance, and leakage approaching 35% of total supply. These failures have led to disease
outbreaks, including a cholera outbreak in Hammanskraal, which prompted the South African government to formally declare a national emergency in January 2024.
1.2 The Hammanskraal
Few have felt the effects of these challenges as keenly as the people of Hammanskraal and surrounding areas who have not had access to safe potable water for more than a decade, due to many of the barriers noted above including but not limited to:
• in excess of a 30% polulation increase over the past decade without any significant increase in potable water infrastructure or capacity
• aging infrastructure operating at well below design e.g. Temba Water Treatment Works, that historically provides the majority of water to Hammanskraal, producing 30 to 60MLD out of the potential 120MLD installed
• the compromised Rooiwal Waste Water Treatement Works, that has been in the spotlight of both local and international news, discharging raw or partially treated sewage into the Apies River resulting in heavily polluted source water for the already challenged Temba Water Treatment Plant which was unable to treat the source water to potable quality.
• criminal water cartels
• associated social unrest.
The crisis escalated in May 2023 when a fatal cholera outbreak struck the Hammanskraal community, drawing both national and international attention. As public anger grew, it became a symbol of state failure, institutional collapse, and political dysfunction. By the end of 2023, Hammanskraal had become emblematic of South Africa’s water crisis. National reports on the crisis, such as the Blue and Green Drop audits which confirmed that more than half of South Africa’s water infrastructure to be in a critical state, identifies Hammanskraal as the area most urgently in need of intervention, due to the combined impact of source water pollution, infrastructure failure, and the cholera outbreak.
While traditional project response has been the backbone of the development of South Africa’s infrastructure, it fall short in many ways in the face of Emergencies such as Hammanskraal. To address the crisis in a traditional way would have required, as a minimum, the compliance of Rooiwal and the refurbishment of Temba, a process that if approached through traditional mechanisms would have attracted timelines and costs that were many orders of magnitude beyond the pressing need.
It was clear that the crisis could only be addressed through new and forward-thinking intervention.
Due to the strategic potential of the Klipdrift Water Treatment Plant under Magalies Water, the site was selected for the rapid delivery of potable water. The site benefits from ongoing compliance of quality and quantity
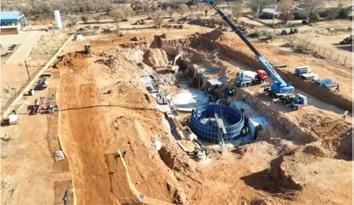
as well as, and most importantly, abstraction from the Pienaars River, a sufficiently clean water source suitable for the production of potable water. In 2024, the Hammanskraal Emergency Water Treatment Project was launched in response to the crisis.
The project includes a number of packages such as increased abstraction capacity, a new 10Ml reservoir, modifications and upgrading of the pipe network. At the heart of the project was the approval of a 50MLD emergency treatment solution , and Pro-Plan Consulting Engineers appointed Tecroveer to deliver a modular package treatment system to address this requirement.
The project faced several systemic and site-specific challenges, in spite of which, the team navigated the project to successfully achieving the first 12.5MLD of potable water only 10 months after the tender was advertised:
• Bedrock excavation: unexpected geology required chemical breaking of rock, delaying module 1 (Tshwane Municipality, Polity.org.za (see Figure 1).
• Energy instability: a malfunctioning substation and Eskom’s unreliable electricity supply caused delays (Polity.org.za,).
• Vandalism: illegal taps compromised commissioning; enhanced security protocols had to be implemented (LinkedIn, Tshwane Bulletin, unpublished).
• Upstream pollution: Due to the ongoing malfunction of the Rooiwal Sewage Treatment Plant, the Apies River remained polluted, preventing full systemic recovery (Infrastructure News, unpublished data). To address this, the emergency plant was located at the Klipdrift Water Treatment Plant, (Intrastructure News) with the network reconfigured to draw water from Pienaars Rivier instead of the Apies River. This reversal of the water source bypassed the Temba Water Treatment Plant’s reliance on the polluted Apies River.
• Public distrust: the community remained sceptical, despite official communications, necessitating transparent testing and outreach (News24, Parliament of South Africa).
2 WORLD-FIRST WATER TREATMENT INNOVATIONS AT HAMMANSKRAAL (THE CALABASH)
The awarded tender outlined the construction of four 12.5MLD modular water treatment units within a single building, equipped with an overhead cranes to enable fast deployment and streamlined operations (see Figures 2 and 3). Tecro veer was appointed on the strength of a concept they proposed and immediately began developing, that challenged conventional technologies in order to meet the emergency needs of the project. The modular unit, designed by Tecroveer and known as the Calabash, incorporates seven comprehensive treatment stages: dosing, flocculation, de-gritting, desilting, flotation, filtration, and disinfection.
While other modular plants have greater overall treatment capacities by combining multiple smaller modules (e.g., in facilities exceeding 100 million
gallons per day [MGD]), the Calabash is one of the largest modular package units globally. In addition, each Calabash includes the largest publicly documented single-unit moving bed media filter (MBF) to date (see Figure 4). The MBF being an alternative to gravity media filters which offers the many advantages listed below and in which the water is filtered upwards rather than downwards.
The following subsections shed light on how the Calabash achieves flocculation, degritting, desilting, flotation, and filtration in a single modular unit without the need for individual structures for each step or the associated interconnecting pipes and pumps.
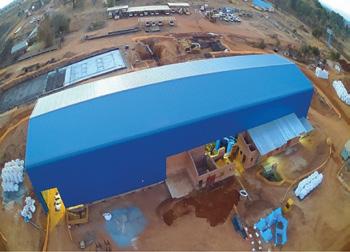
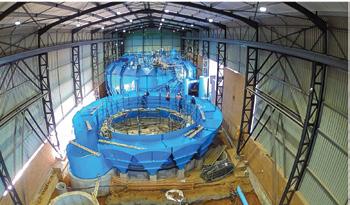
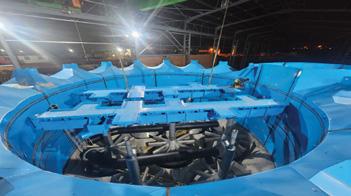
2.1.1
Flocculation, initiated by introducing a coagulant, - a chemical agent that neutralises the electrical charges keeping fine particles suspended in watercauses small particles that would otherwise remain suspended to form larger particles (flocs). The flocs can then settle out in a sedimentation tank or be trapped in a filtration system. The Calabash incorporates a circular tank that allows for the introduction of a coagulant before entering the flocculator, where gentle mixing facilitates floc formation.
2.1.2
While the final solution includes sedimentation tanks to remove grit and sediment the Calabash was required to operate for 2 summer seasons without any upfront solids removal and a degritting feature was included as part of the flocculation compartment with all velocities prior to flocculation being maintained high enough to ensure no settlement in the feed network.
2.1.3
Dissolved air flotation (DAF) is used in water treatment to effectively remove suspended solids, algae, oils, and other fine particles that are difficult to settle by gravity. Instead of allowing these impurities to sink, DAF systems lift them to the surface for removal, resulting in clearer, cleaner water for further treatment. DAF operates by introducing microbubbles into the tank, which attach to the flocs. Due to the combined specific density of the flocs and microbubbles, they rise to the surface, forming a scum / float layer of algae and impurities. These are then removed through a process called descumming / defloating. This process is especially useful for water sources that are heavily polluted or contain large volumes of light, buoyant contaminants. By incorporating DAF into the treatment train, the system significantly improves overall water clarity and reduces the burden on downstream filtration systems.
An innovative approach was developed to enhance microbubble generation in the white-water stream exiting the saturator. Rather than relying on multiple precision-engineered nozzles, this solution uses a purpose-designed internal restriction that produces a sharp drop in the water pressure, promoting fine air dispersion. The result is consistent microbubble formation and effective saturation, offering a significantly more cost-effective and low-maintenance alternative to traditional multi-nozzle systems
The travel distance in the DAF was optimised to ensure float formation and settlement. Removal of float and silt in the DAF was researched and improved by experimenting with existing float formation systems.
2.1.4 Filtration
After coagulation, flocculation, and sedimentation, water still contains fine particles and micro-organisms. This water is directed into the moving bed media filter (MBF).
Filtration occurs through the media bed:
• The water flows upward through the media. There are two particle removal mechanisms:
• Straining: large particles are physically trapped between media grains.
• Sedimentation: heavier particles settle between media pores. Backwashing is achieved through the process of continuously, hence the term moving bed, lifting by means of an air lift pump, small quantity of media from the bottom of each filter cell through a sand washer, located above the media bed, where the sand is washed and returned to the top of the media bed.
To meet the design requirements of implementing this technology in a modular package plant, nine months of continuous research and development led to the implementation of a prototypal up-flow filter – the largest ever integrated into such a system.
2.2 The competitive edge of the Calabash
The Calabash units are able to achieve the following:
• 16.5MLD per unit (compared with the contracted 12.5MLD), setting global benchmarks (see Table 3).
• 50MLD achieved by three units (16.5MLD each), allowing the fourth to provide additional capacity or to remain on standby for use during maintenance at either the original or new plant.
• Energy usage under 50kW/ML of treated water.
• Hydraulic head loss of less than 2m.
• A horizontal plug-flow DAF with a 98–99% Nephelometric Turbidity Unit (NTU) removal efficiency during high NTU periods and almost zero shortcircuiting.
The Calabash outperforms other systems in the following areas:
• Modular pre-engineered design for fast and cost effective implementation.
• Automated dissolved air float removal at between 3% and 6% solids, without any mechanical mechanisms and with minimal water loss.
• Separation of the DAF and filter, with silt collection at the bottom of the DAF, eliminating media blinding caused by settlement, a typical issue with the existing counter-current dissolved air flotation/filtration (COCO-DAFF) process.
• Separation of the DAF float and the waste stream (de-gritting, desilting, and backwash), combined with the high solids content of the DAF float, has reduced the required capacity of the float dewatering plant by two-thirds.
• Each unit has a single circular moving bed filter module with an active filtration area of 75m2, containing 7 cells each with an active filtration area of 10.7m2. This is, as far as the author is aware, the largest implementation of a moving bed filter module globally.
• Less than 5% total water loss through de-gritting, desilting, flotation, and backwash (see Table 2).
2.3 The advantages of using the Calabash
The innovative design of the modular package unit made it possible to deliver potable water under budget, just ten months after the tender was released to market. Its pre-engineered, modular design maximised off-site manufacturing and enabled the fast and cost-effective implementation of the project (see Figure 5).
The system has been designed to use fewer materials, less water, and less energy. By producing a smaller foot print than conventional water treatment plants and having a reduced environmental impact, it aims to protect natural resources. It is also more economically viable, having been implemented at a lower cost over a shorter period. Its modular design consists of robust, adaptable systems that are easier to maintain.
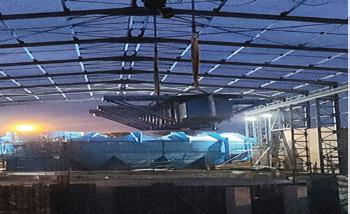
TABLE 1: Plant Data
Performance During Highest NTU
TABLE 2: Plant Data
It boasts the largest circular moving bed filter modules globally. It is resilient by design, engineered to withstand environmental stressors. It can treat various water conditions, and has the ability to purify water with turbidity levels ranging from 1 to 400 NTU (a measure for how poor the water quality is). (See Table 1 and 2.)
The Calabash holds the following advantages:
• Utilises only 50% of the coagulant required by the existing plant.
• Enables automatic, continuous removal of float in the DAF, without moving mechanical components or labour-intensive methods.
• Results in an average water loss of just 3.5% during the continuous backwash process, with no system downtime.
• Reduces water loss during DAF float removal, improving the dewatering efficiency of the float.
• The continuous, gentle washing of the filter media doubles the lifespan of media in the sand filter.
• Each treatment unit has a single white-water nozzle external to the DAF, allowing maintenance and replacement without entering the DAF.
• Compared with a conventional plant, it is much less expensive to operate.
• Constructed in less than half the time of a conventional treatment plant.
• Consumes less energy than a conventional plant.
• Modular units are scalable and reconfigurable.
• Allows rapid deployment in emergency situations.
• Achieves 33% higher throughput compared to conventional plants.
• Requires less than half the space of conventional plants.
The efficiency and innovation of the project contributed significantly to value creation. Tables 1 to 3 provide data on the success of the system.
3 COLLABORATIVE ENVIRONMENT
The key differentiators that contributed to the project’s success included the integration of a world-first South African water treatment innovation, an unwavering focus on service delivery, and a uniquely collaborative environment. This collaboration brought together all stakeholders: central and local government, the water authority, engineers, contractor, subcontractors, and local communities, and continued to grow as the project progressed.
Considering the adversarial and conflict-ridden environment that typically characterises the construction industry, the collaborative environment could be considered the project’s greatest achievement. In addition, no delays were caused by construction mafia or community unrest.
TABLE 3: Comparison to Similar Systems
What makes the project remarkable is the seamless alignment of national, provincial, and local authorities alongside private sector innovation. Key factors included:
• Intergovernmental coordination: Minister Majodina chaired regular oversight meetings that involved the Department of Water and Sanitation (DWS), Gauteng Province, the City of Tshwane, and Magalies Water.
• Technical implementation: Tecroveer, through Pro-Plan, delivered the modular units, with Magalies Water as the implementing authority.
• Security: the Klipdrift Water Treatment Plant, which was declared a National Key Point, was protected by the South African Police Service (SAPS), Metro Police, and private security.
• Community integration: the City of Tshwane conducted network flushing, meter audits, and phased ward-level supply.
• Public transparency: the regular publication of water quality results and civic briefings helped rebuild public trust.
• Government response: by correctly identifying, acknowledging, and managing the non-potable water of Hammanskraal and its surrounding areas as a crisis that called for an emergency intervention, authorities enabled clear project intentions. This significantly reduced bureaucracy, provided ongoing support, interaction and progress monitoring, and enabled continuous feedback to all stakeholders.
This collaborative environment encouraged social responsibility and equity. With the full support of the local community, residents were employed and trained to assist in the construction, operation and maintenance of the unit. As a result, marginalised communities and all stakeholders were included.
4 PROJECT PRINCIPLES
The team prioritised principles that were followed in a strict order of precedence, with each principle regarded as ten times more important than the next, i.e. a logarithmic scale of Team 100, Service 10, and Repeatable Technology 1. This order of importance was necessary to prevent the reversal of priorities under pressure, often leading to conflict and impaired problem-solving.
4.1 Team: Emphasising collaboration and conversation at every level. This principle was established on two foundational building blocks. First, the belief that because they are one people with one language, nothing they plan will be impossible for them (Genesis 11:6). Second, the understanding that
cell
failure and conflict often result from a lack of dialogical communication. This principle established a project environment in which we managed to meet seemingly unobtainable objectives.
The above-mentioned project environment was consistently experienced at every level within the project. All involved were willing to do more than what was asked and recognised the value of the contribution of every team member. A key moment occurred during a site inspection and media briefing, when the Minister and the Mayor of Tshwane stated: ‘It was those on the ground building the plants that should be celebrated for building the nation.’ They then took their seat among the audience for photographs. An entire paper could be written on this point alone, and the spectacular impact that it had on the project’s success.
4.2 Service: Maintaining focus on the project objective of delivering clean water
A continuous focus on the project’s intention to deliver potable water provided the shared vision that united the team towards achieving the common objective. It also ensured sensible decision-making that was in the best interest of the project, with the purpose/service promise remaining the guiding vision and priority of the project.
4.3 Repeatable technology: Designing with future replication in mind. A mindset geared towards designs that enable future replication meant that the team achieved beyond the minimal contractual obligations. The solution not only met immediate requirements, it exceeded expectations.
4.4 Maximum benefit: Serving all stakeholders.
Rather than focusing solely on the minimum contractual obligations, the team prioritised a solution that would provide maximum benefit to all stakeholders involved.
4.5 Focus on innovation.
From its very inception, innovation has been the focus of the project both in setup and proposed solutions.
• There has been a clear understanding that because problems are dynamic in nature, innovative thinking is crucial Old ways of approaching problems will not always suffice.
• This project’s environment of innovation has paved the way for continuous development and improvement throughout the implementation of the project, and was a key driver of the project’s achievements.
4.6 The adoption of a combination of project management approaches. Adopting a combination of project management approaches made the real-time development needs of this project possible. This would not have been possible with the traditional waterfall, batten handing, or linear approaches.
Elements of Agile 2 – an approach that prioritises collaboration, open communication, and shared understanding – were combined with adaptive and package project management methodologies. This integrated approach enabled different aspects of the project to advance in parallel while ensuring they remained interconnected and aligned.
5 CONCLUSION
This paper identifies critical innovations in treatment technologies and delivery frameworks, offering a scalable model for infrastructure development across South Africa and globally to restore access to clean water swiftly and sustainably. It has become a benchmark of modular engineering and cross-sector collaboration.
Most importantly, the project reaffirmed that crises demand new thinking, because problems are dynamic in nature, innovative thinking is crucial. If future interventions are to succeed, our approaches must be adaptive, inclusive, locally grounded, and scalable. Key insights include:
• Flexible project management: blending adaptive, agile, and parallel approaches allowed technical and social elements to evolve together.
• Community engagement: transparency of water quality results and ongoing civic leadership helped rebuild public trust.
• Modular, repeatable design: solutions were created with replication in mind, ensuring that this was not a once-off success, but a potential national blueprint.
• Team cohesion: prioritising unity over rigid roles enabled multistakeholder coordination – from national ministers to field contractors.
• Clear emergency designation and political alignment were essential in accelerating timelines and cutting through red tape.
The Hammanskraal Emergency Water Treatment Project stands as a benchmark for managing complex infrastructure failures under critical conditions. It is not only an example of technological innovation, but also of systemic learning, collaboration, and project discipline.
The Hammanskraal Emergency Water Treatment Project should serve as a launchpad for future infrastructure solutions.
Its success lies not in isolated actions, but in a replicable method and mindset – one rooted in sustainability, speed, and cooperation. Future initiatives should:
• Prioritise modular, scalable, and sustainable engineering designs across water and broader infrastructure projects.
• Create integrated delivery teams that bridge departments, spheres of government, and technical partners.
• Invest in technologies and systems designed for repeatability, agility, and localised adaptation.
• Ensure engineering decisions are directly linked to community impact, including long-term environmental and social outcomes.
• Foster a culture that rewards new thinking: problems are dynamic in nature; therefore, innovative thinking is crucial
Hlahla IS & Hill TR 2024. Overcoming systemic and institutional challenges in policy implementation in South Africa’s water sector. Sustainable Water Resources Management Volume 10, article number 2 DOI:10.1007/s40899024-01040-3
Polity.org.za 2023. Hammanskraal project delay due to rocky terrain. Available at: https://www.polity.org.za/article/rocky-terrain-delays-hammanskraalwater-project-2023-09-18 [Accessed 11 Aug 2025].
City of Tshwane 2023. Hammanskraal water project update. City of Tshwane Media Statement, September 2023. Polity.org.za 2023. Eskom supply instability affecting infrastructure projects Available at: https://www.polity.org.za/article/infrastructure-projects-facesetbacks-amid-eskom-instability-2023-08-21 [Accessed 11 Aug 2025].
City of Tshwane 2023. Hammanskraal Water Update. LinkedIn post, September 2023. Available at: https://www.linkedin.com/pulse/ hammanskraal-water-crisis-city-tshwane-update/ [Accessed 11 Aug 2025]. Tshwane Bulletin 2023. Community interference during installation phase August 2023 edition, p.4. (Print publication) Infrastructure News 2023. Rooiwal pollution continues to affect Hammanskraal. Available at: https://infrastructurenews.co.za/2023/08/25/ rooiwal-pollution-hammanskraal-response/ [Accessed 11 Aug 2025].
GroundUp 2023. Tshwane failed to maintain Rooiwal plant. Available at: https://www.groundup.org.za/article/tshwane-failed-maintain-rooiwalplant/ [Accessed 11 Aug 2025].
News24 2023. Public trust and water safety in Hammanskraal. Available at: https://www.news24.com/news24/community-newspaper/rekord/ hammanskraal-residents-demand-water-transparency-20230610 [Accessed 11 Aug 2025].
Parliament of South Africa 2023. Water and Sanitation Committee demands answers on Hammanskraal crisis. Briefing, May 2023. Available at: https:// www.parliament.gov.za/news/water-sanitation-committee-demandsanswers-hammanskraal-crisis [Accessed 11 Aug 2025].
Bhavna Soni, Roxanne Canny eThekwini Water & Sanitation Unit
In light of the declining state of municipal services and South Africa’s constrained economy, made worse by the impact of climate change, the country’s eight leading metros—Buffalo City, City of Cape Town, City of Ekurhuleni, City of eThekwini, City of Johannesburg, Mangaung, Nelson Mandela Bay, and City of Tshwane—play a critical role in sustaining growth and service delivery. National Treasury, in partnership with the Presidency and the Department of Water and Sanitation, has initiated a reform process targeting urban water and sanitation services, particularly within metropolitan municipalities where the impact is most severe.
The Metropolitan municipalities are the prime target for these reforms due to the magnitude of the crisis that the sector is experiencing and the high level of impact that this is causing on the economy, society and to the water and sanitation industry in South Africa as a whole.
Recent analysis of the key indicators in the metropolitan municipalities water & sanitation sector, depicts a picture of under investment for number of years. Mid-year budget review in 2024 indicated that despite the increase in access to water and sanitation services, there is not enough investment in bulk services like wastewater treatments and water treatment, and maintenance in general. Thus, it is recognized that part of turning around municipal water business will require significant investment. The Municipality alone will not be able to meet the investment needs to have significant impact, while failure to provide a solution to the glaring challenges will collapse the economy of both the city and the country.
To address this challenge National government is working with the municipality to develop a long-term sustainable solution in addressing the under investment. National government has produced an incentive grant, which requires Cities to develop a turnaround strategy that sets out clear goals with time bound targets and includes a practical way to develop the necessary capability to implement the strategy effectively. This paper will show how eThekwini Water & Sanitation unit has developed their Turnaround Strategy with the required road map and clear implementation plan that will be measured.
South African municipalities, particularly the eight metropolitan municipalities (Category A), are grappling with a steady decline in the performance of core trading services—water and sanitation, electricity, and solid waste management. This decline is attributed to deteriorating infrastructure platforms, increasing operational inefficiencies, declining service reliability, and limited investment in maintenance and upgrades. These factors threaten not only service delivery but also the long-term financial sustainability of cities. Recognizing these challenges, the National Treasury launched a structured reform programme in 2024, supported by a series of Guidance Notes. These notes serve as policy instruments to drive performance-based reform of
municipal trading services. They set out the rationale for change, define eligibility criteria for conditional grant funding, and outline expectations for operational transformation, institutional reform, and financial transparency. Together, these reforms seek to reverse underperformance by incentivizing well-governed, efficient, and accountable service delivery models. Specifically, the reform aims to reverse underperformance by rewarding well-governed, efficient, and accountable service delivery.
Urban water and sanitation services in South Africa face mounting pressures from aging infrastructure, climate change, population growth, and financial constraints. eThekwini Municipality, serving over 4.2 million residents, has experienced significant service delivery challenges, prompting the development of a comprehensive Turnaround Strategy (TAS) approved in April 2023. This strategy is now supported by a Business and Investment Plan (A2-BIP) and an Institutional Reform Roadmap (A1-IRR), forming the basis for accessing performance-based incentive funding through the Urban Settlements Development Grant (USDG).
This paper presents the strategic transformation of the eThekwini Water and Sanitation Unit through its TAS, A1-IRR, A2-BIP, and Performance Improvement Action Plan- (A3-PIAP). The paper outlines the drivers of change, strategic objectives, implementation mechanisms, and investment priorities aimed at stabilizing and positioning the utility for long-term sustainability.
The development of the TAS was driven by a combination of internal and external factors that created a pressing need for reform within the eThekwini Water and Sanitation Unit (EWS).
The primary drivers of change included:
• Service Delivery Failures: Persistent issues with water supply interruptions, sewer spillages, and poor customer service eroded public confidence and required urgent corrective action.
• Infrastructure Backlogs and Failures: Years of underinvestment resulted in aging and failing infrastructure, exacerbated by the April 2022 floods which caused widespread damage to both water and sanitation assets.
• Non-Revenue Water (NRW) and Financial Leakage: High levels of water loss, low metering coverage, and poor billing practices led to reduced revenue collection and financial instability.
• Regulatory and Governance Pressure: National Treasury’s Trading Services Reform Strategy and oversight from the Department of Water and Sanitation set new expectations for accountability, transparency, and performance.
• Climate Change and Population Growth: Increasing climate variability and urbanization have intensified stress on water resources, demanding more resilient and forward-looking planning.
• Public Trust and Accountability : Growing dissatisfaction from communities, civil society, and political stakeholders highlighted the need for improved communication, responsiveness, and citizen engagement. These factors collectively underscored the urgency for institutional reform and the strategic repositioning of EWS to function as a financially sustainable, performance-managed, and customer-focused utility.
1.2 National Basis for the Turnaround Strategy
National Treasury has acknowledged that trading services—comprising electricity, water and sanitation, and solid waste management—are in a state of progressive decline. This deterioration stems from long-standing underinvestment in infrastructure, resulting in increased operational inefficiencies, frequent service disruptions, declining cash revenues, and weakened financial sustainability across metropolitan municipalities.
As outlined in Guidance Note 2 (GN2), this decline undermines not only service delivery but also the broader economic and financial stability of metros, which depend on trading services for reliable revenue generation. GN2 introduced a more standardized approach to reform, embedding the Trading Services Reform Strategy (TSRS) into the planning, budgeting, and performance cycles of municipalities. It emphasized the importance of aligning trading services reforms with the Medium-Term Strategic Planning (MTSP) and the Medium-Term Revenue and Expenditure Framework (MTREF), ensuring that performance-based funding becomes an integral part of municipal governance.
Complementing this, Guidance Note 3 (GN3) reinforced the need for institutional and governance reforms—particularly around the establishment of a Single Point of Management Accountability (SPoMA), financial ring-fencing, and transparency in reporting. Together, these guidance notes set a national framework aimed at repositioning trading services as professionally managed, accountable, and financially viable components of municipal government.
To operationalize this agenda, eThekwini developed its TAS, in alignment with the TSRS. This is supported by the A1-IRR and the A2BIP, forming an integrated response to the requirements of the reform strategy.
Rather than serving as compliance documents, these submissions are practical, outcome-oriented instruments designed to:
• Reverse chronic underinvestment in infrastructure and services
• Consolidate accountability under a unified management structure
• Establish credible financial baselines and align budgets with performance outcomes
• Build resilient, customer-focused business units capable of delivering sustainable services
Guidance Note 1 outlines the sequencing and deadlines for these submissions, while GN2 and GN3 collectively provide the structural and institutional expectations underpinning them.
Crucially, Guidance Note 4 (GN4) translates these ambitions into measurable performance commitments through the A3-PIAP. The A3-PIAP serves as a binding accountability instrument, capturing the strategic intent of the TAS, A1-IRR, and A2-BIP within a multi-year implementation matrix. Organized around three performance pillars— Accountability, Financial, and Operational—the A3-PIAP includes specific KPIs tracked quarterly and annually to inform funding decisions.
eThekwini’s reform submissions meet the full criteria set out by National Treasury, positioning the municipality for continued support and laying the groundwork for long-term transformation.
The municipal Council, as the highest decision-making authority, plays a pivotal role in the approval and oversight of the TAS. It ensures strategic alignment with the Integrated Development Plan (IDP), national development priorities, and long-term municipal goals. Council authorizes funding allocations—whether from internal revenues, grants, or external loans—and leads public engagement processes to ensure the strategy reflects community priorities. Critically, Council
upholds institutional accountability by monitoring the performance of the administration, requiring regular reporting, and holding the City Manager and executive leadership accountable for implementation outcomes.
Supporting this oversight function, Council Committees provide technical input and detailed analysis ahead of formal decisions. The Finance Committee assesses the financial viability of the strategy, funding models, and associated risks. The Infrastructure or Technical Services Committee evaluates the technical feasibility, operational impacts, and implications for service delivery. The Governance or Audit Committee ensures the strategy aligns with procurement regulations, legislative mandates, and ethical governance principles. The Performance Management Committee tracks progress on key deliverables and monitors KPIs linked to the strategy. These Committees also vet and recommend grant applications, development finance proposals, and tariff adjustments necessary to ensure the financial sustainability and successful implementation of the TAS.
2.1
The TAS outlines 12 strategic objectives focused on financial recovery, water security, asset management, customer service, and governance. Key short-term goals include reducing NRW by 5% annually, improving cash collections to 95%, restoring infrastructure damaged by floods, and establishing a single point of accountability.
The 12 strategic objectives are:
• Emergency financial turnaround
• NRW reduction and cash collection
• Water security
• Bulk water supply
• Institutional capability
• Asset management and operations and maintenance
• Asset creation
• Revenue and finance
• Revenue from ITB land
• Water management devices
• Customer management
• Procurement
These strategies were developed through a series of facilitated workshops involving both internal stakeholders and external departments, led by the City Support Programme Team. The process identified interdependencies and systemic weaknesses.
For the short-term goals such as NRW and cash collection, clear action plans were developed with associated resource requirements. Mediumterm action plans address capital projects focused on storm damage recovery and compliance.
The A1-IRR was submitted to National Treasury on 30 September 2024 and follows the guidelines outlined in NT Guidance Note 4. It aims to establish a ring-fenced, accountable Water and Sanitation business unit.
The six strategic pillars of the roadmap include:
1. Institutionalization of Single Point of Accountability
2. Management Capacity Augmentation
3. Governance Model Improvement
4. Financial Ring-fencing
5. Budget Execution and Private Financing
6. Transparency and Financial Reporting
Key deliverables include:
• Functional Head of Department control over all operations
• Separate financial statements for water services
• Reallocation of grants and revenue to ensure financial sustainability
• Strengthening internal governance to support accountability and longterm performance
2.3
Submitted concurrently with A1-IRR, A2-BIP details how the TAS will be operationalized. Its guiding theme is:
“To Stabilize the Water and Sanitation Business and Leapfrog it into the Future”
The immediate objective covered by the Plan is to stabilize the organization, to recover fully in the medium term and prepare for growth into the future. This is EWS’s commitment to implement the reform agenda that water and sanitation, as a trading service, should be managed as a business that is able to generate surplus to re-finance the maintenance of existing assets and the creation of new assets to grow the City’s economy for the future.
In developing the Business and Investment Plan, Figure 1, EWS has taken account of the TAS, changes in the external environment and the Strengths, Weaknesses, Opportunities and Threats in our internal environment. Arising from this analysis, the A2-BIP summarizes strategic challenges, which are reflected in the TAS, that in the main EWS is in a cycle of decline, which requires major changes and improvements.
The plan calls for a shift from reactive crisis management to proactive, sustainable service delivery. It includes:
• R15 billion in capital expenditure over 5 years
• R4 billion investment in NRW reduction
• R25 billion worth of Public-Private Partnership (PPP) projects
• Major initiatives such as fleet renewal, ICT upgrades, and human capital development
• Performance-based contracting and monitoring mechanisms
(A3-PIAP)
The A3–PIAP is a key instrument for accountability and performance tracking in eThekwini’s reform journey. Issued in alignment with Guidance Note 4 from National Treasury, the A3-PIAP serves as a binding performance agreement between the metro and national government.
This comprehensive plan consolidates all measurable targets from the TAS, A1-IRR, and A2-BIP into a single, integrated framework. Structured around the A3-PIAP template issued by National Treasury, the A3–PIAP includes over 100 Key Performance Indicators (KPIs) which enables transparent monitoring and conditional grant funding alignment.
The three key performance pillars include:
• Accountability Performance: Indicators in this pillar assess governance structures, the establishment of a single point of management accountability (SPoMA), and improvements in procurement transparency and institutional autonomy.
• Financial Performance: Focus areas include improving the cash collection rate (target 95%), achieving a positive operational cash flow by Year 3, enhancing cost recovery, and aligning the budget with the Business and Investment Plan.
• Operational Performance: This includes metrics such as Non-Revenue Water (target <35%), infrastructure reliability (pipe bursts and sewer blockages per 100 km), Blue and Green Drop compliance scores (target >95%), customer response times, and execution of capital projects.
Each KPI in the A3-PIAP is time-bound, with clear targets for Year 1 through Year 3, and is monitored through quarterly and annual reporting. The template facilitates financial transparency and integrates with mid-year budget reviews, enabling adaptive management and funding re-alignment based on actual performance.
By using this structured framework, National Treasury can track the municipality’s progress and release grant funding based on verifiable improvements. For EWS, the A3-PIAP not only clarifies internal priorities but also enhances external accountability and builds public trust in the reform process. Table 1, on the following page, depicts the A3-PIAP template drawn from Addendum to GN 4.
This integration of planning, execution, and accountability positions the A3-PIAP as the cornerstone of sustainable trading services reform.
3.1 Performance-Based Management Contract (PBMC)
A five-year PBMC has been introduced to augment technical leadership, fasttrack reforms, and embed business principles within EWS. It includes clearly defined performance benchmarks.
3.2 Public-Private Partnerships (PPP)
Major projects include:
• R2.1 billion Regional Wastewater Treatment Works
• Desalination and water reuse projects
• Renewable energy and hydropower for treatment works
3.3 Capacity Building and Change Management
Training, leadership coaching, and improved recruitment mechanisms are being implemented to support the reform process. City-wide stakeholder engagement supports accountability.
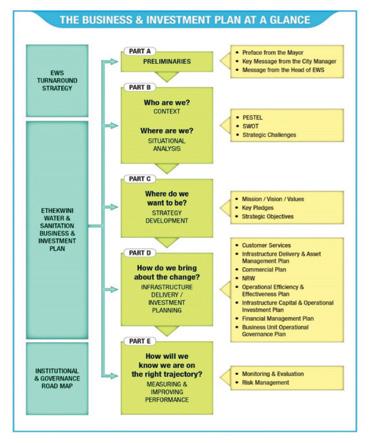
TABLE 1: Template from Addendum to Guidance Note 4 (GN4): Annexure: technical indicator description and minimum commitments definition sheets quick overview
M1
M2
M3
M4
The TAS and associated A2-BIP outline ambitious capital and operational programmes to address historical backlogs, infrastructure decay, and future growth demands. These investments are structured to not only meet immediate service delivery obligations but also catalyze economic development, job creation, and resilience to climate change.
4.1 Water Sector
In the water sector, key priorities include the replacement of 160,000 domestic and commercial meters to improve billing accuracy and revenue
collection. The replacement of 890km of aging water pipelines will reduce water losses, improve pressure management, and ensure more reliable supply. Completion of the Southern Aqueduct, a multi-billion rand regional conveyance infrastructure, will significantly boost bulk water security and address supply constraints in growing northern regions.
4.2 Sanitation Sector
For sanitation, investments focus on the upgrading and expansion of regional Wastewater Treatment Works (WWTWs) and pumpstations, construction of new treatment capacity, and rehabilitation of overloaded
sewer networks. In addition, the plan includes the provision of appropriate on-site sanitation solutions in informal settlements to ensure equitable access to basic services.
Operational improvements include the renewal of the municipal fleet (valued at R1.7 billion), upgrading of ICT systems for billing, asset management and operations, and decentralization of regional operations centers to reduce response times and enhance customer service delivery.
Implementing a reform programme of this scale and complexity carries inherent risks that must be proactively managed to ensure success.
• Financial Risks: These include budget shortfalls, delayed grant disbursements, and under-expenditure of capital budgets. Mitigation measures involve multi-year budgeting, ring-fencing of funds, financial oversight committees, and increased efforts to leverage PPP and donor financing.
• Institutional and Political Resistance: Organizational change may be met with internal resistance or political interference. To mitigate this, the municipality is fostering a culture of accountability, promoting leadership stability, and implementing a dedicated change management programme supported by the PBMC.
• Capacity Constraints: Technical, managerial, and operational capacity shortages may delay implementation. To address this, EWS is investing in staff training, professional development, and recruitment of scarce skills through new partnerships.
• Procurement Delays: Long procurement cycles and complex regulatory requirements can impede project rollout. EWS is addressing this by establishing dedicated bid committees, improving procurement planning, and strengthening contract management systems.
The EWS TAS represents a decisive shift towards performance-driven municipal reform. By aligning with National Treasury’s Trading Services Reform Strategy and fulfilling the requirements of GN1 through 4, eThekwini has initiated a comprehensive transformation rooted in governance reform, financial sustainability, and operational efficiency.
The phased implementation of the TAS, the A1-IRR, the A2-BIP, and the A3–PIAP establishes a clear roadmap for systemic change. Strategic capital investment, institutional restructuring, and performance-based accountability mechanisms are already demonstrating results—ranging from improved financial oversight to enhanced infrastructure delivery.
Crucially, the successful implementation of the reform will not only stabilize municipal trading services but also transform EWS into a truly customer-centric organization. Through strategic initiatives and technological innovation, the City will be better equipped to deliver reliable, transparent, and efficient services. This shift is expected to drive increased public trust, improved customer satisfaction, and stronger relationships between the municipality and the eThekwini community.
With continued political will, targeted capacity-building, and resultsbased funding, EWS is well-positioned to emerge as a leading model for urban water utility reform in South Africa. The approach adopted by eThekwini offers valuable insights and a replicable framework for other metros facing similar institutional and service delivery challenges.
7 RECOMMENDATIONS
To consolidate the gains of the Turnaround Strategy and ensure long-term success, the following strategic actions are recommended:
• Institutionalize SPoMA : Embed the Single Point of Management Accountability (SPoMA) model across all operational and financial systems to drive performance and accountability.
• Strengthen PIAP Integration: Use the A3–PIAP as a living document, integrated into annual budgeting, departmental performance agreements, and mid-year reviews.
• Sustain Stakeholder Engagement : Engage ward councilors, community forums, and internal teams to build broad-based support for ongoing reforms and improve transparency.
• Leverage Conditional Funding : Continue aligning grant funding proposals with PIAP performance indicators to secure infrastructure investment and technical support.
• Build Technical Capacity: Expand the municipality’s internal capacity through targeted recruitment, training, and partnerships with external experts, including the PBMC.
• Promote National Learning: Share experiences and lessons from the eThekwini reform journey with other metros to support a national movement toward trading service excellence.
8 LIST OF ACRONYMS
EWS – eThekwini Water and Sanitation
TAS – Turnaround Strategy
A1-IRR – Institutional Reform Roadmap
A2-BIP – Business and Investment Plan
A3–PIAP – Performance Improvement Action Plan
NRW – Non-Revenue Water
MTSP - Medium-Term Strategic Planning
MTREF - Medium-Term Revenue and Expenditure Framework
GN2 – Guidance Note 2
GN3 – Guidance Note 3
GN4 – Guidance Note 4
PBMC – Performance-Based Management Contract
PPP – Public-Private Partnership
SPoMA – Single Point of Management Accountability
USDG – Urban Settlements Development Grant
DWS – Department of Water and Sanitation
NT – National Treasury
KPI – Key Performance Indicator
WSDP – Water Services Development Plan
IDP- Integrated Development plan
ICT- Information and communication Technology
ITB – Ingonyama Trust Board
TSRS – Trading Services Reform Strategy
SWOT- Strength, weakness, Opportunities and Threats
9 REFERENCES
eThekwini Municipality. Final eThekwini Water and Sanitation Turnaround Strategy (TAS). Approved by Council, April 2023.
eThekwini Municipality. Institutional Reform Roadmap (A1) Submission
Submitted to National Treasury, 30 September 2024.
eThekwini Municipality. Business and Investment Plan (A2) Submission
Submitted to National Treasury, 30 September 2024.
National Treasury. Guidance Note 1: Metro Preparations for the Introduction of Trading Services Infrastructure Financing Reforms, 1 April 2024.
National Treasury. Guidance Note 2: Metro Preparations for Trading Services Infrastructure Financing Reforms, 7 August 2024.
National Treasury. Guidance Note 3: Institutional Arrangements for Reforming Metro Trading Services, 9 September 2024.
National Treasury. Guidance Note 4: Completing the Trading Services Reform Strategy (TSRS) A3 Performance Improvement Action Plan (PIAP), 2024. National Treasury. Addendum to Guidance Note 4: Detailed Instructions for Completing the A3–PIAP Template, 2025. Department of Water and Sanitation. Blue Drop and Green Drop Reports, 2022.
eThekwini Municipality. EXCO Report WS2025_023 – Compliance with National Treasury TSRS Requirements, March 2024. City Support Programme (CSP). Technical Support Reports and Workshop Outputs for EWS Reform, 2023
Melanie Geyer George Municipality
ABSTRACT
South Africa produced 55 million tonnes of general waste in 2017, as noted in the 2018 South Africa State of Waste Report (Report No. 1), with only 6.05 million tonnes diverted from landfill sites. Diverting organic waste from landfills is a critical focus of the National Waste Management Strategy 2020 as published by the Department of Environment, Forestry and Fisheries, which emphasizes treating organic biodegradable materials such as sewage sludge.
The 2020 National Waste Management Strategy outlines five key principles aimed at increasing landfill waste diversion rates to 40% by 2025, 55% by 2030, and 70% by 2035. Similarly, the Western Cape Integrated Waste Management Plan (4th Generation) published by the Western Cape Government in 2017 highlights the need to improve sewage sludge management within the province, targeting a diversion rate of 50% by 2022 and full diversion by 2027. A feasibility study commissioned by DEDAT for the Sludge Beneficiation for the Western Cape revealed that the Western Cape generated 295,000 tonnes of sewage sludge in 2016, with only 33% being beneficially utilized — 22% for land farming and 11% for composting or agricultural purposes. The Garden Route District contributed approximately 10% (28,400 tonnes), making it the third-largest contributor.
The George Municipality recognizes the environmental and socioeconomic value of treating sewage sludge for beneficial use. In 2023, the municipality produced 41 tonnes of dewatered sludge/day (15% dry
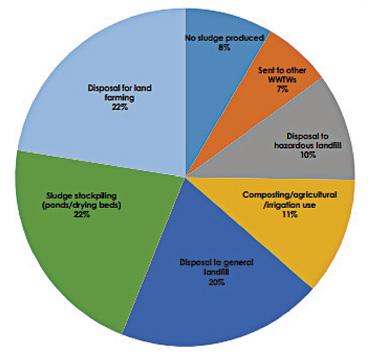
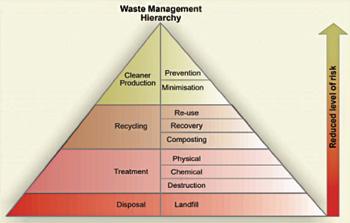
solids), with projections indicating an increase of approximately 14 tonnes/ day by 2033 at an annual growth rate of 3–3.3%. However, current practices by the municipality involve stockpiling at wastewater treatment works, with no beneficial and environmentally acceptable take-off agreements. As a turnaround strategy for its current sludge handling practices, the municipality initiated an Expression of Interest for the beneficial utilisation of sewage sludge, incorporating sustainable engineering practices aligned with national and provincial strategies and processes to explore options for beneficial sludge treatment.
To address this challenge, the Expression of Interest explored sustainable sludge utilization options available in the market that are aligned with national and provincial strategies. This process advanced to a tender stage inviting financial proposals. Following evaluations, the municipality opted for a long-term agreement under the Municipal Asset Transfer Regulations: Municipal Finance Management Act, 2003 (Act No. 56 of 2003). By December 2025, it aims to finalize a partnership to establish a facility using solar drying technology to treat sewage sludge. This technology will achieve a dry solids content of 65–95%, reduce pathogens and faecal coliforms, and assist in the production of A1a-classified sludge. This initiative enables the municipality to comply with legislation while securing economically viable and sustainable agreements for treated sewage sludge, ensuring responsible management from production to final use.
The Western Cape, like other provinces, is struggling with the availability of landfill capacity to accommodate the disposal of waste, with the sighting of new landfills being a challenge (Western Cape Government 2017). The 2022 Waste Market Intelligence Report by GreenCape estimates that the municipal landfill lifespan for each local municipality in the province is less than 5 years, apart from Swartland (more than 15 years), City of Cape Town and Overstrand (both more than 5 years but less than 10 years).
However, more than 50% of sewage sludge in the Western Cape Province is not being utilised as a resource, as the sludge is either disposed of at landfill
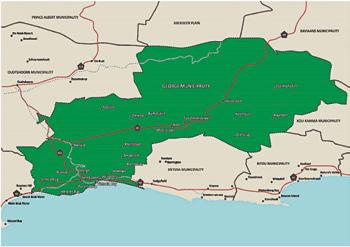
(general and hazardous) sites (30%) or stockpiled on site (22%). Refer to Figure 1.
From the above statistics, it is evident that disposal is still seen by the majority of local authorities as the default option to dispose of sludge. This practice is contrary to both the waste management hierarchy, see figure 2, which prioritizes waste diversion measures such as waste prevention, re-use, recovery, and recycling over disposal as well as the provincial and national waste diversion targets set to reduce in the next 5 – 10 years.
Currently, there is general consensus that sludge is a potential source of valuable resources and energy ( WRC report; no. TT 756/18). Treated sewage sludge can be beneficially utilised in the agricultural sector through land application, recovering energy, producing compost or fertiliser, use in construction industry such as brick making and others.
To ensure alignment with provincial and national strategies, sustainable and compliant practices are implemented, more beneficiation projects must be considered and implemented by local government/municipalities to make use of this valuable resource, however the environmental legislative environment is complex and regulation by more than once government department must be considered for on-site and off-site disposal.
The George Municipality is the third largest municipality, in terms of population, in the Western Cape Province of South Africa and is situated in the Garden Route District of the province. Refer to Figure 3.
The municipality serves 294 929 people from 85 931 households (Statistics SA 2023) across 28 wards including Uniondale and Wilderness
– with service hinterlands geographically separated from the main city area George. Small rural or tourism settlements include Haarlem, Waboomskraal, Uniondale, Touwsranten, Hoekwil – and various hamlets and rural places like Avontuur, De Vlugt, Herold and Noll. Coastal areas include Herold’s Bay, Victoria Bay, Wilderness, Kleinkrantz, and Gwaing. 84% of the municipal area’s population is located within George. Wilderness, Uniondale and Haarlem respectively host the bulk of the remaining urban population, and 9% of the municipal area’s population is rural.
The municipality administers a vast and diverse geographic area of 5191km2 that extends from the dry and climatically extreme Little Karoo in the north, to the wetter more temperate Garden Route in the south. The area administered by the municipality forms part of the larger Garden Route District Municipality’s jurisdictional area.
The Municipal area is served by six (6) wastewater treatment works (excluding privately owned WWTW’s) with capacities and locations indicated in Table 1.
The outcome of the Western Cape Government Status Quo report 2020/21 echoed the results of the 2016 DEDAT study, and from the 107 Wastewater Treatment Works (WWTW’s) reviewed/surveyed, only 33% (22% land farming/application and 11% composting/agricultural/irrigation use) of the WWTW’s beneficially utilise sewage sludge.
An extract of data performed as part of the development of the status quo report from the Western Cape Provincial Integrated pollutant and waste information system for the 2019 calendar year revealed that only two (2) municipalities report on the disposal of their sewage sludge at three waste management facilities. The report stated, “there is a severe lack of reporting for this waste type and is an area that needs improvement in order to gain an idea of what the potential for beneficiation is in terms of quantity.”
Figure 4 shows the distribution of organic waste in the Western Cape in 2015. According to the DEDAT 2016 study 45% of the total waste generated in the Western Cape is organic, with sewage sludge contributing 4%.
The Status Quo report confirmed that the Municipalities are facing various infrastructural and operational challenges which could have a direct or indirect impact on how the Municipalities manage sewage sludge. However, there were some encouraging examples where 11% of the WWTW’s surveyed were already diverting sewage sludge for beneficial use.
In conclusion, the report stated the need to stimulate business interest in sewage sludge and encouraged municipalities to get their sludge classified and tested to guide the way forward in managing the sludge beneficially.
1 Gwaing 11 Eastern Parts of George
2 Outeniqua 25 Western Parts of George
3 Kleinkrantz 2.5 Wilderness, Kleinkrantz, Touwsranten and Hoekwil
4 Uniondale 1 Uniondale
5 Haarlem 0.1 Haarlem
6 Herold’s Bay 0.3 Herold’s Bay
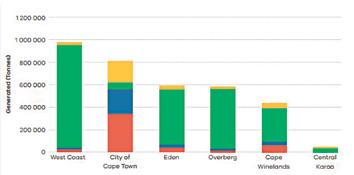

TABLE 2: George municipal wastewater treatment works
No Wastewater Treatment Works (WWTW) Sludge drying method Disposal Route
2 Outeniqua
1 Gwaing Mechanical dewatering Stockpiling
3 Kleinkrantz Drying beds. Upgrade to mechanical dewatering in planning for implementation
4 Herold’s Bay Mechanical dewatering at Gwaing WWTW (tanks are emptied and transported to Gwaing WWTW)
5 Uniondale Drying beds Land application
6 Haarlem Drying beds (tanks are emptied and sludge transported to Uniondale for drying)
The current sludge drying method(s) and disposal route of the six (6) WWTWs that service the entire Municipal area are indicated in Table 2.
Figure 5 below indicates the sludge volume projections for the George Municipal WWTW’s (Gwaing, Outeniqua, Kleinkrantz and Uniondale). The projected sludge production by these WWTW’s post mechanical dewatering amounts to ±40 000kg/day in 2023 and is projected to increase up to ±138 000kg/day in 2063 at a medium growth rate of 3 to 3.3%.
Currently, the sludge produced is classified as class B1a according to a report by Herselman Consulting Services compiled in October 2021. The ‘B’ designation refers to microbiological class with the presence of faecal coliforms above 1000CFU/gdry and Helminth ova above 0.25 viable ova/gdry preventing the sludge from achieving an ‘A’ designation for microbiological class. This places restrictions on how the sludge can be utilised. The designation ‘1’ refers to the stability class while the ‘a’ refers to the pollutant class (metals).
The current methods of sewage sludge disposal are neither satisfactory nor sustainable to the municipality, and do not align with the provincial and national strategies. In addition, the sludge produced has potential commercial value for use in saleable products, and the municipality is interested in exploring the available options. This value provides opportunities for alternative means of disposal.
To make the sludge a more attractive commodity for beneficial use the sludge needs to be processed further.
The waste management planning of the George Municipality aligns with the national and provincial targets to divert sewage sludge from landfills. The George Municipality has developed a suite of documents to effectively deal with waste. These include an integrated waste management plan (3rd generation 2020-2025, March 2020), waste minimisation plan (draft June 2021), and a home composting guideline.
The waste minimisation plan specifically addresses sewage sludge by prioritising its diversion from landfills through composting, anaerobic digestion and where appropriate, land application. These strategies are designed to comply with national regulations, reduce environmental impact, and promote resource recovery from waste streams.
The municipality investigated several options for sludge beneficiation as well as a diversified approach to be less dependent on a single solution, two of these solutions are discussed below.
Composting is a suitable method for treating sewage sludge. Composting not only reduces the volume of sludge but also eliminates most of the pathogens. Sewage sludge is considered a good material for composting practices, and it can be combined with other material sources such as garden refuse, wood chips etc. to create a compost for land application, selling compost to consumers etc. Composting could be employed to sterilize the sludge to class A1a. If this is achieved, the sludge can be sold as compost for agriculture or horticulture use, reducing the need for sludge storage or landfill application.
Delta Built Environment Consultants (Pty) Ltd (Delta BEC) was appointed by the George Municipality in 2015/16 to provide professional services for their solid waste management. Delta BEC’s appointment included compiling a feasibility report and applying for a waste management licence for a new composting facility and builders’ rubble processing plant in George. In 2019 Delta BEC conducted a study to investigate whether the proposed composting facility should be developed by the municipality, in partnership with a private company or solely by a private company. In 2021, a detail design report of the proposed facility was issued, and the facility was constructed. The feasibility study and detail design excluded the use of sewage sludge as part of the composting process, as the use of compost containing sewage sludge by end users was not well received. This is due to their target market being domestic end users and the possible health risks that are perceived with sewage sludge.
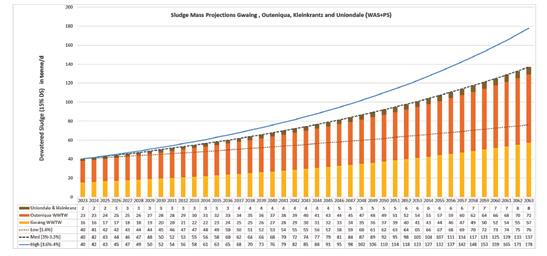
During 2023 to 2024, Delta BEC was once again engaged to investigate the feasibility of composting as a sludge beneficiation strategy for George Municipality at the newly implemented Municipal Composting Facility. Their Report titled: Sludge Utilisation Within George Municipality Compost Facilities Recommendations stated:
“Municipal sewage sludge is generated in large quantities and contains high organic loads. To reduce its environmental risk, composting is a common treatment technique. Key parameters include moisture content
and C/N ratio. Sludge variability makes it challenging to establish treatment protocols, but minimum requirements are necessary for proper composting.”
A review of the Gwaing Compost Facility found that combining two platform would provide sufficient capacity for about 84% of the sewage sludge from the Gwaing and Outeniqua WWTWs. Although a significant portion of the daily sludge mass can be treated, further aspects must be considered to consider this treatment process a viable option:
• Construction of additional platforms to ensure adequate space is available for the addition of the sewage sludge as a material source (current and future).
• Co-operation and co-ordination between internal directorates in terms of construction and operation of the facility, provision of funding, resources etc.
• Continuous testing of the compost to ensure compliance and no harm to the public and the environment.
• Obtain public/community buy-in to ensure a saleable product, by perhaps creating a pilot/trial site to demonstrate to the community that the compost will remain a suitable product and there will be no harm to the public and the environment.
• Continuous compliance with Sludge Management Guidelines, NEMA, NWA and Waste Management Act.
In conclusion, presently the decision is not to pursue composting as a direct and sole option for the beneficiation of the sewage sludge. To bridge the gap and obtain public/community buy in will take time, requiring the municipality to investigate other alternatives that will prove equally suitable, beneficial and compliant. The municipality will however continue with the investigations and processes required to utilise the composting facility as far as possible and would ideally wish to implement this in the near future which will also allow two (2) avenues for beneficially disposing of sewage sludge.
Call for Proposals to Open Market: Solar drying and Fertilizer Production
Call for proposals process:
The municipality prepared a two-stage call for proposals tender requesting proposal from the open market to assess practical and beneficial disposal options available for the handling, management and disposal of sewage sludge & residuals from all municipal Wastewater Treatment Works (WWTW) and Water Treatment Works (WTW).
The municipality encouraged Tenderers to submit proposals that are comprehensive, competitive, robust, innovative, practical, functional, sustainable, each with attractive yet functional design solutions.
The overall objective of the municipality was to upon the conclusion of the tender process to:
• To appoint a service provider or multiple service providers that can sustainably, practically, and efficiently treat (if further treatment is required), manage and dispose of sludge from the six (6) municipal wastewater treatment works and residuals of five (5) water treatment works.
• The George Municipality’s preferred outcome will be to enter a longterm contract with a financially stable, technically experienced, and well-resourced organization in sludge handling and management.
• To beneficially and sustainably dispose of residuals and sludge through a contracted third party
• To enter into an agreement that will minimize the municipality’s administrative requirements, free the municipality of legal obligations and other risks associated with residual and sludge disposal while providing environmental acceptable solutions that are sustainable.
Stage 1 of 2 considered sustainable solutions proposed by service providers that required compliance with the tender conditions, and only responsive stage 1 tenders were then invited to submit their financial proposal as part of stage 2.
The stage 1 tender was advertised during February to March 2024, and twenty (20) service providers registered their interest, however only two (2) proposals were received, and only one (1) Tenderer was considered responsive and was invited to submit a financial proposal. The stage 2 process commenced in October 2024 and will be concluded by November 2025.
Upon conclusion of the procurement process, the municipality will enter into a long-term agreement (10 years) with an external party to operate and use the George BBF to produce fertiliser.
The South African environmental legislative environment is complex and regulation by more than one Government Department needs to be considered for on-site and off-site disposal of sewage sludge. The Department of Water and Sanitation (DWS), Department of Environmental, Forestry and Fisheries (DFFE) are the lead regulatory authorities for sewage sludge disposal.
The authorisations required for on-site and off-site disposal are defined in terms of the:
• National Water Act (Act 36 of 1998),
• Environmental Conservation Act (Act 73 of 1989),
• National Environmental Management: Waste Act (Act 59 of 2008)
• Waste Classification and Management Regulations GN 634 (August 2013)
• Water Services Act (Act 108 of 1997)
• National Health Act (Act 61 of 2003)
The processing and disposal of municipal sewage sludge has increased in importance since the establishment of stricter standards by the then Department of Water Affairs and Forestry (DWAF) and the publication of the updated Guidelines for the utilisation and disposal of wastewater sludge by DWAF and the Water Research Commission (WRC) in June 2009 (WRC Report no TT349/09).
In issuing the licenses of wastewater treatment plants and regulating wastewater sludge the Department of Water and Sanitation (DWS) stipulates that the Sludge Management Guidelines should be adhered to, and through this process the Guidelines become legally binding.
The South African guidelines comprise of a set of five volumes as indicated in Table 3.
The MFMA Section 33: Contracts having future budgetary implication, applies when a municipality intends to enter into a contract or agreement that will have financial implications beyond the current three financial years.
TABLE 3: Sludge Management Guidelines
the Thermal Sludge Management Practices
Products Containing Sludge
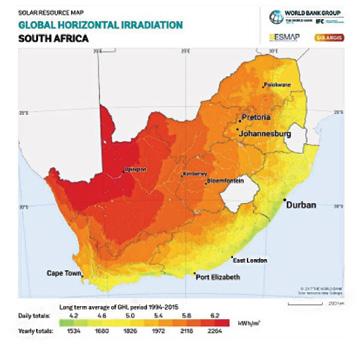
The call for proposal tender document was advertised for a period of 3 years with the provision that proposals requiring longer periods shall be subject to compliance with the MFMA. Stage 1 proposals received required a longer-term contract to ensure a viable project. The municipality assessed the options prior to preparing the stage 2 tender document, and the tender documents were therefore prepared accordingly.
Through this process the municipality will ensure transparency, proper financial planning and conduct public participation by informing the public, interested and affected parties, provincial and national organs of state about the proposed contract and provide them an opportunity to comment over a 60-day period.
Municipal Asset Transfer Regulations (MATR): Granting long term right
The MATR govern how municipalities transfer or dispose of capital assets, including transfers to private parties, other municipalities, municipal entities, and national or provincial government organs. This includes permanent transfers (sales or other transactions) and temporary rights such as leasing.
The intention of the municipality as part of the call for proposal process is to construct a solar drying and blending facility that will be operated and maintained by an external entity / service provider over a long-term period.
Granting a long-term right for the control, use or management of a high value capital asset (> R10 million) to an external entity for a longterm period (> 10 years), compliance in terms of the MFMA: Municipal Asset Transfer Regulations is required (National Treasury, 2008), specifically regulation 34 to 36.
The regulations would ensure that municipalities act as responsible custodians of public assets by prescribing procedures that protect the public interest and municipal financial health. Through this process the municipality will ensure transparency, asset management and conduct public participation by informing the public, interested and affected
parties, provincial and national organs of state about the proposed contract and provide them an opportunity to comment over a 60-day period.
Once the two processes in terms of the MFMA (RSA, 2003), regulations 34 to 36 are successfully completed, and the council resolution(s) are passed, the contract can be signed.
The current intention and preferred option for George Municipality is to construct a solar drying and granulation plant; this plant will be referred to as the George Biosolids Beneficiation Facility (BBF). George Municipality plans to construct the capital infrastructure and only outsource operation of the facility, including the selling of the granulated sludge as fertilizer.
The accepted solution in beneficially managing the sewage sludge of the municipality is to produce fertilizer. The solar dried sludge (>80% DS) granules are optionally mixed/blended with chemical fertilizers and sold to farmers for application to agricultural land. This option creates a high-value product that warrants the additional capital and operational expenditure required for a solar drying plant.
George experiences a horizontal solar irradiation of 1500-1850 kWh/m2 per annum. This is low compared to other parts of South Africa, but relatively high when compared to central and northern Europe for example. George experiences a subtropical oceanic climate, characterized by mild winters and warm summers with monthly mean temperatures ranging from 12ᵒC to 22ᵒC. See figure 6.
The annual precipitation is about 715mm, spread quite evenly over the year so that monthly averages range from 45 to 70mm per month. See figure 7.
Solar drying of sewage sludge is typically done after initial dewatering to 14% - 17% dry solids (DS). Solar drying can be done to achieve between 65% and 90% DS. Above 65% DS the sludge forms granules or powder and is not lumpy or sticky any longer. The drying process reduces pathogens and faecal coliforms. A microbiological class of A could potentially be achieved to reach an overall sludge classification of A1a. However, it should be noted that temperature has been found to be the main parameter in the removal of helminth eggs and therefore the achievement of A1a may be dependent on the temperatures reached during the solar drying process. Stockpiling and curing of the sludge after drying has also been effective for pathogen reduction.
Another benefit of solar drying is the reduction of moisture content, leading to the reduction of mass and volume of the sludge. This reduces transport costs and simplifies sludge handling.
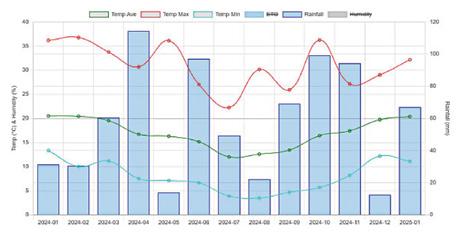
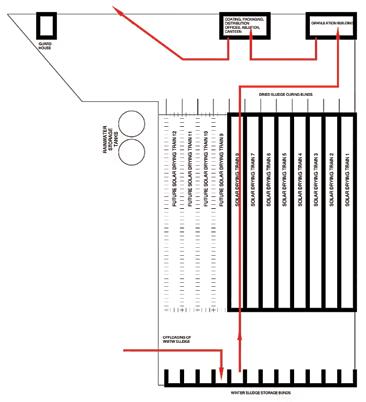
Solar drying can be done with or without roof coverings, this is however determined by the annual precipitation, evaporation rates and the solar irradiance.
Solar drying facilities can be simple consisting of concrete slabs with sufficient allowance for drainage and mechanical plant used to spread and turn the sludge periodically. In colder climate conditions, this same facility is generally equipped with translucent roof sheeting, forced ventilation and automated sludge spreading and turning equipment.
For the George BBF translucent roof sheeting may be required for the solar drying plant to limit the footprint required to within reasonable limits, ensure all year-round sludge treatment (high precipitation and low solar irradiation). Different options for sludge spreading and turning can be considered (continuous versus batch drying). This approach results in a drastic reduction of processing time or footprint and produces a betterquality sludge.
Batch solar sludge drying processes dries sludge in discrete batches, where each batch is dried separately before the next one begins. This method can be less efficient due to the downtime between batches and potential inconsistencies in drying conditions. However, batch drying allows for greater control over individual batches, which can be beneficial for handling varying sludge characteristics. For the George BBF this would typically entail that a greenhouse train is loaded to capacity with sludge with front-end loaders, and then the sludge is left to dry in that train for about 28 days while continuously being rotated by an electric mole.
The schematic layout and basic process flow diagram of the proposed George BBF is reflected in figure 8.
The facility is planned to be sized initially to receive approximately 50 tonne/d at 15% DS (see figure 5) which will result in a dried mass of about 8.3 tonne/d at 90% DS. The capacity of the BBF should be sufficient until at least
2030 based on a medium growth rate (3 – 3.3%). Additional drying trains can be added in future in line with the actual realized population rates.
The BBF will typically include perimeter fencing & access gates, ±30 000m2 of concrete slabs for the various stages of sludge stockpiling, solar drying, composing and sludge handling, ±13 000m2 (plan view) of translucent roof sheeting structures, 18m x 36m sludge granulation plant, 18 x 36m packaging & distribution depot which includes offices, ablution and a canteen for the operating staff of approximately 6 people, movable precast concrete walls placed on slabs to demarcate separated process areas and to prevent contamination, access roads, rainwater collection and storage from all roof structures, stormwater collection and drainage from concrete slabs with drainage back to the Gwaing WWTW inlet works.
The processing and disposal of municipal water residuals and wastewater sludge has increased in importance since the establishment of stricter standards by the then Department of Water Affairs and Forestry (DWAF) and the publication of the updated Guidelines for the utilisation and disposal of wastewater sludge by DWAF and the Water Research Commission (WRC) in June 2009 (WRC Report no TT349/09).
The current methods used by the George Municipality to dispose of sewage sludge are not satisfactory or beneficial and are not in terms of the Sludge Management Guidelines.
The sludge produced have potential commercial value for use in saleable products, and the municipality through a thorough planning process, rigorous and transparent legislative process will secure a long-term agreement with an external entity for the management and beneficial end use of sewage sludge.
Sustainable sludge management facilities are scarce in South Africa. If the municipality successfully implements this facility within the next few years, it will be a pioneering project for the Western Cape.
Department of Environmental Affairs. (2018). South Africa State of Waste Report (Report No. 1). Pretoria: Department of Environmental Affairs. Retrieved from https://www.dffe.gov.za/sites/default/files/docs/ stateofwastereport2018.pdf
Department of Forestry, Fisheries and the Environment. (2020). National Waste Management Strategy 2020. Pretoria: DFFE. Retrieved from https://www.dffe.gov.za/sites/default/files/ docs/2020nationalwastemanagementstrategy1.pdf
Department of Water Affairs and Forestry and Water Research Commission (2009) Guidelines for the utilisation and disposal of wastewater sludge. WRC Report No. TT349/09. Pretoria: Water Research Commission. Western Cape Department of Environmental Affairs and Development Planning. (2021).
GreenCape. (2022). WASTE: Market Intelligence Report 2022. Cape Town: GreenCape. Retrieved from https://www.greencape.co.za/assets/WASTE_ MIR_7_4_22_FINAL-3-2022.pdf
National Treasury. (2008). Municipal Asset Transfer Regulations: Municipal Finance Management Act, 2003 (Act No. 56 of 2003) Government Gazette No. 31346, 22 August 2008. Pretoria: Government Printer. Retrieved from https://www.gov.za/sites/default/files/gcis_ document/201409/31346rg8957gon878.pdf
Republic of South Africa. (2003). Municipal Finance Management Act, No. 56 of 2003. Pretoria: Government Printer. Retrieved from https://www.gov.za/ documents/municipal-finance-management-act
Tesfamariam, E.H., Badza, T., Demana, T., Rapaledi, J., and Annandale, J.G. 2018. Characterising Municipal Wastewater Sludge for Sustainable Beneficial Agriculture Use. (WRC report; no. TT 756/18). Gezina, South Africa: Water Research Commission.
Western Cape Department of Economic Development and Tourism. (2016). Sludge Beneficiation Feasibility Study for the Western Cape. Cape Town: DEDAT.
Western Cape Status Quo Report: 2020/21. Cape Town: DEA&DP. Retrieved from https://www.westerncape.gov.za/eadp/files/atoms/files/WC%20 Status%20Quo%20Report%202020-21.pdf
Western Cape Government. (2017). Western Cape Integrated Waste Management Plan (4th Generation). Cape Town: Department of Environmental Affairs and Development Planning. Retrieved from https:// www.westerncape.gov.za/eadp/files/atoms/files/Western%20Cape%20 Integrated%20Waste%20Management%20Plan%202017.pdf
Phillip Majeke1, Ednah Mamakoa2
Water Research Commission 1 & 2
4 Daventry Street, Lynnwood Manor, Pretoria, 0081
ABSTRACT
South Africa’s municipalities face ongoing challenges such as water scarcity, inadequate infrastructure and rapid urbanization, necessitating resilient and sustainable sanitation solutions. The Water Research Commission’s South African Sanitation Technology Enterprise Programme (SASTEP) serves as a model for integrating sustainable engineering principles into the planning, development and implementation of innovative sanitation systems, with great potential to transforming municipal service delivery.
SASTEP’s approach aligns with key sustainable engineering principles such as: resource efficiency, adaptability, environmental protection and social equity. The programme has piloted innovative sanitation technologies including low-flush systems, film-based container-based sanitation, NonSewered Sanitation (NSS) or Water Efficient Sanitation Systems (WESS), nature-based wastewater treatment systems and sludge beneficiation technologies which demonstrate these principles. These solutions optimize water use, incorporate circular economy principles, reducing reliance on centralized systems and mitigate environmental impacts. For example, low-flush systems significantly decrease water demand, while NSS/WESS supports resource recovery and reuse as well as nutrient recycling.
One of the keys of SASTEP’s success lies in designing solutions to address local conditions, such as flood resilience in informal settlements and drought mitigation in water scarce regions. This adaptability ensures that municipal sanitation systems are robust against climate impacts, aligning with principles of resilience and environmental stewardship. Circular economy models promoted by SASTEP integrate waste to resource approaches, turning sludge into fertilizer and other value add products from waste. These innovations align with broader sustainability goals, reducing dependency on finite resources and creating economic value. SASTEP also fosters inclusivity, engaging communities and building local capacity to ensure equitable access to sanitation services. Through SASTEP, eThekwini Municipality and City of Cape Town are piloting some of these innovations to provide climate resilient sanitation services.
South African municipalities are tasked to address critical challenges related to sanitation service delivery. Rapid urbanisation, water scarcity, infrastructure backlogs, growing informal settlements and climate change continues to create unsustainable pressure on existing sanitation systems (Adeyeye et al.2020). While progress has been made in provision of services, traditional service delivery models often fall short, particularly in reaching and effectively serving marginalized and indigent communities in the informal settlements. These communities frequently present unique challenges that conventional approaches struggle to address. The changing climate exacerbates existing vulnerabilities in these communities, such as
increased frequency and intensity of extreme events (droughts, floods, cold spells, heatwaves, hailstorms), rainfall variability, seasonal and temperature variations and rising sea levels and changes in rainfall patterns (Zhou et al. 2022). The topography and density of settlements in these communities also makes it difficult to deploy traditional service delivery approaches, which are further challenged by the impacts of climate change.
In response to this crisis, the South African Sanitation Technology Enterprise Programme (SASTEP), an initiative led by the Water Research Commission (WRC) was established to accelerate the adoption and scaleup of non-sewered, next-generation sanitation solutions. These innovations incorporates sustainable engineering principles, offering practical, decentralised and resource-efficient alternatives to conventional sanitation (UNEP, 2022). This paper explores how SASTEP provides a replicable model for municipal application, highlighting sustainable engineering design, community integration and policy alignment.
The sustainable engineering principles, exemplified by SASTEP, namely resource efficiency, adaptability, environmental protection and social equity, are aligned with globally recognised frameworks, such as that of the United Nations Environment Programme (UNEP, 2022). These principles guide the responsible design, implementation and scaling of engineering systems to ensure long-term resilience, inclusivity and environmental stewardship.
Sanitation systems supported by SASTEP are designed to minimise water consumption and maximise the efficient use of resources. Key innovations include low-flush toilet pedestals that use as little as 2 to 3 litres per flush, significantly reducing water demand compared to conventional toilet pedestals. In addition, SASTEP is piloting water-efficient backend systems capable of recycling water onsite while recovering valuable resources such as nutrients and energy from wastewater (See Figure 1). Many of these WESS
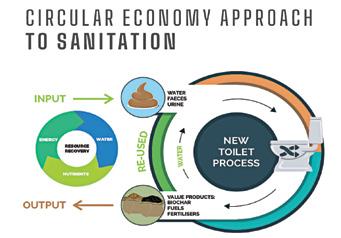
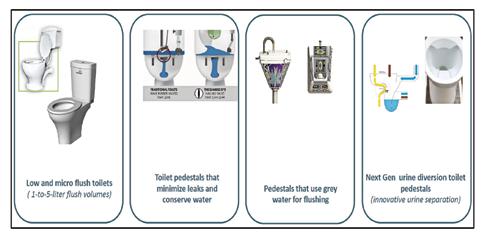
are powered by renewable energy sources, further enhancing their overall efficiency and reducing dependency on the grid infrastructure (WRC, 2023).
SASTEP technologies are designed with contextual adaptability in mind, meaning they can adjust to both current and future climate change impacts. These climate-adaptive sanitation solutions include off-grid systems that maintain functionality during power or water supply disruptions (e.g. load shedding or water cuts) and waterless or low water use technologies suitable for drought prone areas. Non-sewered, decentralised and modular systems are less vulnerable to infrastructure failures often caused by extreme events such as flooding. Additionally, some technologies feature design flexibility, such as elevated front-end or back-end units that remain operational during climate related events. Most of the technologies piloted through SASTEP incorporate one or more of these adaptive features (WRC, 2023). Their modularity further enhances their suitability, allowing for easy scaling, retrofitting, or relocation based on community needs and space limitations.
SASTEP innovations contribute to environmental sustainability by promoting onsite treatment, waste separation, nutrient and energy recovery as per figure 1. Faecal sludge management (FSM) is improved through decentralised treatment systems that facilitate the safe reuse of treated outputs. These systems reduce environmental load while producing reusable water, biogas and soil conditioner (TIPS, 2018), thereby supporting both environmental and economic sustainability.
SASTEP emphasises inclusion by prioritising sanitation for the most vulnerable communities. Innovations are co-designed with communities to reflect local preferences, cultural norms and gender needs. Women and youth are specifically targeted for training in maintenance, hygiene promotion and system operation, ensuring long-term sustainability and local job creation (Sindal et al. 2021). The programme promotes equitable access to sanitation and dignity for users in schools, informal settlements and rural areas.
SASTEP has piloted a range of low flush toilet pedestals designed to reduce water usage while maintaining hygiene and user experience. These technologies use 2 to 3 litres of water per flush and some of them encourage greywater reuse (see Figure 2).
These frontend innovations are critical for reducing water demand in both retrofitted and greenfield projects, particularly in water scarce municipalities.
WESS and NSS technologies within SASTEP mostly originated from the Re-invent The Toilet (RTTs) initiative by the Gates Foundation (Gates Foundation, 2011). These systems reduce water consumption by treating and reusing wastewater onsite, transforming sanitation from a water intensive service into a resource efficient and circular economy solution. These technologies not only address water scarcity but also recover nutrients, produce energy and create new value streams from human waste. The modular, water efficient scalable designs allow for deployment in water scarce and underserved areas as shown in Figure 3. By shifting from a disposal based approach to a resource recovery model, these innovations present a sustainable, cost-effective solution that aligns with circular economy principles, making sanitation more resilient and adaptable to climate challenges (WRC, 2023).
Under SASTEP, sludge beneficiation technologies play a vital role in transitioning sanitation from a linear waste disposal model to a circular economy approach (see Figure 1). These innovations focus on recovering valuable resources from human waste particularly nutrients and carbonrich materials through processes that are safe, decentralized and scalable. One such solution is the diamond reactor (see Figure 4), a batch treatment system that extracts phosphorus and nitrogen from urine to produce struvite (a slow-release organic fertilizer suitable for local agricultural use). Additionally, sludge can also converted into high value end products such as biochar, hydrochar and activated carbon through thermal processes (HTC-PCS) and the LaDePa converts sludge into a soil conditioner (WRC, 2023). These products not only reduce the environmental footprint
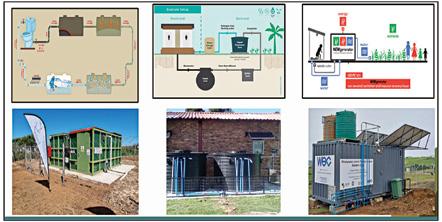

of sanitation but also open pathways for income generation and local enterprise development in waste valorisation.
The Water Research Commission, in partnership with the municipalities of eThekwini and the City of Cape Town, embarked on a demonstration of WESS/NSS in informal settlements and underserved areas outside the coverage of sewer networks. Both municipalities were selected by WRC and funders as they are hubs of economic activity with extensive informal settlements experiencing challenges such as frequent floods, drought conditions and storm surges making these areas prone to sanitation challenges and heightened disease risk. The strategic objective is not to only provide sanitation services but also enhance community resilience to natural disasters, strengthen emergency sanitation readiness and evaluate the performance and user acceptance of these innovative sanitation systems. Municipal engineers identified the demonstration sites and the project team then conducted comprehensive needs analysis of selected sites. Municipal engineers also served on the Project Steering Committee (PSC), contributing to decisions at various stages of the project lifecycle.
The demonstration involved the installation and commissioning of blackwater and greywater systems, with a minimum 12 months operational period post-commissioning. Before installation, SASTEP and its implementing partners conducted desktop evaluations of various WESS/ NSS technologies within SASTEP portfolio against the identified sanitation needs of each site. This process ensured that appropriate technology is matched based on environmental conditions, space availability, community preferences and technical feasibility. A comprehensive site information package was developed for each location to guide technology deployment and installation processes.
Throughout the demonstration period, operations and maintenance (O&M) responsibilities are managed by the technology partners. A local operator from the relevant municipality was contracted to conduct daily, weekly
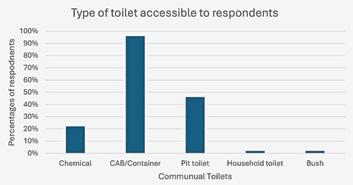
and monthly operational checks, ensuring system functionality and timely reporting of incidents. Structured classroom and on-site training sessions were conducted for municipal staff, covering preventative maintenance, routine servicing and emergency response protocols.
Comprehensive monitoring activities included technical performance, water and energy usage, influent and effluent quality and climate resilience parameters. An independent evaluation to assess the system performance, climate resilience, community response and environmental impact is underway. Municipal engineers played an active role in evaluating the project outcomes and are expected to use the findings to support the potential scale-up and integration of these systems into broader municipal sanitation planning.
Hygiene promotion and behavioural change activities were included as part of the demonstration project. Community workshops promoted best practices and both baseline and endline surveys assessed user acceptance, satisfaction and shifts in hygiene behaviour. Early findings indicate increased user satisfaction, improved hygiene habits and greater community ownership of the new sanitation infrastructure. Figure 5 shows the usage of the newly installed toilet block from one the communities:
The demonstrations included detailed cost assessments covering technology procurement, installation, O&M, training, consumables and security services. During the demonstration period, SASTEP provided funding support, including janitorial services, hygiene consumables and security personnel. Post-demonstration, the municipalities will assume full operational responsibility, guided by comprehensive O&M manuals and handover documents to be provided. Cost ranges for Capex and Opex for WESS/NSS are indicated in Table 1 (specific WESS/NSS could not be provided as this is confidential information).
Note - This are estimatory/budget figures and they are not firm quotes/prices and specifics cannot be provided as this would be divulging into confidential information.
Products/Tools/Guidelines
Field-Testing Guideline
SANS 30500/24521 Awareness and Training Material
Selecting Sanitation Systems
SaniSelect Decision Making Tool
Writing a Sanitation Policy
Procurement Processes for Alternative Sanitation Systems
Cost Comparison Tool for WESS/NSS vs Conventional Sanitation Systems
A document that provides standardised field-testing guideline, assessment and evaluation criteria for innovative technologies
A document that introduces SANS 30500 and SANS 24521, the process of certification and compliance, alignment of these standards with existing regulatory frameworks and the latest development South Africa and Worldwide
A document providing a framework for understanding sanitation systems and suggests key criteria to consider in selection of systems
An MS Excel tool created to assist decision makers in weighing different technology options along the sanitation value chain, based on the criteria considered in selection of sanitation systems
A document providing some guidance on how municipalities can craft a sanitation policy
A document that suggests various approaches to procuring alternative sanitation systems
A tool for techno-economic cost modelling tool that can used to compare WESS/NSS and conventional sanitation solutions thus increasing sanitation service delivery options and effectiveness
Demonstration challenges included access to sites, which was facilitated by the municipalities, inappropriate user practices such as flushing unsuitable materials and disposing of night buckets into the toilets, these were mitigated through community engagement workshops, delays in municipal approvals which were addressed with the support from municipal engineers, weather-related delays and rework due to substandard quality of work by local contractors. These challenges were vital to inform site selection, user behaviour and contractor management, all of which shapes the roadmap for scaling up.
The pilots in eThekwini and Cape Town illustrate the feasibility of deploying innovative sanitation systems in unserved areas. Lessons learned includes the importance of site-specific needs analysis, structured training, early municipal involvement and clearly defined post-project responsibilities. Municipal engineers are expected to lead the integration and scale-up of suitable technologies based on demonstrated success and local context.
Replicability of SASTEP Model
SASTEP’s success lies in its field testing of sanitation technologies in various settings within South African contexts. Municipalities can replicate these models using clear implementation toolkits and operational guidelines as shown in Table 2 developed under SASTEP (WRC, 2022). Technologies are designed for modular deployment, enabling gradual scale-up based on budget availability and community readiness.
Municipalities are encouraged to integrate decentralised sanitation into spatial development frameworks, housing upgrades and public infrastructure. Retrofitting public ablution blocks, schools and informal settlements with next-generation sanitation enhances service equity and resilience. Infrastructure grants, disaster response budgets and green funding sources can be leveraged for integration.
Municipal adoption of these innovations should be accompanied by
inclusive community engagement. Local champions, inclusive maintenance teams and hygiene promotion programmes increase system acceptance and reduce vandalism. Municipalities should invest in training to build local technical skills for installation, maintenance and monitoring (Sindall et al.2021).
6. POLICY, REGULATORY AND STANDARDS CONSIDERATIONS Policy Influence
Advocacy and technical support provided by SASTEP has significantly contributed to the revision of policy and regulatory frameworks to support sustainable sanitation practices. Through collaboration with the Department of Water and Sanitation (DWS), SASTEP has facilitated mainstreaming of NSS into national policy instruments (See figure 6 below). Key milestones also include the recognition of NSS in the revised national norms and standards for sanitation and its incorporation into the DWS National Sanitation Implementation Plan (NSIP). These policy shift marks a transformative step towards institutionalising alternative sanitation technologies as viable complements to traditional sewered infrastructure.
SASTEP has also played a vital role in driving the adoption of international standards for WESS/ NSS technologies. South Africa was the second country globally to adopt ISO 30500 an international standard for prefabricated NSS systems through its national equivalent, SANS 30500 in 2019. This inclusion in the national building regulations ensures that NSS technologies are implemented with technical rigour, safety and user acceptability in mind.
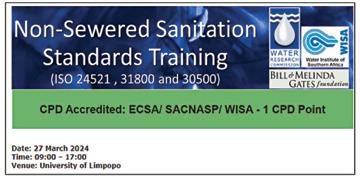
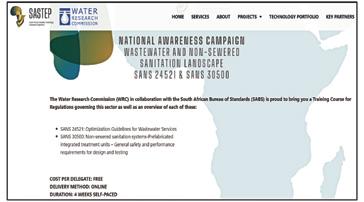
The WRC, in partnership with regulatory stakeholders, continues to support national capacity-building efforts by offering training programmes to familiarise municipal officials, regulators and service providers with these standards (See Figure 7 & 8).
The alignment of national policies and standards with innovative sanitation solutions has led to increased demand and regulatory readiness for WESS and NSS technologies across municipalities. These changes have established an enabling environment for piloting, scaling and mainstreaming sustainable sanitation innovations nationwide. To date, SASTEP has:
• piloted sanitation innovations in 21 demonstration sites, benefiting over 10,000 users in schools and informal settlements.
• catalyzed national scale-up, with the Department of Basic Education further procuring WES/NSS for 48 schools covering 31,000 learners in 3 provinces (KZN, EC and LP)
• enabled private sector organisations through donors, donations and tenders to procure 21 WESS/NSS (for schools, industrial sites and residential areas) which supported a further 4054 users
To date, SASTEP has enabled dignified, off-grid and water-efficient sanitation access for more than 46,000 individuals, directly addressing service gaps in underserved communities. SASTEP has proven that sustainable engineering principles can be applied effectively to improve municipal sanitation service delivery. WESS/NSS addresses the core challenges, water scarcity, infrastructure deficits, social inequity and environmental impact. Municipalities across South Africa are encouraged to replicate this approach, tailoring it to local conditions and aligning it with development goals and climate change plans. With appropriate policy support, community engagement and technical capacity, sustainable sanitation innovations can redefine municipal service delivery for a more equitable and resilient future.
To effectively scale sustainable sanitation solutions, municipalities should integrate decentralised systems into their planning instruments, such as Integrated Development Plans (IDPs) and Water Services Development Plans (WSDPs), particularly for informal settlements and underserved areas. Policy reforms are necessary to enable the adoption of next-generation sanitation technologies by aligning municipal by-laws and building codes with standards like ISO 30500. SASTEP has established demonstration sites showcasing these technologies to build public trust and facilitate learning. Simultaneously, municipalities should invest in capacity building by partnering with local training institutions and NGOs to develop technical skills for installation, operation and maintenance.
In addition, municipalities are encouraged to strengthen public-private partnerships to mobilize resources and co-develop context specific solutions. Inclusive community engagement should be institutionalized, ensuring active participation from women, youth and local leaders to enhance ownership and system sustainability. Monitoring and evaluation systems should be established to track key performance indicators, such as water savings, emissions reduction and job creation.
Lastly, aligning sanitation efforts with national and global sustainability frameworks, such as the Sustainable Development Goals (SDGs) and South Africa’s climate commitments, will reinforce the strategic importance of innovative sanitation as a driver of sustainable urban development.
9. REFERENCES
Adeyeye, K, Gibberd, J., Chakwizira, J 2020, Water Marginality in Rural and Peri-Urban Communities, Journal of Cleaner Production, vol. 273, 122594
Gates Foundation, 2011, Water, Sanitation and Hygiene: Re-invent the toilet challenge factsheet
Majeke, P, 2023. Building climate resilience in the sanitation value chain through innovative technologies towards circular economy, Water Research Commission, Pretoria
Trade Industrial Policy Strategies (TIPS), 2018, Forward-looking approach to next generation sanitation and industrial development in South Africa
Pillay, S,2021. Products that can be made from our Pee and Poop, Water Research Commission, Pretoria
Sindall, R.C., Cottingham, R., Arumugam, P., Mercer, S.J., Sutherland, C., Alcock, N., Buckley, C.A.
Gounden, G. 2021 Lessons learned from operating a pre commercialisation field-testing platform for innovative non-sewered sanitation in Durban, South Africa, Water SA, 47(4).
Sindall, R., Cottingham, R., Sutherland, C., Mercer, S., Pocock, J., ArumugamNanoolal, P., Reddy, M, 2021. Field-testing and Demonstration of Sanitation Technologies: Guidelines for the South African Sanitation Technology Enterprise Programme. Pretoria.
United Nations Environment Programme (UNEP), 2022. Towards a Green Economy: Pathways to Sustainable Development and Poverty Eradication
Zhou, L.; Kori, D.S; Sibanda, M.; Nhundu, K. An Analysis of the Differences in Vulnerability to Climate Change: A Review of Rural and Urban Areas in South Africa. Climate 2022, 10, 118.
Author: Andria Munien
ECSA, Project Management Institute, Water Institute of South Africa, MIMESA
ABSTRACT
uMgungundlovu District Municipality (UMDM), like many water services authorities across South Africa, faces a dual crisis: high non-revenue water (NRW) levels and aging, hazardous asbestos cement (AC) infrastructure. These challenges not only threaten water security and service delivery but also strain municipal finances and erode public trust. In alignment with the IMESA 2025 theme of Sustainable Engineering Solutions, UMDM has embarked on a multi-faceted, technology-driven initiative that integrates smart metering, targeted AC pipeline replacement, and catalytic wastewater infrastructure development to address these urgent issues. This project centres on three strategic pillars: (1) the phased replacement of AC pipelines across six local municipalities within UMDM to reduce physical water losses and mitigate health risks; (2) the deployment of ultrasonic smart meters, both domestic and bulk, to digitize water management, enable real-time monitoring, and enhance billing accuracy; and (3) the design and implementation of a new 2ML Wastewater Treatment Works (WWTW) in Mkhambathini Local Municipality (Camperdown), which will serve as a growth enabler and revenue catalyst for the region.
At the forefront of this initiative is a pilot project currently underway in Howick, focused on smart meter deployment and AC pipeline replacement. This pilot is testing key technologies and implementation methodologies to inform a district-wide roll-out strategy. It provides valuable insights into field deployment logistics, meter accuracy, remote data acquisition, and integration with existing utility systems. Smart meters are not merely a metering upgrade; they are the cornerstone of a digital utility transformation. By enabling remote readings, early leak detection, and usage profiling, these devices address both apparent and real losses in
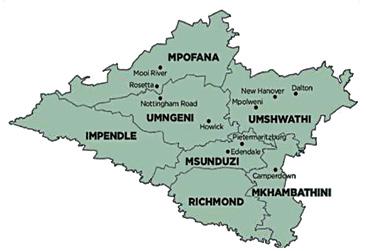
NRW. AC pipeline replacements complement this by tackling systemic physical losses caused by deteriorating infrastructure. Together, these interventions are supported by robust meter data management systems (MDMS), customer portals, and analytics engines that turn raw data into actionable intelligence. The inclusion of the WWTW in Camperdown, a strategic growth node, ensures long-term sustainability through wastewater recycling potential and tariff recovery for sanitation services. The combined initiative fosters operational efficiency, financial resilience, and environmental responsibility.
This integrated approach serves as a blueprint for other municipalities seeking to transition from reactive service provision to data-driven water governance. It demonstrates that engineering solutions, when strategically aligned, can enable a municipality not only to reduce NRW but to transform it into a driver of sustainability, service excellence, and revenue growth.
The uMgungundlovu District Municipality (UMDM), located in KwaZuluNatal, South Africa, is currently experiencing significant water management challenges that include ageing infrastructure, high non-revenue water (NRW) rates, and inadequate wastewater treatment facilities. The cumulative effect of these challenges severely compromises water service delivery, public health, economic growth, and environmental sustainability. In response, UMDM have embarked on the ONE PLAN Losses-2-Revenue programme initiative to sustainably enhance water service delivery and management through advanced technological applications, strategic infrastructure upgrades, and strengthened institutional capacity.
UMDM’s water distribution infrastructure primarily consists of aged asbestos cement (AC) pipelines installed several decades ago. These pipes are now beyond their expected service life and are prone to frequent failures and bursts, leading to extensive water loss, disrupted supply, and heightened operational costs.
Beyond the mechanical failures of ageing AC pipes, asbestos fibres in potable water can pose serious health risks, particularly with long-term ingestion. In South Africa, this issue is especially relevant due to the historic use of asbestos-cement pipes in water distribution systems. The risks associated with ingestion (via drinking water), relative to inhalation, are less well established but remain a concern; studies by the U.S. EPA (United States Environmental Protection Agency) and the WHO (World Health Organization) note a possible association between ingested asbestos and cancers of the oesophagus, stomach, and intestines. With prolonged exposure at high fibre concentrations, the risk may increase.
Taken together, the mechanical unreliability of old AC mains and the associated risk considerations make a strong case for an accelerated replacement and risk-mitigation programme, supported by active leakage control, pressure management, and metering accuracy improvements. These interventions directly curb avoidable losses and create the conditions for sustained reductions in system inefficiencies.
In parallel, high NRW levels exacerbate the economic pressures on the municipality, with significant volumes of water lost through leaks, inaccurate metering, theft, and illegal connections. Currently, NRW stands at approximately 67%, resulting in substantial revenue losses, hindering UMDM’s ability to sustainably manage water resources and infrastructure effectively.
Additionally, inadequate wastewater treatment infrastructure restricts new developments, particularly along strategic economic corridor SIP2, further limiting regional economic growth and urban expansion within the Mkhambathini Local Municipality, Camperdown area.
To address these challenges, the ONE PLAN Losses-2-Revenue programme consists of three primary components, that together address the losses and promote economic growth:
The AC Pipeline Replacement initiative stands as a critical and one of the primary components of UMDM’s comprehensive infrastructure strategy, designed to proactively address ageing water distribution infrastructure. The program involves a carefully structured phased approach to upgrading and replacing approximately 1,230km of deteriorating asbestos cement (AC) pipelines spread across various Local Municipalities (LMs) within the district. Given, the significant age and vulnerability of these AC pipelines, this replacement is essential to ensure reliable water supply, improve public health outcomes by mitigating asbestos-related risks, and significantly reduce operational costs stemming from frequent pipeline bursts and leaks. The materials selected for pipeline replacement offer superior durability, enhance water quality, and ensure substantial reductions in future maintenance and replacement costs. This strategic selection aligns with sustainability objectives and long-term financial prudence, significantly extending asset lifespan and minimizing environmental impacts.
Moreover, to ensure the initiative’s success in significantly reducing Non-Revenue Water (NRW), comprehensive Water Conservation and Water Demand Management (WCWDM) practices will be concurrently implemented. The strategy includes the creation of District Metered Areas (DMAs) that facilitate precise measurement and management of water distribution, enabling targeted interventions in zones with the highest water losses. The integration of Pressure Reducing Valves (PRVs) will further address issues related to water leakage, pipe bursts, and overall distribution system inefficiencies by managing pressure in high-pressure zones effectively.
State-of-the-art technologies such as digital twin technology and Building Information Modelling (BIM) software will play an integral role in optimizing the project’s planning, design, and execution. Digital twins provide realtime virtual models of the physical pipeline assets, enhancing predictive maintenance capabilities, risk mitigation, and operational optimization. Concurrently, BIM software facilitates accurate and collaborative project execution, ensuring seamless integration between various project phases from conception through to implementation and maintenance.
By systematically combining pipeline replacement with advanced water management practices and cutting-edge technological applications, UMDM ensures not only immediate enhancements in infrastructure reliability but also sustainable reductions in NRW. These initiatives align closely with the stringent NRW reduction targets set by the Department of Water and Sanitation (DWS), enabling UMDM to lift current growth restrictions and foster robust economic and infrastructural development across the district.
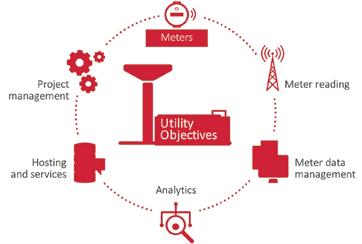
Smart metering represents a sophisticated approach to water resource management by leveraging advanced ultrasonic technology and realtime remote communication capabilities. These intelligent meters provide precise data collection and accurate measurement of water consumption, surpassing traditional mechanical meters in reliability, accuracy, and operational efficiency. Smart meters, devoid of moving parts, maintain consistent accuracy throughout their operational lifespan, significantly reducing maintenance requirements and operational costs.
Integral to UMDM’s strategic initiative, the deployment of smart metering infrastructure aims to modernize water management, optimize operational processes, and enhance financial sustainability. The adoption of ultrasonic smart meters and Low Power Wide Area Network (LPWAN) communication technology forms the foundation of a robust infrastructure, facilitating secure, reliable data transmission and enabling proactive management through real-time analytics.
To ensure strategic alignment and stakeholder coherence, the smart metering program in UMDM is meticulously scoped, with clearly defined objectives designed specifically for the region’s infrastructure challenges and operational context. By transitioning to remote data collection, UMDM addresses common inefficiencies associated with manual meter readings, such as inaccuracies and labour-intensive processes, significantly enhancing the quality and immediacy of data.
A comprehensive Meter Data Management System (MDMS) underpins the smart metering framework, aggregating vast data streams from the meters to offer valuable insights into consumption patterns, system leakages, and demand forecasting. This analytical capability enables utility managers to adopt proactive and targeted maintenance strategies, ultimately enhancing infrastructure reliability and optimizing resource allocation.
Customer engagement is notably enhanced through integrated, user-friendly portals providing real-time visibility of water usage. Such transparency fosters greater awareness among consumers, encouraging water conservation behaviours and resulting in improved billing accuracy, fairness, and customer satisfaction.
Key Benefits of Smart Metering within the UMDM ONE Plan include:
• Cost savings: By detecting leaks and providing more accurate billing, smart meters can help reduce water waste and lower costs for both Utilities and consumers. Automation and visibility in the meter to cash process, allows for increased operational efficiency.
• Increased transparency and fairness: Smart meters can help ensure that water billing is based on actual usage, rather than estimated usage, leading to a more fair and transparent billing process.
• Improved customer experience: With access to real-time usage data and the ability to monitor their water consumption, customers can make informed decisions about their water usage and reduce their costs.
• Revenue enhancement: With the above benefits and innovative credit control policy mechanisms from the meter to cash process, revenue streams are significantly enhanced.
• Improved water management: Real-time data on water usage enables users to monitor and manage water resources more efficiently.
• Sustainability: By reducing water waste and promoting conservation, smart water meters can help conserve water resources and contribute to a more sustainable future.
The smart metering initiative brings clear financial and operational improvements. It contributes to long-term financial stability by increasing revenue recovery, controlling costs more effectively, and improving overall profitability. On the operational side, the programme supports ongoing innovation, drives efficiency, and reduces waste.
UMDM’s implementation prioritizes three key areas:
• Accurate Billing: Strengthening the reliability of metering and billing systems to prevent losses due to incorrect or missed charges.
• Loss Prevention : Reducing risks such as meter tampering and unauthorized use through built-in monitoring and alert features.
• Income Optimization: Boosting revenue by identifying unmetered consumption and improving follow-up on outstanding payments. Qualitative advantages encompass improved customer satisfaction by providing customers real-time updates on water consumption, quality, and supply disruptions, thereby significantly enhancing responsiveness and trust in the utility. The program is also closely aligned with broader economic, social, and environmental imperatives, aiming to achieve sustainable water management practices. This holistic approach emphasizes responsible resource utilization, equitable social outcomes, and long-term environmental sustainability.
Smart metering within UMDM specifically addresses several types of water losses:
• Inaccurate Mechanical Meters : Mechanical meters are often less accurate than ultrasonic meters, especially over time. They start measuring only after a higher flow of water, leading to unrecorded water usage. Ultrasonic meters, which don’t have moving parts, remain accurate throughout their life, helping reduce unbilled water usage.
• Manual Meter Reading Problems: Reading meters by hand takes a lot of time and is prone to errors, which can lower the quality of your data. This makes managing Non-Revenue Water more challenging.
• Switching to Remote Readings: Using remote readings can prevent mistakes and save time. It allows you to update your water usage data more frequently, from yearly to monthly or even daily. This helps you quickly spot and address problems.
• Theft Detection: Smart meters can send alerts if there’s any tampering or theft attempts, letting you respond quickly.
• Identifying Unmetered Water Use : Smart meters help distinguish between real water losses (like leaks) and apparent losses (due to meter inaccuracies or usage not being recorded). This is crucial for managing water loss in different areas, such as construction sites.
• Leak Detection Efficiency: New technology in smart meters provides a clear view of your water distribution, making it easier and more efficient to locate leaks. This allows you to prioritize leak detection efforts more effectively.
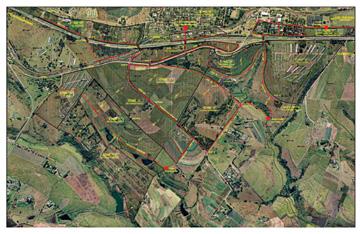
• Household Leaks: Leaks inside a house may not affect revenue directly, but they can cause high bills for consumers. Smart meters can detect these leaks early, allowing you to alert the customer and reduce water loss.
• Service Connection Leaks: Smart meters with acoustic leak detection act like a network of noise-loggers, constantly monitoring for leaks. This lets you focus on specific areas for leak checks, saving time and resources compared to manual methods or separate devices
In summary, UMDM’s comprehensive smart metering deployment represents a strategic, technology-driven transformation towards sustainable municipal water management. By systematically addressing operational inefficiencies, enhancing financial and resource sustainability, and delivering superior customer engagement, the program sets a robust framework for resilient, future-proofed water resource management.
The new Wastewater Treatment Works (WWTW) in Mkhambathini Local Municipality is an essential infrastructure catalyst aimed at overcoming current development restrictions linked to insufficient sanitation services. The facility will serve as a cornerstone for unlocking significant developmental potential, particularly in fostering the growth and establishment of Camperdown as a dynamic business and industrial hub along the prominent N3 economic corridor. Employing cutting-edge digital twin technology and Building Information Modelling (BIM) software, the design, construction, and operation phases of the WWTW will be meticulously optimized. Digital twin technology will offer real-time digital replicas of physical assets, enabling precise predictive analytics, enhanced efficiency, and proactive maintenance management. Simultaneously, BIM software will facilitate seamless integration, collaboration, and accuracy throughout the project lifecycle, ensuring compliance with rigorous environmental regulations and standards.
This WWTW will be crucial in enabling and accelerating major commercial and industrial developments within the Camperdown area, significantly enhancing regional economic prosperity. Among these anticipated developments are a landmark R7 Billion Heineken Brewery Plant, a R40 Billion Aviation Fuel Facility, a R1 Billion Chemical Factory, a R50 Million Spar Centre Upgrade, and a R150 Million Solar Installation. Collectively, these developments underscore the transformative economic impact that this infrastructure investment will facilitate.
The recent strategic emphasis placed on the N3 Corridor and the District Development Model (DDM), alongside ambitious plans for establishing Camperdown as a green smart city, further reinforces the imperative for
a reliable, efficient, and environmentally sustainable WWTW. Without this essential facility, the significant economic opportunities, investments, and sustainable development envisioned for the Camperdown Smart City cannot materialize.
The integration of smart metering technology for both water and electricity within the WWTW will further enhance resource management, operational efficiency, and sustainability. Additionally, linking the WWTW to the smart city infrastructure will significantly bolster the green credentials of the Camperdown development, promoting water and energy conservation, effective waste recycling, and overall environmental stewardship.
The catalytic Wastewater Treatment Plant in Mkhambathini not only addresses immediate sanitation constraints but also strategically positions the region for substantial economic growth, technological advancement, and sustainable urban development, ultimately serving as a model for modern infrastructure development in South Africa.
The completion of the WWTW in conjunction with the AC Replacement and Smart Metering initiatives, will also facilitate the removal of the 0% growth restriction imposed by the Department of Water and Sanitation (DWS), contingent upon measurable reductions in NRW, thereby unlocking new water connections and fostering sustainable infrastructure growth.
Financial Strategy and Institutional Capacity
UMDM has strategically aligned the infrastructure upgrade program with national funding frameworks, Private and Public collaborations and the District Development Model (DDM), ensuring financial sustainability and operational accountability. This approach projects a substantial return on investment, significantly improving revenue generation through enhanced billing accuracy and substantial NRW reductions.
Institutionally, the municipality has established a dedicated Programme Management Unit (PMU), which collaborates closely with specialized consultants, strategic partners, and performance-based contractors. Capacity-building initiatives, including targeted training and skills development programs, are embedded within the project framework to ensure sustainable operational excellence.
Socio-economic and Environmental Benefits
The initiative is expected to generate significant socio-economic benefits,
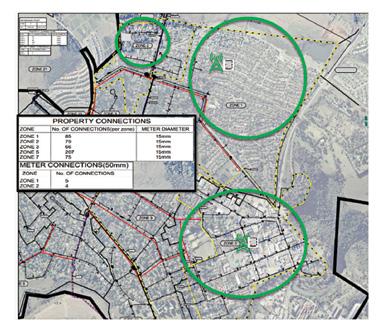
creating approximately 12,800 job-years and promoting regional economic stability. By providing reliable water services, the program directly contributes to poverty alleviation and improved public health outcomes. From an environmental perspective, the replacement of hazardous AC pipelines and establishment of advanced wastewater treatment infrastructure significantly mitigates health and environmental risks, aligning with both national and international regulatory standards. These interventions support broader climate resilience goals and ensure the sustainable management of vital water resources.
The Howick Pilot Project is a foundational component of UMDM’s integrated ONE Plan initiative, serving as a practical demonstration of the broader strategy to modernize water management, reduce non-revenue water (NRW), and enhance revenue collection. Launched in July 2024 under the ONE Plan framework, the Howick pilot aligns directly with the initiative’s three pillars: AC pipeline replacement, smart metering deployment, and infrastructure-driven revenue catalysts.
By situating Howick within the ONE Plan, the pilot exemplifies how targeted, phased interventions contribute to district-wide objectives. The AC pipeline replacement efforts in Howick are coordinated with smart metering roll-out, ensuring that physical loss reduction and accurate usage measurement occur in tandem. This integrated approach mirrors the overarching goal of synchronizing supply-side improvements (pipeline upgrades) with demand-side innovations (smart meters) to achieve measurable NRW reductions.
• Physical Loss Reduction: Replace ageing AC pipelines in the Howick area as part of the phased district-wide AC renewal, utilizing durable materials and digital twin/BIM tools for precise planning, risk mitigation, and lifecycle management.
• Digital Transformation : Deploy ultrasonic smart meters with Low Power Wide Area Network (LPWAN) connectivity across selected customer clusters, integrated into the MDMS platform, to enable realtime monitoring, proactive leak detection, and seamless data-driven decision-making.
• Revenue Enhancement: Automate billing processes tied to the smart meters, reducing operational inefficiencies and revenue leakage. Howick’s pilot billing automation is piloted within the ONE Plan’s revenue-enhancement framework, informing district-wide billing strategies.
• Stakeholder Engagement and Capacity Building: Conduct targeted stakeholder consultations, training sessions, and communication campaigns in Howick to ensure community buy-in and operational readiness, reflecting the ONE Plan’s emphasis on institutional strengthening.
• Digital Twin/BIM in Howick : Digital twin models/BIM software are employed in Howick to create precise virtual representations of the existing pipeline network, facilitating scenario analysis for replacement works, predicting system pressures, and optimizing project timelines. These tools align with the ONE Plan’s commitment to leveraging advanced technology for efficient implementation and long-term asset management.
• Smart Meter and MDMS Integration Testing : As part of the
construction-phase activities, planned smart meters in Howick will interface with the central MDMS platform once commissioned, enabling future analytics to identify leak patterns, consumption anomalies, and demand trends. This anticipated integration exemplifies the ONE Plan’s data-centric methodology: field-collected data will feed analytic engines to support proactive interventions and, after system commissioning, provide evidence toward validating NRW reduction efforts.
• Construction Progress and Early Learnings: During the construction phase in Howick, initial installation logistics have been tested, revealing insights into coordination between contractors, field teams, and local stakeholders. These learnings inform refined scheduling, resource allocation, and risk mitigation strategies for subsequent phases.
• Technological Integration Testing: Early-stage integration of digital twin models, BIM workflows, and smart metering hardware is underway, allowing the project team to verify data flows, communication reliability, and system interoperability.
• Stakeholder Engagement in Practice: Construction-phase engagement activities, such as community briefings, technical demonstrations, and training sessions, have provided feedback on communication approaches and stakeholder expectations. This feedback shapes refined engagement strategies for wider rollout, ensuring continued community support.
• Operational Readiness Preparations : Preliminary training of operational staff on new technologies and maintenance procedures is still to be implemented. Early simulations and dry runs will highlight areas requiring additional capacity-building, which will be addressed before full commissioning.
• Anticipated Benefits Tracking Framework : Though full outcomes await post-commissioning data, the project team has established monitoring frameworks and key performance indicators aligned with ONE Plan targets. These frameworks will enable systematic tracking of NRW reductions, billing accuracy improvements, and system reliability once operational data becomes available. By documenting construction-phase observations and preparing rigorous monitoring protocols, the Howick pilot positions UMDM to demonstrate, upon commissioning, measurable progress toward lifting DWS-imposed growth restrictions. The anticipated data-driven evidence will support the ONE Plan’s objective to unlock new water connections and catalyse broader development initiatives.
The Howick Pilot Project, as part of the ONE Plan initiative, validates the integrated strategy of coupling AC pipeline renewal with smart metering and data analytics to achieve sustainable water management. Its outcomes offer actionable insights and a proven blueprint for expanding similar interventions throughout UMDM, reinforcing the ONE Plan’s vision of transforming water governance into a driver of operational excellence, financial resilience, and socio-economic growth.
The uMgungundlovu District Municipality’s ONE Plan initiative exemplifies a robust and forward-thinking response to significant water management challenges, including ageing infrastructure, high non-revenue water (NRW) levels, and inadequate wastewater treatment capabilities. The strategic integration of AC pipeline replacement, smart metering infrastructure deployment, and the catalytic wastewater treatment plant in Mkhambathini positions the district to overcome operational, environmental, and economic constraints sustainably. The Howick Pilot Project illustrates
practical, ongoing efforts to validate this integrated approach, emphasizing real-time data management, advanced technology applications, and enhanced stakeholder engagement. Collectively, these initiatives promise substantial socio-economic benefits, environmental improvements, and a blueprint for sustainable municipal water governance, ultimately promoting operational resilience, financial sustainability, and regional economic growth.
To ensure the successful continuation and broader implementation of the ONE Plan initiative, the following recommendations are proposed:
• Accelerate Infrastructure Implementation:
o Expedite the phased replacement of ageing AC pipelines, prioritizing high-risk and high-loss areas based on comprehensive asset management data.
• Complete and Evaluate Pilot Initiatives:
o Ensure timely completion and thorough evaluation of the Howick Pilot Project to gather essential insights on logistical, technological, and operational integration, informing future phases of district-wide implementation.
• Enhance Data-Driven Decision-Making:
o Expand and fully integrate the Meter Data Management System (MDMS) with advanced analytics capabilities district-wide to facilitate proactive maintenance, targeted NRW interventions, and accurate revenue collection.
• Institutional Strengthening and Capacity Building:
o Invest in continuous professional development and targeted training programs for operational and technical staff to ensure optimal management and sustainability of new technologies and infrastructure.
• Community Engagement and Transparency:
o Sustain robust stakeholder and community engagement efforts, using transparent communication strategies and interactive platforms to enhance public trust and collaborative participation in water conservation initiatives.
• Align with Regulatory and Funding Frameworks:
o Continue strategic alignment with national funding mechanisms and regulatory standards to secure additional resources, ensuring compliance and enhancing the financial viability and sustainability of infrastructure projects.
• Foster Economic Development:
o Capitalize on infrastructure improvements, particularly the catalytic wastewater treatment plant, to actively facilitate and attract commercial and industrial investments, thereby stimulating regional economic growth and job creation.
• Commitment to Environmental Sustainability:
o Maintain rigorous adherence to environmental best practices and sustainability standards in all project phases, leveraging digital technologies such as BIM and digital twins to optimize environmental outcomes and resource utilization. By diligently applying these recommendations, UMDM will effectively
transform its water management challenges into sustainable opportunities, providing a replicable model for other municipalities seeking similar transformations in water governance and infrastructure management.
REFERENCES
Academic and Industry Sources:
• American Water Works Association (AWWA), “Manual of Water Supply Practices M36: Water Audits and Loss Control Programs”.
• Lambert, A.O. & Hirner, W. (2000). “Losses from Water Supply Systems: Standard Terminology and Recommended Performance Measures”, International Water Association (IWA).
• EPA Website https://www.epa.gov/asbestos
• World Health Organization Website: https://www.who.int/news-room/fact-sheets/detail/asbestoselimination-of-asbestos-related-diseases
Department of Water and Sanitation (DWS), South Africa:
• Guidelines on Non-Revenue Water Reduction.
• Infrastructure Funding Guidelines: RBIG, WSIG, and BFI.
Ensync UMDM Presentations:
• UMDM NRW Reduction and Smart Meter Solution Pilot Kick Off Presentation, July 2024.
• UMDM AC Pipeline Replacement Project Execution Plan, February 2024.
• ONE Plan Losses-2-Revenue Programme Reports, 2024–2025.
• Camperdown and Mkhambathini Local Municipality Development Reports and Strategic Plans, 2024.
International Water Association (IWA):
• International Best Practices for Water Loss Management.
• Smart Water Networks Forum (SWAN). (n.d.). Available at: https://www.swan-forum.com.
Legislation and Health Standards:
• South African National Standards (SANS) 241: Drinking Water Standards.
• Health and Safety Standards for Asbestos Management, Department of Labour, South Africa.
National Treasury, South Africa:
• Budget Facility for Infrastructure (BFI) Guidelines.
• Public-Private Partnership (PPP) Manual.
Technology and Methodology References:
• Digital Twin Technology in Water Infrastructure Management.
• Building Information Modelling (BIM) Handbook, Third Edition (2018).
• Kamstrup Ultrasonic Smart Meter Technical Documentation.
Water By-laws and Regulatory Frameworks:
• Water Services Act, 1997 (Act No. 108 of 1997), South Africa.
• National Environmental Management Act (NEMA), South Africa.
• National Water Act, 1998 (Act No. 36 of 1998), South Africa.
M.D. Giliomee1, T. Phokoje1, I. Loots1 and M. Van Dijk1
1Department of Civil Engineering, University of Pretoria, Lynnwood Road, Pretoria, 0002
Culverts play an important role in the stormwater drainage system and transport infrastructure of a country. They are designed to convey a specific flow capacity beneath roads, highways, or through embankments. However, culverts can become hydraulically insufficient over time due to increasing flood peaks. Flood peaks for rarer events have already increased across many parts of the world due to climate change. Additionally, continuing urbanisation increases runoff volume by expanding impermeable surfaces. Therefore, during flood events, inadequate local drainage can lead to infrastructure damage, inconvenience for road users and potential loss of life. Culverts are also often overestimated. When the river channel is wider than the culvert barrel, the momentum of water entering a square-edge culvert inlet creates a flow contraction just after the inlet, reducing discharge capacity. Modifying the culvert inlet to provide a more gradual transition can increase capacity and negate the need to rebuild the entire inadequate culvert structure, offering a cost-effective solution with minimal traffic disruption. This study used physical modelling to evaluate inlet modifications, specifically rounded inlet edges, for circular culverts under inlet control. It was built on previous findings that wingwalls and headwalls offered limited flow improvement for circular culverts, whereas rounded or tapered inlets that guided water directly into the barrel significantly improved culvert performance. Therefore, modifications included different sizes of rounded edge inlets. A rounding radius of 0.35D was shown to improve flow by up to 44% at a headwater depth of 2D (twice the barrel height). It is envisaged that these improvements will be retrofitted to many existing culverts. Therefore, the effect of having the inlet improvement projected from the existing wall, was tested. The difference in upstream water levels was insignificant whether inlets were projected or integrated with the wall; the inlet rounding itself had a much greater impact.
A desktop case study was conducted to demonstrate how inlet improvements can be applied in practice and to assess their economic viability. The case study focused on a 600 mm diameter pipe culvert located on the R396 between Tsolo and Maclear in the Eastern Cape. The existing culvert was found to be hydraulically insufficient; however, the research shows that it can meet hydraulic requirements after retrofitting inlet modifications and significant cost savings were identified. These relatively simple inlet modifications can therefore offer a sustainable solution for adapting to increased flood risks caused by climate change and urbanisation.
Culverts are integral to a country’s stormwater drainage system and transport infrastructure (Jaeger et al. 2019). They are designed to convey a specific flow capacity beneath roads, according to Schall et al. 2012, and therefore, when roads are upgraded, existing culverts might need to be upgraded as well
to comply with the new road standards Additionally, culverts can become insufficient over time due to increasing flood peaks caused by higherintensity rainfall events and urban development (Alexander 1995, Cullis et al. 2015, McBride et al. 2022, Namanyane 2019, Wasko et al. 2021). Inadequate drainage could damage infrastructure and cause possible casualties during frequent flood events.
The flow through a hydraulically insufficient culvert could be increased by replacing the underperforming structures or adding more barrels. However, these solutions are cost intensive. A cost-effective solution might involve modifying existing culverts to increase discharge capacities (Jaeger et al. 2019). This would remove the need to overspend on conservative options such as replacements and increasing barrel structures.
A knowledge gap exists when examining rounded inlet modifications. According to Jaeger et al. 2019, a rounding of at least 15% of the culvert width offers the greatest reduction in turbulence and the greatest improvement in the discharge capacity. The study suggested that increasing the radius beyond this point is unlikely to offer any additional improvement. However, Jones et al. 2006 noted that the ideal radius of the rounding should extend to the full width of the culvert.
Another point of contention lies in the choice between implementing wallintegrated or projected inlet modifications. Jaeger et al. 2019 suggested that greater performance gains may be achieved if the inlet modifications are integrated into the headwall rather than projected into the flow path as seen in Figure 1. However, projected inlet modifications offer cost and construction advantages. Therefore, if the performance difference is marginal, projected rounded inlets may be a more practical solution compared to wall-integrated inlet edges.
Previous findings indicated that wingwalls and headwalls offered limited flow improvement for circular culverts, while rounded or tapered inlets that guide water directly into the barrel significantly improved culvert performance. Building on these findings, this study aimed to address research gaps related to circular culverts with rounded inlet edges under inlet control conditions by evaluating:
(a) Various radii of curvature for rounded edge inlets to investigate the effect of increasing the transition zone on culvert performance.
(b) The hydraulic performance between wall-integrated and projected models as depicted in Figure 1.
(c) The cost implications of retrofitting inlet modifications versus installing an additional culvert barrel in parallel, based on a case study site.
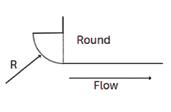
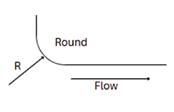
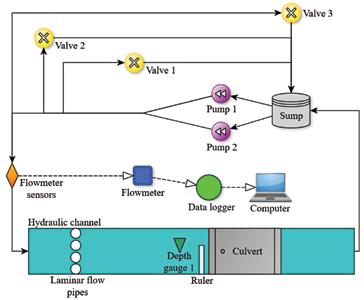
Physical modelling
The experiment was conducted in a flume with a width 450mm and height of 500mm. At the upstream end, laminar flow pipes were installed to ensure uniform flow towards the culvert inlet and reduce wave action.
A circular culvert model with an internal diameter (D) of 192mm, was installed downstream of the conduits. A ruler was installed just upstream of the culvert face to measure the headwater depth (H1). A depth gauge was installed at a distance of 3D from the face of the culvert to measure flow depth. This distance was adjusted for all subsequent profiles projected from the face of the culvert. At the downstream end, a sump collected the water, which was recirculated through the system using a pump. The schematic in Figure 2 details the layout of the system.
Inlet profiles were installed and tested at the culvert entrance. Water was pumped into the flume, and flow rates were adjusted using three control valves located on the premises (Figure 2). The valves were adjusted in various
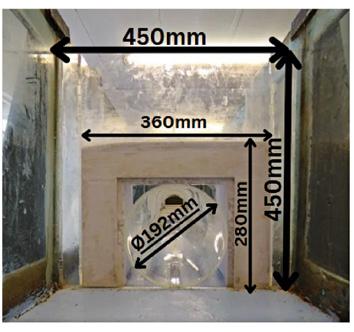

sequences to achieve flow rates ranging from 4l/s to 57l/s. The flow rates were recorded utilizing an ultrasonic flow meter. Furthermore, the flow depths corresponding to each flow were measured just upstream (H1) and at 3D upstream of the specific opening, respectively.
A set of six 3D-printed inlet models were tested against a base model to investigate the effect of increasing the transition zone for a circular culvert. The base model is a preinstalled standard circular profile (diameter: 192mm), shown in Figure 3. The 3D printed inlet models were restricted to a height of 280 mm and a width of 450mm. Each model incorporated a smooth, venturilike shape, which is characterized by a rounding coefficient that defines the curvature. A larger coefficient results in a large, gradual curvature, whereas a smaller coefficient represents a sharper rounded inlet (adapted from Jaeger et al. 2019). This rounding coefficient is multiplied by the culvert diameter to determine the radius of curvature (R). The tested inlet curvatures included 1.0D, 0.7D, 0.5D, 0.35D, 0.25D, and 0.15D as displayed in Figure 4.
In order to examine the difference in hydraulic performance between a wall-integrated and a projected inlet, polystyrene was used as the wall material. After testing the projected inlets, polystyrene material was cut to shape and integrated around each inlet. To ensure proper integration, silicone sealant was used to bond the inlet to the polystyrene for each model. Silicone was applied with careful precision to ensure a smooth, flush bond. Both model configuration sets were tested under identical conditions to compare their hydraulic performance. Figures 5(a) and (b) display a projected model and Figure 5(c) a wall-integrated model for the 0.5D profile, which serves as an example for all the other models.
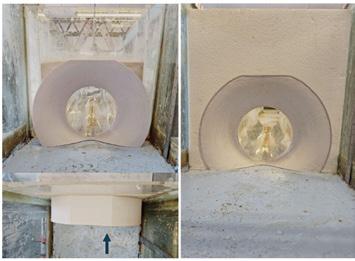
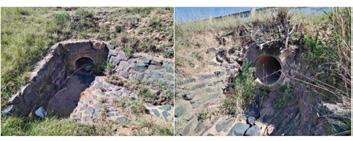
Case study: application and cost evaluation
The case study focused on a single-barrel pipe culvert located on the R396 between Tsolo and Maclear in the Eastern Cape. The culvert has a diameter of 600mm, a length of 15m and a slope of 0.0628m/m. The height from the culvert invert to the shoulder break point (SBP) is 1.11m. As seen in Figure 6, the general condition of the culvert is relatively good. There is no debris and almost no sedimentation, although some grass or weeds near the inlet may need to be cleared. Structurally, the culvert is in good condition.
The 1:10 year design flood was calculated as 0.657m3/s, and the 1:20 year design flood as 0.820m3/s. For culvert design, the headwater depth for the design flow rate QT is limited to 1.2D. For a flow rate of Q2T, the maximum allowable submergence is limited to the lesser of 2D or the height from the invert to the selected backwater profile (SBP). The culvert was analysed for the given flow rates and headwater depths to determine whether it was hydraulically sufficient or not in its original state and after the application of a rounded-edge inlet.
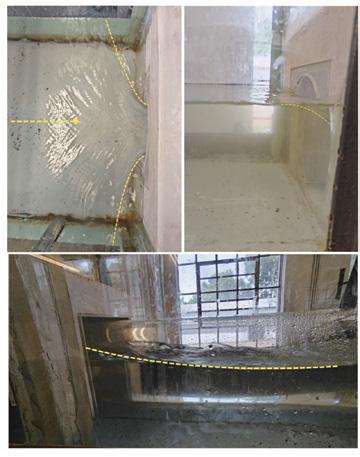
A cost estimation analysis was also conducted to compare the cost of adding a parallel 600mm diameter pipe culvert with that of only implementing inlet modifications. This enabled an assessment of the cost benefit of inlet improvements, which eliminate the need for excavation, backfilling, and the installation of a new culvert pipe.
Physical modelling results
The base model test is illustrated in Figure 7 . As the water enters the culvert, a contraction occurs (Figure 7(a)), and water dams up at the face of the culvert. A water level drop is observed at the entrance to the barrel (Figure 7(b)). This drop is attributed to the flow constriction occurring as the water moves from a wider cross-section to a narrower cross-sectional area. The contracted jet, as the flow separates from the inlet boundaries, is seen clearly on the downstream side of the culvert (Figure 7(c)). The visual results of the base model highlight the need to present a solution that reduces the effects of contraction losses at the entrance.
The results were evaluated by comparing rating curves for the base model with the wall-integrated models, and the projected model, respectively. The tests were first conducted by simply fixing the rounding to the culvert inlet to create projected inlet profiles (as shown in Figure 5(a)). The results for the different tested inlets are shown in Figure 8(a). Then, the tests were repeated with the wall built out to create a wallintegrated model (as shown in Figure 5(c)). The results for these tests are shown in Figure 8(b).
For both sets of results, the modified inlets plot to the right of the standard model. This indicates that the modified models achieve higher flow rates through the culvert at similar headwater depths, demonstrating improved hydraulic performance. The modified models have distinct trends for the flow transitions from unsubmerged to submerged conditions. Initially, all curves overlap and no major differences in flow are observed at headwater depths below 192mm (e.g. approximately at H1/D = 1). This suggests that the rounded inlet edge sizes have marginal effects on culvert performance under unsubmerged flow conditions. However, as flow increases beyond this threshold, the curves begin to diverge, indicating that the effects of the rounded inlet edge size become more significant under submerged flow conditions.
While all the modified inlets enhance the culvert’s performance, the 0.35D and 0.5D models demonstrate the highest efficiency. This is unexpected, as the 0.7D and 1.0D would be expected to be the topperforming inlet models (Jones et al. 2006). However, these models perform to the same standard as the 0.25D model. This indicates that a threshold is reached between the 0.35D and 0.5D models. Therefore, increasing the rounding coefficient beyond this point does not guarantee performance improvements. This suggests that an optimum point exists between 0.35D and 0.5D.

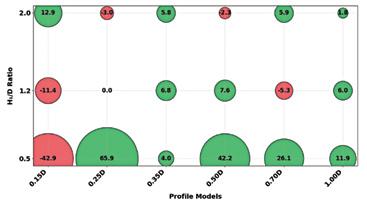
FIGURE 9: Percentage difference for each model under different H1/D ratios (red bubbles represent better performance in the wall-integrated inlet model; green bubbles represent better performance in the projected model, with bubble size depicting the magnitude of the difference)
To compare the performance of wall-integrated and projected inlet models, the percentage difference in flow improvement was calculated for each condition using the following formula:
Percentage difference = ×100 Projected Inlet - Wall integrated Inlet Wall integrated Inlet
This percentage reflects the relative performance of the two inlet conditions at a specific H1/D. A negative value indicates that the wallintegrated inlet model performed better than the projected model. A positive value indicates that the projected model had better performance. Figure 9 presents these values in a bubble plot. The red bubbles represent better performance in the wall-integrated inlet model. The green bubbles represent better performance in the projected model. The size of each bubble corresponds to the magnitude of the performance difference. The inlet profiles are displayed along the horizontal axis, and the H1/D is plotted on the vertical axis, allowing for a clear comparison of which inlet condition (wall-integrated or projected) performs better for at specific headwater depths.
Analysis of the data shows that under low headwater depths (H1/D = 0.5), projected inlets generally outperform wall-integrated inlets. An exception is made for the 0.15D, where the wall-integrated condition performs better. At H1/D = 1.2, the performance differences are small, within ±10%, with no consistent advantage for either inlet condition across all profiles. This suggests that either inlet condition may be acceptable at this depth. At higher levels of submergence, the performance differences become
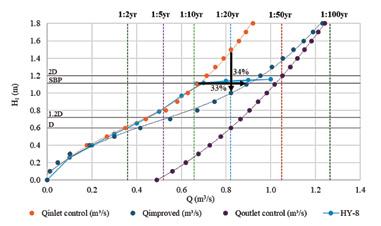
FIGURE 10: Case study pipe culvert performance curve analysis under both inlet and outlet control as well as with a modified inlet and comparison to HY-8
less significant, with differences within ±6% for most profiles. As with the H1/D = 1.2 condition, this indicates that either inlet condition may be acceptable under fully submerged conditions. This suggests that the inlet condition has a limited impact on flow improvement through the culvert, particularly under submerged conditions.
Since rounded-edge inlets have such a significant effect, their influence when applied in practice was evaluated.
The 600mm diameter pipe culvert’s discharge capacity was evaluated for headwater depths of 1.2D, 2D, and the height up to the SBP. The corresponding flow rates are summarised in Table 1 to determine whether the culvert is hydraulically sufficient for the design floods. The analysis indicates that the culvert is hydraulically insufficient under current conditions but becomes sufficient at headwater depths of 2D and up to the SBP once inlet improvements are applied. These headwater depths are particularly important, especially the headwater depth up to the SBP, as they define the threshold at which overtopping of the road occurs. Figure 10 illustrates that the culvert functions under inlet control. It also presents the performance curve for the current culvert, validated against results from HY-8 software (FHWA 2016). When the same culvert is retrofitted with a projected rounded edge inlet, a noticeable flow increase is observed. For the 1:20 year flood, a 34% (500mm) reduction in headwater is observed, or alternatively, a 33% (0.221m3/s) increase in discharge is observed at a headwater depth equal to the height from the invert to the SBP.
1: Case study culvert analysis for headwater depths of 1.2 D, 2 D, and the height up to the
The reduction in headwater depth for each return period from Q2 to Q100 is presented in Table 2. At a return period of 1:100 years, the headwater depth upstream of the culvert is reduced by 1.25m, which lowers the water level on the road, as overtopping already occurs under those conditions. For a design flood of Q20, a reduction in headwater depth of 0.5 m may be sufficient to prevent overtopping entirely.
The cost of adding an additional 600mm culvert barrel, for this specific case study, is estimated at R190 000, as shown in Table 3. This includes excavation, materials, backfilling, and labour. In comparison, the cost of retrofitting the existing culvert with an improved inlet is approximately R56 150, as shown in Table 4. This estimate accounts for the cost of moulds, concrete, reinforcement, and assumes partial demolition and reconstruction of the existing inlet structures.
When implemented, additional traffic accommodation costs must also be considered, as they are dependent on the culvert’s location and surrounding road conditions. Full culvert upgrades normally occur during halfwidth road construction with closures of up to 4 km in length under normal traffic accommodation conditions. In contrast, inlet modifications are expected to require only road shoulder traffic accommodation, such as signage and delineators, allowing two-way traffic to continue with minimal disruption.
TABLE 3: Cost estimation of adding an additional 600 mm culvert barrel
ITEM No Amount excl.VAT 1 CULVERTS
1.1 Excavation for culvert structures R 5 650
1.2 Backfilling R 109 350
1.3 Concrete pipe culvert (15 m) R 18 850
1.4 Cast in situ concrete and formwork R 38 800
1.5 Reinforcement R 14 600
1.6 Demolition of concrete members or elements R 2 600
1.7 Compaction of bedding for inlets, outlets, manholes and catchpits R 150
TOTAL R 190 000
TABLE 4: Cost estimation of retrofitting inlet modifications to the 600 mm culvert barrel ITEM No
excl. VAT 1 CULVERTS
1.4 Cast in situ concrete and formwork or modified inlet moulds R 38 800
1.5 Reinforcement R 14 600
1.6 Demolition of concrete members or elements R 2 600
1.7 Compaction of bedding for inlets, outlets, manholes and catchpits R 150
TOTAL R 56 150
Applying inlet modifications to this hydraulically insufficient culvert resulted in a cost saving of up to 70% compared to the estimated cost of rebuilding the structure to add an additional barrel.
CONCLUSIONS AND RECOMMENDATIONS
This study evaluated different sizes of rounded edge inlets modifications for circular culverts. Previous findings have shown that rounded culvert inlets have a greater impact on the capacity of circular culverts than other retrofit improvements, such as wingwalls and headwalls. Therefore, rounded culvert improvements were further investigated to find an optimal inlet rounding curve of 35% of the culvert diameter. It was shown that projected models produce similar improvement to wall-integrated models, while requiring less material for construction and installation. In practice, inlet modifications can be applied in one of two ways: by attaching a precast concrete mould to the existing culvert inlet (i.e., projected), or by casting a new front wall with the modification integrated into the structure.
The cost analysis showed that up to 70% in cost savings could be achieved by using culvert inlet improvements instead of installing additional culvert barrels. These relatively simple inlet modifications therefore offer a sustainable solution for adapting to increased flood risks caused by climate change and urbanisation.
Further research is recommended to evaluate the performance of inlet modifications under conditions involving debris and sediment accumulation, as these reflect more realistic field scenarios and influence hydraulic efficiency. In addition, it is recommended that the practical implementation of inlet improvements in the field be assessed, with consideration given to constructability and integration with existing infrastructure. Lastly, the development of new design guidelines, or the revision of existing ones, such as SANRAL 2013, is recommended to formally incorporate inlet modifications. This should include the introduction of a flow improvement coefficient that can be used in culvert design calculations to quantify the increase in capacity.
Alexander, W. J. R. (1995) Floods, droughts and climate change. South African Journal of Science, 91 (8). https://hdl.handle.net/10520/ AJA00382353_6774
Cullis, J., Alton, T., Arndt, C., Cartwright, A., Chang, A., Gabriel, S., Gebretsadik, Y., Hartley, F., Jager, G. d., Makrelov, K., Robertson, G., Schlosser, C. A., Strzepek, K. & Thurlow, J. (2015) An uncertainty approach to modelling climate change risk in South Africa World Institute for Development Economics Research.
Federal Highway Administration, FHWA. (2016) HY-8 User Manual (v7.5).
Jaeger, R., Tondera, K., Pather, S., Porter, M., Jacobs, C. & Tindale, N. (2019) Flow Control in Culverts: A Performance Comparison between Inlet and Outlet Control. Water, 11 (7). https://doi.org/10.3390/w11071408.
Jones, J. S., Kerenyi, K. & Stein, S. (2006) Effects of Inlet Geometry on Hydraulic Performance of Box Culverts. Springfield, VA.
McBride, C. M., Kruger, A. C. & Dyson, L. (2022) Changes in extreme daily rainfall characteristics in South Africa: 1921–2020. Weather and Climate Extremes, 38. https://doi.org/10.1016/j.wace.2022.100517
Namanyane, J. (2019) Characterization of culverts failure on SANRAL roads (R72 AND N2). Magister Philosophiae, University of Johannesburg. South African National Roads Agency SOC Limited, SANRAL. (2013) The South African National Roads Agency SOC Limited Drainage Manual, Pretoria.
Schall, J. D., Thompson, P. L., Zerges, S. M., Kilgore, R. T. & Morris, J. L. (2012) Hydraulic Design of Highway Culverts Third Edition, Hydraulic Design Series Number 5.Colorado. FHWA-HIF-12-026.
Wasko, C., Nathan, R., Stein, L. & O’Shea, D. (2021) Evidence of shorter more extreme rainfalls and increased flood variability under climate change. Journal of Hydrology, 603. https://doi.org/10.1016/j.jhydrol.2021.126994
Frankie A’Bear, Pr Eng A’Bear Consulting
Led by the Grootvadersbosch Conservancy and funded by the Nedbank Green Fund in partnership with WWF, the Barrydale Water System project is a collaborative initiative designed to enhance water security, operational efficiency, and long-term resilience in the small town of Barrydale, located in the Swellendam Municipality, Western Cape. Barrydale is representative of many South African towns that face the dual challenge of ageing infrastructure and limited technical capacity to manage increasingly variable water supply and demand conditions. The project aims to address these constraints through a multi-stakeholder process that integrates community knowledge, municipal operations, and technical innovation. At the centre of the intervention was developing and implementing a locally appropriate water monitoring system. This system was designed to generate near real-time data on river and diversion structure water levels and flows, and estimated usage across the town’s water network. The solution leverages low-cost sensors, remote telemetry, and a user-friendly dashboard that allows municipal staff to make timely, informed decisions regarding water distribution and allocation. The system was co-developed with input from Swellendam Municipality, ensuring its usability and sustainability beyond the life of the project. A key strength of the Barrydale project was its inclusive approach to stakeholder engagement. The project team worked closely with local government, civil society, and residents through structured workshops and one-on-one engagements. This process helped build trust, uncover operational bottlenecks, and prioritise context-specific interventions.
By embedding real-time data collection into the town’s operations, the Barrydale Water Monitoring System offers a replicable model for data-driven water management in small towns across South Africa. The project is set to demonstrate that targeted technical support, when paired with meaningful stakeholder participation, can unlock institutional momentum and generate practical solutions for long-standing service delivery challenges. The outcomes contribute not only to improved system functionality but also to a growing evidence base on scalable, cost-effective approaches for managing rural and small-town water systems in data-scarce contexts.
Barrydale is a town in the Swellendam Municipality, with an estimated 2023 population of 6,183 which is expected to grow to 7,212 by 2030 (Swellendam Municipality 2020). It is situated in the Langeberg Strategic Water Source Area and relies on the Huis River to meet its water requirements for municipal, domestic irrigation and agricultural use (Swellendam Municipality 2022). The town is surrounded by five commercial farms and a number of small-scale farmers who depend on this river as their primary water source. However, the river has been over-allocated and often runs dry during summer; according to the 2010 Reconciliation Strategy for Barrydale, the safe yield of the Huis River is 0.227 million m³/a while the estimated water demand is 0.333 million m³/a by 2020 under a low growth scenario (Umvoto 2010).

Water allocation from the Huis River must support not only the town’s domestic and agricultural needs but also maintain flows for ecological resilience, most critically, to support the survival of the Barrydale Redfin (Pseudobarbus burchelli) (Zutari 2023b). This small, orange-finned freshwater fish, shown in Figure 1, is listed as Critically Endangered on the International Union for Conservation of Nature (IUCN) Red List and is endemic to the Huis and Tradouw Rivers. The species faces existential threats from habitat degradation, poor water quality, invasive species, and reduced flows caused by human abstraction. In 2023, a Framework Plan for Water Security was initiated by the Western Cape Department of Environmental Affairs & Development Planning to identify interventions to improve the water security of Barrydale and thereby protect the habitat of the Redfin (Zutari 2023a).
In response to these water challenges and building on the recommendations of previous work in the catchment, the Grootvadersbosch Conservancy (GVBC), under the leadership of General Manager Aileen Anderson, has initiated a collaborative project to protect the Redfin and manage the river sustainably. Supported by local partners including the Swellendam Municipality, Cape Nature, Gouritz Cluster Biosphere Reserve, and Breed-Olifants Catchment Management Agency, the project aims to improve the base flow of the Huis River and arrest the ecological decline in the Huis River system, which threatens the survival of the Barrydale Redfin. Its conservation is vital not only for biodiversity but also for the ecological integrity of the river system upon which the town relies.
The component of the project presented in this paper contributes to the project goal of improving the base flow of the river. Recognising the role unquantified water abstraction plays in reducing river base flows, it aims to implement a water monitoring system to supply real-time data to a newly developed Water Balance Tool (WBT). The monitoring data collected and analysed will help inform the operating rules for the water system, optimised to maximize base flow while still allowing equitable allocation between urban, agricultural and ecological needs. This balance is particularly
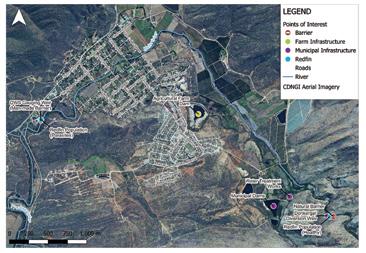
important to achieve as water scarcity intensifies under future climate change. This work was funded by the World Wildlife Fund (WWF) Nedbank Green Trust.
The monitoring system paired with the WBT is a proactive and practical response to water supply insecurity. By enabling evidence-based water allocation decisions and supporting the adoption of operating best practices, the project aims to build long-term water resilience for Barrydale and the Huis River and offer a replicable model for other small towns and catchments across South Africa.
The overarching project aims to secure the water supply in the Huis River, ultimately to protect the habitat of the Barrydale Redfin. This minnow is closely related to the Breede River Redfin, though its habitat is restricted to the Tradouw and Huis Rivers. Monitoring in recent years shows that the population in Tradouw River has declined. While the Huis River remains safe from predatory invasive fish species, the habitat is under threat from over abstraction, poor water quality and habitat degradation and loss.
Figure 2 shows the Huis River; the remaining 6km habitat of the Redfin, flowing through small-scale and commercial farms and the Barrydale town centre.
To address increasing water insecurity, the two encompassing goals of the overarching project are to improve the base flow of the Huis River to meet the ecological flow requirements, and to improve the water quality. Due to the co-dependence of the urban, agricultural and ecological environments on the Huis River, the project includes the following activities: clearing invasive alien plants, restoring riparian areas, constructing a polishing wetland, investigating options for small-scale farm irrigation, improving the mechanism of supply to the commercial farmers and improving the operation of the water supply canal system to minimise diversions. The last activity is the focus of this paper and requires several stages of work to quantify, analyse and propose operating rules for the diversion canals.
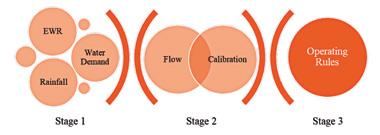
There are three stages to this project activity. The first and second stages involve data collection and run in parallel, however, the third stage is dependent on sufficient data collection and analysis conducted during the first two stages.
The first stage is to set up the preliminary version of the Water Balance Tool, an Excel-based programme originally conceptualised by Bruce Paxton and further developed in partnership with Gerald Howard for the Kouebokkeveld Water User Association and adapted for Barrydale. This involves calculating the rainfall for the catchment, the Environmental Water Requirement (EWR) for the river and the water demands from the urban, domestic irrigation and agricultural users.
The second stage is calibrating the WBT using observed data. Water level sensors were installed on 19 June 2025 in three key locations, allowing continuous flow measurements through rating curves developed by in-field measurements and a hydraulic model. This data is used to model the existing water diversion volume and allocation to the user groups.
The third stage is working alongside Swellendam Municipality and local water users to co-develop operating rules. The WBT will be used to evaluate the catchment response to future allocation options under different demand patterns and climate scenarios. The analysis will be iterated until best practices for the operation of the system can be established. These guidelines aim to improve water allocation decisions, promote transparency, and help to proactively address seasonal water shortages.
A collaborative, capacity-building approach underpins all components. By upskilling local stakeholders and supporting effective engagement, the project lays the foundation for more sustainable water management in the future. While the findings and operating rules will not have legal status, they are intended to drive practical improvements toward a water-secure Barrydale.
Note: Progress will continue to be made and will be included at the IMESA Conference in October 2025, allowing for the sharing of key findings and lessons learned from this ongoing work.
The WBT is in its second iteration of development. It was conceptualised by Bruce Paxton of the Freshwater Resource Centre to assist farmers in their operation of their water schemes, particularly in dry seasons, where the farmer at the downstream end of the river typically experiences a worse water shortage than the upstream neighbours. The tool is being adapted for Barrydale to include urban and domestic irrigation as water users. The WBT configuration includes the network routing, hydrological fragmentation of the catchment, the farm specifications, and intra-system transfer information. It breaks down monthly data to a series of daily inputs, which allows multiple use-cases, e.g. operating rules, weekly planning, future planning for water user expansion, EWR enforcement and may potentially include water use license allocation and enforcement.
For Barrydale, the WBT was configured to represent the existing water supply network represented in Figure 4. An HDPE-lined canal diverts water from the Huis River at the Donkergat weir. The weir has a 100mm pipe positioned lower than the canal invert level, intended to maintain the EWR in the river. See Figure 5a and b. The canal continues along the contours of the western side of the valley until it splits to supply the municipality and the commercial farmers.
At present, the supply directed to the commercial farmers spills down the mountainside back into the river, where it is captured by an earth channel crossing the river and directing into an earth canal on the eastern side of
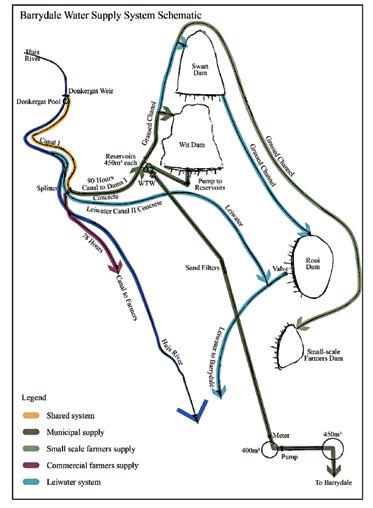
the valley. The municipal canal continues to two 450kl concrete reservoirs above the water treatment works (WTW), and thereafter is a grassed channel supplying, in order, the Wit, Swart, Rooi and Small-scale Farmers dams. The WTW can source raw water from either the concrete reservoirs or the Wit Dam. Typically, water is supplied from Wit Dam to stabilise incoming water quality for treatment. The Swellendam Municipality aims to always keep the Wit Dam at full capacity; therefore, the water levels tend to only drop during the dry season in times of significant water stress. The Swart Dam is an overflow dam, which, if full, spills into a grassed channel to direct water
to the Rooi Dam. The Rooi Dam is the supply for the leiwater system, a legacy canal network, used to supply erfs within the town centre with domestic irrigation water. The Small-scale Farmers Dam is supplied by a grassed channel capturing runoff from a small catchment above the Swart Dam, as well as any remaining water from the municipal channel. Small-scale farmers manually transport the water from Rooi Dam to their farms.
The canals and channels are controlled by sluice gates, which are opened and closed based on schedules, rotating supply among the users. There is one sluice at the Donkergat weir, controlling the total amount of water diverted from the Huis River. Two sluices at the canal split control the division of supply between the commercial farmers and the municipal, domestic irrigation (leiwater) and small-scale farmers. The leiwater network operates on a similar principle, where each erf on the network is allocated 30 minutes with their sluices open, directing water onto their property.
It should be noted that the sluice gates at the Donkergat weir and on the municipal canal are unable to shift position. The spindle on the Donkergat weir is bent rendering the wheel inoperable and the spindle for the municipal canal has been stolen, leaving both gates permanently wedged partially open. This means water is permanently diverted from the Huis River, and the sluice opening at Donkergat weir, when fully submerged, acts as a control structure for water entering the canal. The sluice gate to the municipality is occasionally blocked by sandbags when the timeslot for the commercial farmers is active; however, there is still flow in the canal. If fully submerged, the sluice again acts as a control structure for both the upstream and downstream sections of the canal.
To understand the hydrological behaviour of the catchment, the first task was to split the catchment into sub-catchments which align with the water users, e.g. a commercial farm boundary (agricultural demand) or the urban edge (municipal demand). A rainfall-runoff model was developed in WRSM-Pitman to determine the naturalised flows and the appropriate fragmentation of rainfall across the sub-catchments. The daily rainfall inputs can be sourced from the WRSM-Pitman model, Climate Hazards Group InfraRed Precipitation with Station data (CHIRPS), a rainfall station in the catchment and can include precipitation forecasts. Fragmenting the rainfall per sub-catchment can be done in three ways within the WBT. The first is through apportionment according to area of the sub-catchment, e.g. Subcatchment A has 30% of the total catchment area, therefore receives 30% of the rainfall. In some cases, this is applicable; however, in Barrydale, the mountainous area receives more than the areas method would attribute to them and therefore contributes more flow. Therefore, the second method
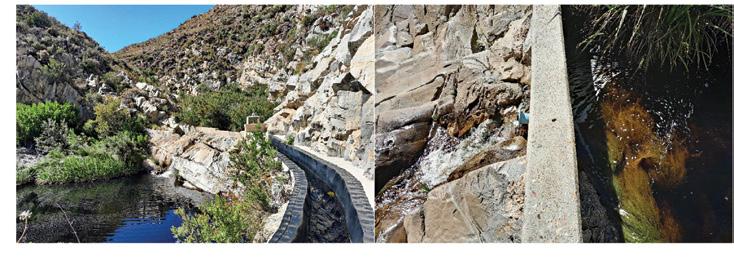
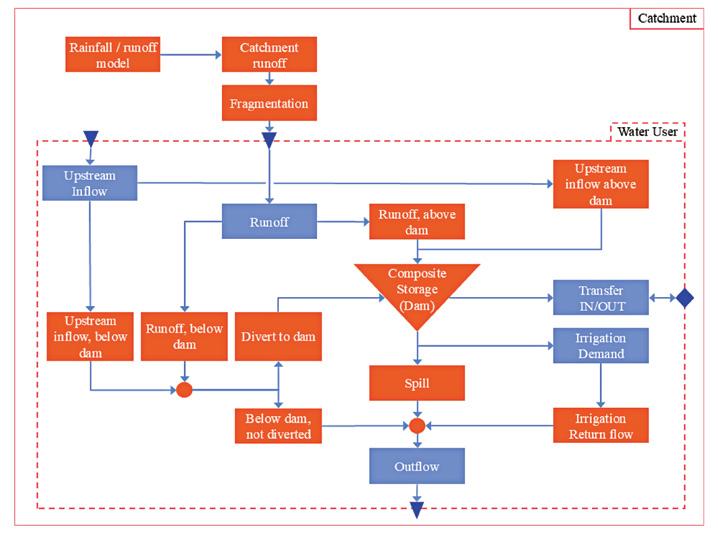
is used, as the WBT allows the sub-catchments to be split into high and low rainfall zones based on the WRSM-Pitman model outputs for each subcatchment. The third method is a manual override, which a hydrologist can use their expertise to inform, using the WRSM-Pitman outputs as an informing parameter.
The next input is to determine the water demands placed on the Huis River. As the WTW pumps into storage reservoirs, the urban water demand fluctuation is not translated back to river diversion volumes; therefore, the treated volume recorded by the WTW has a direct influence on the water within the Huis River. Urban demand data, in this case, the volume treated by the WTW, was provided by the Barrydale Municipal Manager. The leiwater system operates through gravity, and a valve at the base of the Rooi Dam controls supply into this canal network; though the network serves a number of erfs within the town, the demand was modelled as a single user to simplify model inputs. Commercial and small-scale farmers were modelled separately, though the principle for determining their irrigation demands is the same. The crop type information was initially sourced from Cape Farm Mapper and verified through discussions with the farmers. The crops are listed in the WBT and assigned crop factors and evaporation values, determined from the ACRU Agrohydrological Model Manual and WR2012 A-pan evaporation data. The irrigation demand per farm is estimated by the formula: Sum of crops (Crop Factor x A-pan Evaporation - Effective Precipitation (Rainfall x Rainfall Conversion Factor)). The configuration for a water user is summarised in the schematic in Figure 6.
The next input is the monthly Gazetted EWR for the catchment which, like rainfall, must be fragmented back to each user. This process avoids unnecessarily penalising users whose catchments receive low rainfall and therefore contribute comparatively lower flows than the users whose catchments receive high rainfall. It is also possible to enter what is called a pragmatic EWR, which is manually set and should be informed by an experienced ecologist who has studied the catchment area.
The final input to the WBT is the transfers between users in the system. However, in Barrydale, there are no internal transfers between the users.
The water monitoring system was designed to provide continuous, sitespecific flow data at key points along the Barrydale water network. The aim was to establish a reliable and low-cost solution that would support calibration of the Water Balance Tool and provide operational data for informed decision-making.
The output of the water balance tool is a series of flows. This includes flows for the total catchment as well as per sub-catchment, which correlates to the water demands per user. To ensure that the outputs are based in reality, the model must be calibrated. Therefore, a water monitoring system was designed for the Barrydale system. A gauging station operated and maintained by the Department of Water and Sanitation (DWS) is the downstream end of the water system for the Huis River, measuring the river flow after all abstractions.
Three water level sensors were installed at strategic points in the system: at the Donkergat weir (upstream of the diversion point), before the canal split (to measure total diverted flow) and after the canal split (to measure the amount of water diverted to the municipality, domestic irrigation and the small-scale farmers. Using the collected measurements, it is possible to calculate the flows for the commercial farmers in the system as well as the flow left for the environment. The level sensors were set up to take measurements every 30 minutes to be sent through to a hosting platform, which displays the near-real-time data. These were chosen for their proven reliability in small rural systems and their compatibility with lowmaintenance setups. Each sensor was installed in tamper-proof brackets to minimise the possibility of theft or damage. This hosting platform enables the visualisation of river diversion and system flows.
Water depth is measured rather than flow, so it is necessary to convert depth readings into flow rates. Although hydraulic calculations could be used for this conversion, the specific operational conditions of the existing system and the financial limitations, particularly the infeasibility of installing flow-measuring flumes, made this approach impractical. Additionally, the canal system does not operate entirely under gravity. Therefore, it was necessary to conduct in-field measurements using a velocity meter to support the development of accurate rating curves. The procedure used to take the in-field measurements is based on the U.S. Geological Survey areavelocity streamflow measurement protocol. These measurements will be used to develop a rating curve for each monitoring location. The instruments were installed on 18 June 2025, and the rating curves will be developed and refined throughout the project. It should be noted that high flows are difficult to accurately quantify as the water levels become unsafe for in-field measurement, and the cross-section of flow overtopping the weir extends into vegetation and the uneven rock sides, resulting in very turbulent flow and unreliable depth measurements.
The observed flows are the calibration and verification inputs for the WBT. The WBT calculates the flow by using Equation 1, an empirical formula commonly used in hydrology to convert rainfall to runoff irrespective of catchment size and where the relationship is not strictly linear due to catchment characteristic, antecedent moisture, or non-uniform rainfall distribution.
Equation 1: Empirical equation to convert rainfall to runoff irrespective of catchment size
Flow = a × Rainb × Season Factor
The flows are calibrated by varying the a, b, and season factors as well as the depth of the rainfall above which runoff is assumed to be generated. There are limitations to the accuracy of the outputs, chiefly associated with the hydrological modelling, the input parameters and the measurements used for calibration. As the data builds over time, it supports refinement of the WBT and provides a foundation for data-informed water management decisions.
The operating rules and guidelines for the Barrydale water system will be developed through an iterative and collaborative process. These rules aim to support more equitable and efficient allocation of the limited water resources across urban, agricultural, and ecological needs.
The WBT will simulate allocation scenarios based on current and projected conditions. It will provide a basis for identifying key operating thresholds and setting priorities under different water availability levels. For example, the sluice gate at Donkergat weir can be managed to maintain a base flow in
the Huis River during low-flow periods before allowing further abstraction for water users. Alternatively, during a particularly wet season, the sluice opening at Donkergat weir may be adjusted based on forecasted rainfall to ensure that ecological flow is maximised while ensuring sufficient water is diverted to fill storage dams in the network.
Similarly, guidelines will be developed to prioritise supply to the urban network during periods of water stress while maintaining a minimum allocation for agricultural users and ecological flows. The approach is guided by a “share the pain” philosophy, which recognises that during periods of water scarcity, all users must proportionally reduce demand to sustain the system as a whole.
The WBT will be used to test different allocation scenarios, including dry-season rotations and surplus-sharing mechanisms. The rules are designed to be practical rather than prescriptive. The process includes workshops with municipal staff and water users to interpret monitoring data, understand model outputs, and refine rules based on experience and operational feasibility. The operating rules are not legally binding but serve as a practical framework to support equitable, transparent, and adaptive water management intended to guide local decision-making and foster mutual accountability. The guidelines will continue to evolve as more data becomes available and as stakeholders engage further.
The Barrydale Water Security project is currently in its early implementation phase, focusing on data collection and calibration of the WBT. As the project progresses into the third stage, the WBT will be used to simulate allocation scenarios and support the co-development of operating rules. These rules aim to improve transparency and guide the management of the system under average, low-flow and high-flow conditions.
Beyond rule-setting, the tool provides a means to test the potential benefits of various infrastructure and operational improvements. For instance, it can model the effect of fully functional sluice gates or alternative water supply mechanisms to commercial and small-scale farmers. These simulations will allow the project team and the Swellendam Municipality to identify and prioritise infrastructure upgrades that offer the greatest improvement in water security for all users, urban, agricultural, and ecological alike.
A key lesson emerging from this work is that the quality of the input data significantly influences the value of the modelling outputs—’rubbish in, rubbish out’ applies. Ongoing calibration and reliable monitoring are essential for meaningful results and sound decision-making. Establishing rating curves, verifying abstraction volumes, and continuously refining the inputs will determine the usefulness of the WBT in practice.
Equally important is the collaborative process underpinning the development of the operating rules. Since the WBT is not being used for compliance or enforcement, but rather to guide shared understanding and adaptive decision-making, the success of the tool depends on trust among stakeholders. Transparent engagement, capacity building, and coownership of the process are essential to ensure that users see value in the tool and are willing to act on its guidance.
The Barrydale Water Monitoring System and Water Balance Tool provide a practical example of how low-cost, site-specific data collection and collaborative modelling can strengthen water security in small towns. These tools allow stakeholders to visualise the impact of different water use patterns, test management interventions, and make informed, transparent decisions about allocation.
While the WBT is still in its early stages, its successful deployment shows that meaningful improvements are possible with the right partnerships and technical support. Data quality and stakeholder trust emerged as key ingredients for success. Accurate and continuous monitoring ensures reliable calibrated model outputs, while inclusive engagement helps foster ownership of the resulting guidelines and decisions.
The Barrydale project demonstrates that proactive investment in monitoring, modelling, and local collaboration can lead to more resilient and equitable water systems. Its lessons are widely applicable to other data-scarce and institutionally constrained catchments across South Africa.
The refinement of the Barrydale WBT is ongoing and will continue under the WWF Nedbank Green Trust project. As additional flow and abstraction data are collected, the model will be iteratively improved to better represent the functioning of the catchment and the water supply system. These refinements are critical to strengthening the reliability of scenario testing and informing the development of context-specific operating guidelines.
To increase the accessibility and long-term sustainability of the WBT, funding will be sought to develop a web-based version of the tool. Transitioning from a spreadsheet model to an interactive web application would allow for real-time data integration and broaden access to users beyond the project team, including municipal operators and water users.
Future iterations of the WBT are going to be aligned with the DWS WR2012 quaternary catchment natural flow estimates to ensure consistency with national hydrological baselines. This alignment will support confidence in the model outputs and strengthen its utility for operational and strategic planning, water use license approval and enforcements, and EWR compliance enforcement.
As the project progresses, attention should be paid to maintaining high data quality through regular calibration of monitoring equipment and verification of diversion measurements. This is essential for ensuring that model outputs remain fit for purpose.
Lastly, lessons from Barrydale should be shared across the sector to inform similar initiatives in other data-scarce and over-allocated catchments. The approach, centred on participatory development and practical tools, provides a replicable model for collaborative water management in rural South African towns.
REFERENCES
Marais, Jacques. 2023. ‘Picture of Barrydale Redfin’. https://www.gvbconservancy.co.za/conservancyblog/protecting-thetradouw-redfin-a-community-effort-in-barrydale
Swellendam Municipality. 2020. Swellendam Spatial Development Framework. Swellendam.
Swellendam Municipality. 2022. Draft 5-Year Integrated Development Plan for 2022-2027. Swellendam.
Umvoto. 2010. Reconciliation Strategy for Barrydale. Department of Water Affairs (now Department of Water and Sanitation), Cape Town.
Zutari. 2023a. Framework Plan for Future Investment in Support of Water Security in the Huis River Catchment. Department of Environmental Affairs & Development Planning, Cape Town.
Zutari. 2023b. Huis River Catchment Characterisation Report - Framework Plan for Future Investment in Support of Water Security in the Huis River Catchment. Western Cape Department of Environmental Affairs and Development Planning, Cape Town.
¹M. Braune, ² Munya Rupende
¹
Pr Eng. MIMESA, MSAICE, Director, Bio Engineering Africa (Pty) Ltd
1Engineer,
Bio Engineering Africa Consulting (Pty) Ltd
2Engineering
Technologist, BMK Group
1. ABSTRACT
The current urban environment is rapidly changing due to more highdensity developments within municipal areas. Additional climatic changes and sporadic, more intense storm events have caused widespread flooding, damage to property and loss of life both locally and internationally. Combined with financial constraints this increases the pressure on municipalities to be more proactive in both preventing and improving stormwater drainage systems to become more resilient to climatic changes.
Several urban flood management and Stormwater Master Plans have been completed for various municipalities over the past few years. The studies involved the hydraulic as well as condition assessment of existing urban drainage systems consisting of box culverts, pipe culverts, kerb inlets and grid inlets. On completion of the existing hydraulic and condition assessments, hydrological models were set up to determine required design flows. Based on the design flows in comparison to the hydraulic capacity. Stormwater upgrading measures were determined and designed. Due to budget constraints upgrading measures needed to be prioritised and phased budget programs set up. One of the main findings was that the several underground drainage networks are under capacity mainly because of higher expected peak flows due to Climate change.
More importantly it was found that kerb inlets and inlet structures are of the incorrect type and often incorrectly sized to drain the excess stormwater from roads thereby already causing flooding. A further observation was that a large percentage of stormwater control structures are either blocked or damaged thereby aggravating the situation.
This paper presents findings of the Master Plan studies and gives guidance on how better to manage and be more resilient regarding the control of stormwater, considering climatic changes by setting up proactive maintenance schedules as well as prioritisation algorithms for forward planning of required upgrading measures.
It has been observed over the past few years and in particular the rainy season of 2021/22 that weather patterns have changed which cause more sporadic and more intense rainfall events within South Africa as well as other continents. In view of this stormwater drainage systems have become more important to drain excess stormwater and to prevent flooding and damage to property.
A shortcoming often encountered when planning urban developments is the lack of attention given to the drainage of stormwater once the development has been completed. A further shortcoming is defining upstream future urbanisation which causes an increase in stormwater
runoff along both natural as well as artificial drainage systems. This in turn causes an increase in the flood levels and hence a higher flood risk.
It is of utmost importance to first carry out an integrated stormwater master plan (SWMP).
This is essential and gives a municipality the following important information:
• An As-built inventory of the existing drainage network structures.
• Information of the status quo regarding broken, blocked and/or functional drainage network structures.
• Information on the hydraulic assessment and capacity of the existing drainage network structures.
• Expected drainage network peak flow rates during storm events.
• Required shortcoming and upgrading measures of the existing drainage network capacity.
• Required maintenance activities such as cleaning and/or repairs needed to the existing drainage studies.
• Additional required drainage networks needed in areas having insufficient and/or non-existing drainage network.
• Capital budget estimates for both maintenance and well as stormwater drainage networks upgrading requirements.
A typical urban stormwater drainage network and layout is shown graphically in on Figure 1.
A brief description and functions of the various drainage network control structures as well as findings from field inspections is given below.
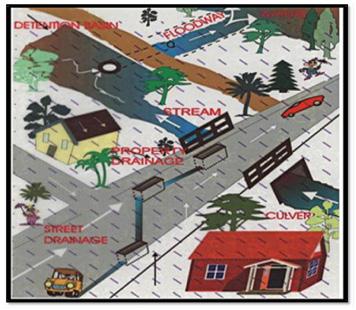

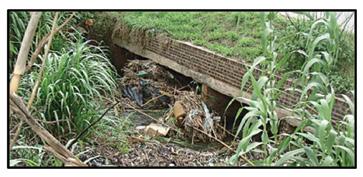
conditions
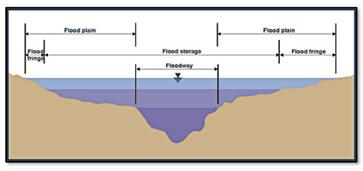
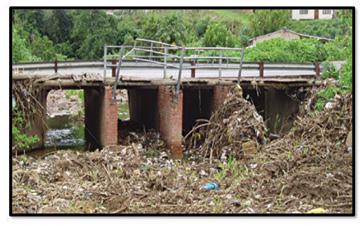
3.1.1 Minor Drainage System
The minor drainage system consists primarily of kerb inlets, grid inlets and artificial below and/or above ground drainage networks. The main function of this system is to drain the roads and runoff from adjacent properties from stormwater runoff emanating from usually a 2–5-year storm event. This drainage system is of upmost importance to prevent excessive road overflows which then cause both flooding of the road and adjacent developments as well as creates a safety hazard to road traffic. Typical observed conditions of these structures are shown in Figure 2.
3.1.2 Major Drainage system
The major drainage system collects all the stormwater runoff from the minor
drainage system and discharges the combined runoff into either larger underground culvert structures and/or into natural urban watercourses This drainage system usually caters for large storm events ranging from a 10-year to a 100-year storm event depending on the nature of the urban developments as well as size and predicted peak flow rates. Typical major drainage systems are shown in Figure 3.
3.1.3 Main rivers and flood ways
Urban major drainage systems typically drain into main rivers and their tributaries which now cater for the combined flows of all the major urban drainage systems including an entire river catchment. The main rivers consist of a floodway section catering for typical a 5-year to 10-year flood event and the floodplains section typically handling a 100-year or higher flood event. A profile of a typical river is shown on Figure 4.
Typical conditions of some of our urban rivers are shown in Figure 5.
3.1.4 Summary of findings and shortcoming
• On average 80% to 85% of the minor drainage systems are blocked and /or broken causing an excess flow on roads which then floods adjacent developments.
• Several major culverts and bridges are blocked due to debris significantly reducing the hydraulic capacity thereby causing road overflows and damages to the bridge and road infrastructure.
• Existing watercourses are often eroded causing bank instability and safety hazards.
4. CLIMATE CHANGE OVERVIEW AND IMPACT
Several climate change and impact studies have been carried out on a global basis. These studies are mostly based on historical rainfall records. The General Circulation Models (GCMs) are then used to do climate change predictions based on expected changes in temperate, cloud formation and pressure variations. At this stage is generally agreed that storm rainfall would increase on average by 15%.
In order to cater for this several Municipalities, require that the storm rainfall used in deterministic hydrological models be increase by 15% thereby obtained more conservative design flows.
5. PROCATIVE MAINTENANCE ACTIVITIES PLANNING FOR IMPROVED AND MORE RESILIENT STORMWATER CONTROL
Considering that 80% to 85% of mainly kerb inlets and manholes are blocked proactive and planned maintenance needs to be carried out. This however does not take place due to mainly budget and resource constraints at Municipal depots.
Considering this a proactive and prioritised maintenance approach using algorithms has been developed to assist a municipality in prioritising the locality of maintenance activities based on a drainage blockage potential and flood risk.
In this way limited funds and resources could be used to address high risk areas thereby reducing the potential of flooding. It has been established from previous projects and maintenance activities that between 15% to 20% of a roads and stormwater budget should be set aside for annual stormwater drainage networks maintenance activities.
A possibility to obtain assistance with maintenance funding could be to approach CoGTA and National Treasury to make available a grant funding mechanism to improve and assist with urgently needed maintenance activities. This could provide a long-term job creation as well as education benefits and opportunities for local residents to assist a municipality in proactive maintenance.
TABLE 1: Prioritisation indicators and weighting
1
2 Member gradient
3 Flow velocity
4
5 Development
In addition to the above benefit this initiate would also significantly reduce the damage to infrastructure and potential liability claims against a Council emanating from flooding due to the lack of maintenance.
5.1 Prioritised stormwater maintenance program and budgeting
The prioritisation algorithm is based on input parameters as summarised in Table 1.
Having defined the above indicators and weighting the blockage potential for a drainage network member, which is a numeric indicator of the expected blockage potential can be calculated using the equation (1).
Blockage potential member = (Member size weighting) + (Member gradient weighting) + (Member flow velocity weighting) + (Road type weighting) + (Development weighting) (1)
Having now defined the blockage potential of existing drainage network members allows one to obtain a range of blockage potentials.
This indicator is now used to define the maintenance priority as given in Table 2.
TABLE 2: Maintenance Priority
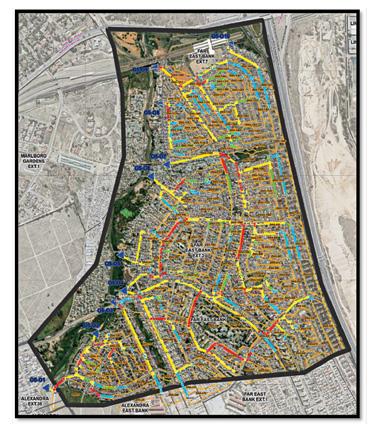
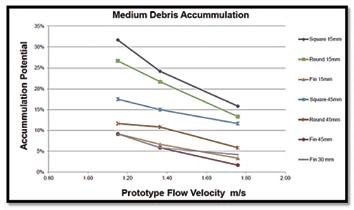
By applying the above approach, the locality and priority of require maintenance activities can be established as shown in Figure 6.
5.2 Major stormwater structures maintenance reduction
As is observed from the above field observation a large number of bridge and culvert crossings are blocked due to debris collecting at the entrance of the structure. Based on research by Stellenbosch University a significant reduction in the blockage potential can be achieved by construction debris fins. The debris fin enhances the flow lines to curve around the fin thereby letting the debris pass through.
It has been shown from Laboratory testing that the blockage potential can be reduced by as much as 25% as shown in the Figure 7.
A typical example of a debris fin is shown in Figure 8.
6. IMPROVED HYDRAULIC CAPACITY AND DESIGN OF MINOR DRAINAGE NETWORKS
A typical shortcoming observed from various stormwater drainage designs and field observations is the lack of sufficient kerb inlet hydraulic capacity
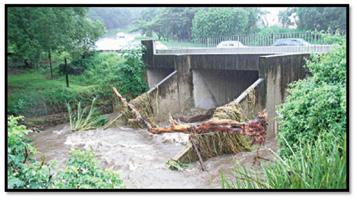
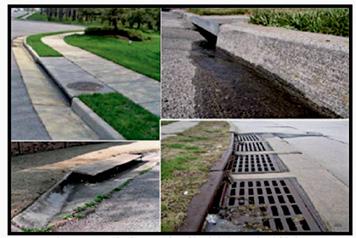
to drain the surface water into the underground pipe network. This caused excessive flows on roads which then cause flooding.
6.1 Selection of appropriate kerb inlets
A few typical types of kerb and grid inlets are shown below in Figure 9. When selecting and designing kerb inlets the following factors must be considered:
• The gradient of the road (is it steep or shallow).
• Froude number (Fr).
• The length of kerb required.
• The number of kerbs required along a road section to ensure the design flow is drained into the underground network.
• Location of the kerb inlets at low points.
The above factors all have an impact on the efficiency and hydraulic capacity of the kerb inlet considering that the surface water needs to be guided into the kerb opening by mainly gutter flow as illustrated in Figure 10.
6.2 Hydraulic Design Aspects of Kerb Inlets
The correct hydraulic design of kerb inlets must allow for at least a 5-year flood event to be captured and discharged into the underground drainage network. This aspect is often overlooked, and not sufficient kerb inlets are
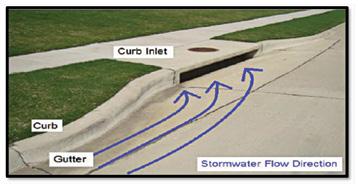
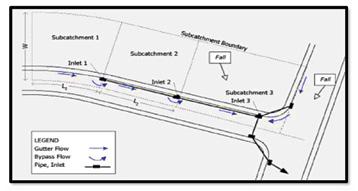

installed leading to a stormwater network not flowing at full capacity. Herewith an example of a study carried out of a small urban drainage network as shown in Figure 11. The study involved the assessment of the current drainage network capacity and also to propose upgrading measures, if required.
The existing kerb inlets consisted of the standard kerb inlet excluding any inlet transition as shown in Figure 12.
The existing drainage system details, current hydraulic capacity and design flows is summarised in Table 3.
The following is observed:
• The pipe size capacity is sufficient to cater for the 5-year design flow.
• The kerb inlets can on average only handle about 5-8 % of the pipe capacity.
• There is a significant excess road flow which now causes potential flooding.
To have a hydraulically functional drainage system the following improved approach and design has been adopted:
• Use modified kerb inlets with an inlet transition.
• Allow for additional kerb inlets.
• In steep gradients allow for longer inlet transitions or alternatively use the Salberg type of kerb inlet or similar.
• Try and balance the total kerb inlet capacity with at least the existing pipe capacity.
The upgraded and more balanced kerb inlet design is summarised in Table 4. The following is observed from the above Table 4:
• A marked increase in kerb inlet capacity is observed when using kerb inlets with an inlet transition.
• The standard kerb inlet becomes inefficient at steep road gradients usually more than 2%
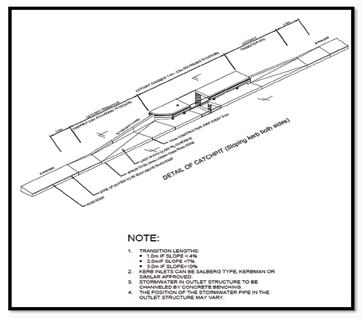
• The total kerb inlet length becomes very long in steep gradients.
• Alternate more efficient type of kerb inlets should be used in steep gradients.
• The Salberg type of kerb inlet is significantly more efficient in gradients more than about 2% due to an additional traverse grid intake.
• The road excess flows are significantly reduced thereby also decreasing the risk of flooding for minor but more frequently occurring storm event up to about a 5–10-year event.
The type of kerb inlets proposed for the upgraded drainage system are shown in Figure 13 and Figure 14.
Extensive experience has been gained from various stormwater drainage system investigations and upgrading designs for various local authorities from which the following can be concluded:
• Minor drainage networks are generally not maintained hence causing significant road overflow and flooding.
• From previous studies it was observed that up to 80% of kerb inlets and manholes are blocked with debris.
• Insufficient detail is given to the selection and design of kerb inlets having a significant lower hydraulic capacity than the underground drainage network.
• Climate change has an impact of the storm rainfall intensity and should be considered for upgrading existing and designing new drainage systems.

• Major drainage systems such as culvert and bridge crossings are often blocked with debris during storm conditions causing significant and flooding and damage to infrastructure.
• To be more proactive and resilient to climate change a local authority should make use of the maintenance prioritisation approach and algorithm to regularly at least carry out maintenance at high-risk areas, increase the kerb inlet capacity and reduce the risk of blockage at culvert and bridges by implementing debris fins.
The authors wish to acknowledge the opportunity given by several municipalities utilising our specialist stormwater management and hydraulic engineering expertise to improve the drainage of stormwater, reducing the flooding risk and potential liability claims against a municipality thereby having a safer and healthier environment
9.
The South African National Roads Agency SOC Limited, Drainage manual, 6th edition.
Ashiel Rampersad, Melusi Nkosi, Obey Manganyi, Jabulani Vincent Mashinini
Council for Scientific and Industrial Research, Smart Mobility
1. ABSTRACT
“Municipalities are failing to balance investment in new infrastructure with sound operation and maintenance of existing infrastructure to ensure sustainable service delivery. Inadequate infrastructure maintenance undermines service delivery and contributes to increased backlogs” [1]. The SAICE Infrastructure Report Card rated municipal paved roads as “D-”, and unpaved municipal roads as “E”.
Research states that delaying road maintenance is a false economy, as the longer such maintenance is left undone, the higher the eventual cost to restore the road to an acceptable condition. Prompt corrective measures are therefore recommended to minimise losses for all parties involved [2].
This paper presents a straightforward piece of research to access the readiness of municipalities to address their ageing and deteriorating road infrastructure. The research includes a critical review of road deterioration principles and current challenges, a case study to access the awareness practices of municipalities in managing their road infrastructure and a conceptual framework for local road infrastructure management.
• Critical Review: Understanding pavement theory, the impact of delaying road maintenance, the challenges in implementing road maintenance, and opportunities for successful maintenance.
• Case Study: Review of municipal Integrated Development Plans (IDPs) and finances to understand their threats and challenges, infrastructure awareness, how they prioritise road maintenance and their maintenance expenditure.
• Discussion: Potential way forward for local municipalities in the management of their roads.
The major threats identified at a local level were road infrastructure deterioration, maintenance budget underfunding and shortage of skills. Furthermore, there are inconsistencies as to the utilisation of their maintenance budget (under-utilised), and prioritising new road construction as opposed to fixing their existing infrastructure.
The South African road network of over 750 000km is the tenth longest in the world. Municipalities manage over 256 000km of the network, and an estimated 131 000km is unproclaimed. Furthermore, the road replacement cost is estimated at R2 Trillion [3].
Given the extent of the network to be managed, it is essential that preserving infrastructure be a priority. Neglect will result in the deterioration of assets, with deleterious effects on the economy, particularly regarding inflated costs of reconstruction over time. The goal of maintenance is to safeguard an asset, not to upgrade it. Road preservation and strategic maintenance initiatives are crucial for sustaining the life of the asset.
The MISA Strategic Plan [1] states that “Municipalities are failing to balance investment in new infrastructure with sound operation and maintenance of existing infrastructure to ensure sustainable service delivery. Inadequate infrastructure maintenance undermines service delivery and contributes to increased backlogs.”
The SAICE Infrastructure Report Card [4] further rated municipal paved roads as “D-” (at risk of failure), and unpaved municipal roads as “E” (unfit for purpose). Prioritisation of road expenditure is occurring within all the provinces and authorities but, there is currently no uniformity in how these maintenance schedules are set, leading to significant differences in approach. It was also reported by SAICE [4], that the majority of roads authorities, provincial and municipal, do not have up-to-date knowledge of the condition of their road systems; with only a limited number of authorities utilising a pavement management system.
The consequences of the widespread underfunding of road condition maintenance are seldom assessed by roads authorities. Pavement engineering principles state that delaying road maintenance is a false economy, as the longer such maintenance is left undone, the higher the eventual cost would be to restore the road.
Sustainable cost management is critical for long term viability. Road repair delays exacerbate road user costs, often surpassing repair costs. Prompt corrective measures are therefore recommended to minimise losses for all parties involved [2]. Repair costs are 6 times higher on poor condition roads, and 18 times higher on very poor roads [5].
The aim of the paper is to understand the readiness of municipalities to manage an ageing local road network, given their internal and external challenges.
There are 7 research questions to be addressed in this paper:
• What is the impact of delaying road maintenance?
• What are the barriers and challenges in prioritising road maintenance?
• Are there opportunities and strategies in implementing effective road maintenance?
• How are local road assets maintained?
• Do local municipalities know the condition and deterioration of their road network from an engineering perspective?
• What processes and policies are used to manage their road network, and are they appropriate?
• Are municipalities effectively utilising their maintenance budget?
Table 1 depicts the methodology used for the subsequent sections on critical review, case study and way forward.
TABLE 1: Research methodology to access the readiness of municipalities to address their ageing road infrastructure
Section Subsection
Pavement Theory
Impact of delaying maintenance
Critical Review
Case Study
Barriers, difficulties and critiques in infrastructure maintenance
Opportunities, advancements and successes in infrastructure maintenance
Municipal threats and challenges
Municipal road maintenance prioritisation
Municipal road maintenance expenditure
Discussion, conclusions and way forward
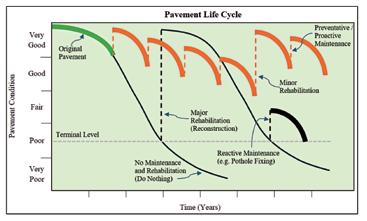
6.1 Pavement theory
A pavement is the combination of sufficient strength materials, which are durable and engineered surface layer systems which function to support vehicular traffic and environmental conditions. There are numerous types of pavements, some of which include flexible (asphalt/seal), rigid (concrete), unpaved (gravel) and block pavements (mortar bricks). South African roads are owned by different authorities which include local municipalities, provinces and the South African National Roads Agency Soc Limited (SANRAL) for national roads.
The 2022 SAICE infrastructure report card highlighted that municipalities are not managing road network at the desired service level [4]. The life cycle of a pavement requires consideration of the behaviour of materials, loading demands, the type and timing of Maintenance and Rehabilitation (M & R) to keep the road at an acceptable level of service for road owners and users. Figure 1 presents a typical design life of a pavement. The pavement is designed by exploring numerous alternatives to select the best option with regards to the life cycle costs. Proactive and preventative maintenance is the more effective maintenance solution, as opposed to spending a larger sum of money for major rehabilitation.
To preserve the level of service, road authorities utilise a Pavement Management System (PMS) and infrastructure Integrated Development Plan (IDP). These systems are utilised to consider the importance of costs in decision making optimum strategies and sustainability.
A well-defined methodology is required to maintain pavement networks at acceptable conditions, such as priority planning, since municipalities have a limited budget and available resources [6]. A study by [7] highlighted that municipalities’ main challenge is not what type of M & R is required but it is to justify that a preservation treatment is in fact necessary. The 3 Rs must be met, “the right pavement”, “the right time”, and “the right treatment”.
Methodology
Critical review of local and international literature focussing on the criticality to prioritise preventative / routine maintenance, including next steps and best practices.
Case study focussed on reviewing 41 local Integrated Development Plans to understand municipal expenses, challenges, practices and procedures.
Analysis of findings and presentation of a conceptual framework for a way forward.
Road failures are measured with reference to road distresses, condition indices, and structural/function parameters such as deflections, Dynamic Cone Penetrometer numbers and surface roughness (International Roughness Index) [8]. The indicators are used to establish a terminal criterion which is used to determine when the infrastructure reaches its level of service. Most decision-making methods or scenarios utilises the ‘‘worst-first” criterion for determining the time and type of M & R required.
Preventative and proactive maintenance techniques are generally recommended by researchers and engineers. Pavement management systems can provide agencies with many benefits and management improvements including: an up to-date inventory, current & future road condition, required future M & R, and a sound technical analysis for prioritisation planning based on pavement data [9]. Rampersad et. al [10] further highlighted that different road assessment techniques produce varying results, indicating that method selection is also critical.
A study by Makovska [9] proved that anticipation strategy (preventive) benefits both the agency and road user. Proactive maintenance program can result to mean savings of 8% to 12% in the life cycle, thus providing the right pavement with the right treatment and at the right time [11]
6.2 Impact of delaying road maintenance
The deterioration rate is crucial for prioritisation, as delaying maintenance results in higher cost for structural rehabilitation. Timely maintenance is imperative to keep the serviceability of the road network at the predefined performance level. It is important to be aware that delayed maintenance may impact not only the pavement condition, but in a broader perspective also affects mobility, safety, and agency and user costs [12]. Delayed maintenance leads to challenges such as getting the required pavement maintenance budget in both the short- and long-term which pose an infrastructure threat, by adapting to unclear or non-feasible maintenance guidelines from municipalities [6].
Chang, et al. [12] investigated the impacts of delayed maintenance, no M & R, preventative M & R, and M & R for roads in good, fair and poor conditions. The results indicate that the road condition index is a critical parameter for the prioritisation of pavement maintenance. Roads in the poor condition class resulted in a higher backlog cost and total agency cost when compared at the end of the analysis period to fair and good roads classes. The 2-years delayed maintenance scenario, resulted in higher agency cost compared to preventative methods. Delayed maintenance affects pavement conditions, mobility, safety, transportation agency and user costs. Proactive and preventative maintenance provides the best results. It is imperative to provide “the right treatment,” at “the right location,” and at “the right time.”
Pavement Life Cycle Cost (LCC) analysis is a process of determining the cost related to a pavement, which considers factors such as construction cost, M & R cost and salvage cost [13]. The LCC for different pavement options is usually determined and compared to determine the best economical alternative with reference to agency and user costs. The quality of the planning and budgeting process has a major impact on the condition of the pavement network and on the life-cycle cost of maintaining it. It is estimated that 20 – 50% of infrastructure cost is associated with maintenance [14].
The design for cost-effective pavement options should be conducted in a holistic manner and life cycle costs must consider long-term impacts of accelerating or postponing projects from one year to another [15]. When conducting studies such as Life Cycle Assessment (LCA) and LCC, it is recommended to consider a flow chart for different requirements, distress, performance, strategic importance of roads, decision-making process, comfort, environment, safety, road agency costs, and road user costs.
The do-nothing strategy results to premature failure, reactive maintenances are estimated to cost 4 to 5 times the cost of conducting preventative/proactive maintenance. Delaying M & R is not recommended, and research shows that “You either pay early or prepare to pay more at a later stage” [16].
6.3 Barriers, Difficulties and Critiques in Infrastructure Maintenance
Table 2 describes the selected challenges in implementing strategic road maintenance at a local and international level. The review is classified with an identification for local (L) and international (I) source, as well as a barrier (B), difficulty (D) and critique (C).
The following definitions are to be noted:
• Local: South African related literature, studies and findings on municipal infrastructure maintenance.
• International: Other related literature, studies and findings on municipal infrastructure maintenance.
TABLE 2: Barriers, Difficulties and Critiques in Infrastructure Maintenance
• Barrier: Key roadblocks, out of the control of the local municipality or managing agency.
• Difficulty: The local municipality or managing agency has some level of control to rectify.
• Critique: Mediocre performance or management by an agency which is within their control.
Table 3 describes a potential way forward in implementing strategic road maintenance, utilising selected local and international literature. The review is classified with an identification for local (L) and international (I) source, as well as opportunity (O), advancement (A) and success (S). The following definitions are noted:
• Local: South African related literature and best practices in implementing strategic road maintenance.
• International: Other related literature and best practices in implementing strategic road maintenance.
• Opportunity: Areas in which managing agencies can leverage for road maintenance, potential scoping.
• Advancement: Developments in research, technology and strategies, for potential adoption.
• Success: Developments in research, technology and strategies, successfully implemented.
7.1 Background
This case study examines 41 local municipalities across South Africa to assess the current state of municipal road infrastructure and the readiness of these municipalities to address their aging and deteriorating pavement networks. A selection of at least 3 local municipalities from each province was made, utilising the 2023/24, annual reports, audited financial statements, Integrated
L-B The road maintenance backlogs are immense, particularly within the provincial and municipal networks.
L-B Community unrests and labour disputes, poor and inadequate planning, capacity constraints and lack of qualified personnel to manage projects, government regulations and policies, financial challenges.
L-D Planning, fiscal management, effective human resources management, corruption control, political interference, vandalism.
L-D Limited funding and budget constraints, lack of infrastructure data and asset inventory, resistance to change and traditional practices. [20]
L-D Poor planning, a lack of approved standard operating procedures, high vacancy rates in service delivery units, procurement irregularities and poor financial controls.
L-C Low-quality construction materials, insufficient institutional capacity, limited private sector contribution, low development of advanced technologies, corruption.
L-C Current practices hindering the ability of urban municipalities to provide road maintenance at an acceptable rate of delivery and at an acceptable standard.
L-C The auditor general report states that there is a lack of standardized performance indicators for the core municipal functions (such as roads). [21]
L-C Not choosing the correct infrastructure projects, projects have not been completed on time / budget. [24]
L-C The institutional model for municipalities is not necessary at fault, but the way in which it is managed [25]
I-B Multi-infrastructure asset management: Data quality, availability and interoperability, uncertainties in modelling, problems of scale. [26]
I-B Governments should be aware of the impacts of road maintenance investments. [27]
I-D Adapting to unclear or non-feasible maintenance policies / guidelines from municipal councils / politicians, receiving the budget in time. [28]
I-C Municipal lack of capacity, no established horizontal linkages with other municipalities. [29]
I-C Problems in design stage, lack of monitoring and control, funds for maintenance, skill of staff, data inventory, time taken to solve complaints, standardised specifications and procedures, use of maintenance and technology. [30]
I-C Technical, financial, institutional, political capacity, social challenges. [31]
* L / I: Local / International * B / D / C: Barrier / Difficulty / Critique
TABLE 3: Opportunities, advancements and successes in implementing strategic road maintenance
Description of opportunities / advancements / successes
L-O Utilisation of local economic development funding (National Infrastructure Plan). Target of R1.2 trillion.
L-O The integration of innovative technology into road infrastructure management systems. Consider life cycle of the road. Integrate decision making process, limit data to be collected, publish performance statistics, deploy simple software.
L-O Systematic road maintenance programmes, preferably conducted within the framework of a Pavement Management System. Knowledge gain through Road maintenance forum: Research, strategies, developments, techniques, advances.
L-A There is a need to structure key performance targets and indicators to ensure higher quality repairs: Relevancy to the science of road maintenance.
L-S Using automated full spectrum continuous road evaluation for meaningful savings.
I-O Systematic management plan, staff development program, technology and technical capabilities.
I-O Securing funding and budget allocation, improving data collection and asset management, building support and overcoming resistance.
I-A Use of machine learning techniques to evaluate road conditions.
I-A Current predictive approach as used in industry (data science): knowledge based, data driven, physical model, digital twin, area of contribution: maintenance planning, degradation-based decision making, risk estimation.
I-A Developed countries are now moving towards a circular economy where waste materials are minimised and kept in use for as long as possible.
I-A New innovations in pavement materials and engineering: green and sustainable pavements, intelligent pavements, technology, modelling
I-S Pavement preservation techniques, crack sealing and filling, recycling and reclamation, asset management systems, training and education, comprehensive maintenance planning, utilise data driven decision making, embrace technology and innovation, plan for long term sustainability.
I-S Some of the cities run sophisticated models through asset management software programs for their roads.
I-S Two stage maintenance: determining maintenance priority through data analysis and pavement ranking.
* L / I: Local / International * O / A / S: Opportunity / Advancement / Success
Development Plans (IDPs), MFMA Section 71 and population data obtained from the municipalities of South Africa website [40]. To ensure anonymity, only the distribution of the selected municipalities is depicted (Table 4).
7.2 Municipal threats and challenges
78% of surveyed local municipalities report that their road networks are deteriorating. Municipalities also indicate they are chronically underfunded (68%). Most roads require routine maintenance and improved stormwater drainage systems. Table 5 discusses the challenges expressed by the municipalities.
Key observations of common infrastructure threats faced by local municipalities (as per IDPs) include:
1. Infrastructure crisis: Aging, failing, and underdeveloped infrastructure is a critical challenge, intricately linked to service delivery collapse and protests.
2. Financial vicious cycle: High dependency on grants, low revenue collection and insufficient budgets create a severe financial constraint hindering all other functions.
3. Governance weaknesses: Issues such as lack of trust, parallel structures, inconsistent audit findings, and staffing problems indicate significant institutional challenges.
4. Climate vulnerability: Drought, floods, fires, and broader climate change impacts are consistently highlighted as major threats affecting resources and infrastructure resilience.
5. Socio-economic burden : Poverty, unemployment, disease, and substance abuse form a complex socio-economic burden that fuels other threats like crime, non-payment, and service demands.
7.3 Municipal road maintenance prioritisation
The 41 municipal IDPs [40] were reviewed to understand how their road assets are prioritised. Table 6 describes what tools, systems and processes are used by municipalities to manage their road network.
Local governments should be able to leverage their existing knowledge, skills, and resources to meet their goals effectively. Achieving this requires stronger institutional capacity to manage operations and service delivery. However, most municipalities currently lack the capability to consistently produce reliable and transparent performance reports, highlighting significant institutional weaknesses [41]. A limited number of municipalities have appropriate systems and policies in place to manage their road network.
Furthermore, 59% of municipalities are unaware of their road network conditions (Table 7), primarily due to missing assessment systems.
7.4 Municipal road maintenance expenditure
Figure 2 highlights the local municipal road expenditure (2023/24) [41] for road networks that can be maintained and constructed per their budget. Municipalities, on average, spend more on newly constructed roads as opposed to maintenance of existing roads. This trend highlights the widespread underinvestment in infrastructure prioritisation.
Municipalities are struggling with insufficient financial resources to adequately maintain and upgrade their infrastructure assets. The low expenditure levels suggest that many municipalities lack the budget necessary to meet acceptable service delivery standards for road networks. Since the 2020–21 financial year, audit outcomes for local municipalities have remained poor. This can be attributed to failure in disclosing irregular expenditure which points to a lack of effective systems and controls [41].
Relevancy: Having the correct performance criteria
It is important to understand the municipal spending habits on road maintenance. However, a step further is to rationalise the type of maintenance to be conducted. Preventative and proactive maintenance is more beneficial to the municipality as opposed to conducting reactive maintenance (e.g., fixing potholes). It is better not to count how many potholes are fixed, but rather how many kilometers are under preventative or reactive maintenance programs.
Figure 3 shows the percentage of road networks in which municipalities can
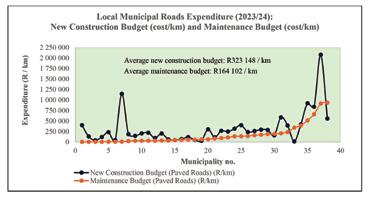
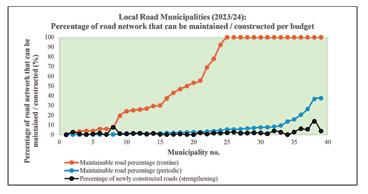
maintain, and construct based on their budgets. The graphic uses published data for activities such as periodic and routine maintenance as well as strengthening. Routine maintenance clearly shows that a larger percentage of road network that can be maintained with any given budget. Thirty-eight percent (38%) of municipalities can maintain their entire network through routine maintenance. Only one of the thirty-nine (39) municipalities, with available data, can add more than 10% of roads to their network.
The discussion aims to address the 7 sections under the critical review and case study. The research aims and the research questions are also addressed: Critical Review:
• Pavement theory: There is clarity and accepted scientific consensus that preventative and proactive maintenance are critical in preserving the health of the pavement. This not only benefits the road agency, but the user as well.
• Impact of delaying maintenance: Timely maintenance is imperative to keep the serviceability of the road network at the predefined performance level. Delaying maintenance and rehabilitation will result in the agency paying a higher cost at a later stage.
• Barriers, difficulties and critiques in infrastructure maintenance: Numerous barriers, difficulties and critiques were noted at local and international level. These range from financial difficulty, ineffective management, capacity constraints and political interference, amongst others. Nevertheless, there will always be challenges until each item specific, within their (municipal) control, is addressed.
• Opportunities, advancements and successes in infrastructure maintenance: Despite the challenges in implementing effective preventative maintenance, there are opportunities for a way forward. Although, not exhaustive, municipalities can leverage on infrastructure funding, advances in research and technology, attend developmental programmes or road forums and update their performance criteria, amongst other strategies.
• Municipal threats and challenges: Identified threats, as per municipal IDPs range from financial constraint to governance weaknesses and an infrastructure crisis. Road infrastructure (78%), maintenance underfunding (68%) and shortage of skills (61%) were identified as major challenges. It is critical that the agencies not only develop their SWOT analysis but that it is specific to their environment and conditions. Other challenges such as corruption and involvement of the “construction mafia” are not fully addressed but are to be noted.
TABLE 7: Familiarity of municipalities with the condition of their road network
are unique and specific to the local environment. It is also noted that many agencies are not aware of the extent of the problems.
The major threats identified at a local level were road infrastructure deterioration, maintenance budget underfunding and shortage of skills. Furthermore, there are inconsistencies as to the utilisation of their maintenance budget (under-utilised), and prioritising new road construction as opposed to fixing their existing infrastructure.
• Municipal road maintenance prioritisation: Less than half of municipalities have a road asset management plan, infrastructure plan or transport plan. These are critical in identifying the way forward for the management of their assets. Furthermore 59% are unaware of the condition of their network. Changes in municipal plans are necessary for long-term sustainability.
• Municipal road maintenance expenditure: New construction costs outweigh the budget prioritised for road maintenance. Municipalities are struggling with insufficient financial resources to adequately maintain and upgrade their infrastructure assets. Furthermore, routine maintenance clearly shows that a larger road network can be maintained with any given budget.
There are countless challenges and inconsistencies facing the local roads sector, with regard to management, maintenance and preservation. This paper demonstrated the impact of not maintaining a road network, with only an overarching view presented. Challenges at a local municipal level
There are however opportunities, advancements and successes in the municipal infrastructure maintenance field, both local and internationally. These include effective preventative maintenance, leveraging of funding as well as research and development.
This paper presents a straightforward piece of research to access the readiness of municipalities to address their ageing and deteriorating road infrastructure. The research includes a critical review of road deterioration principles and current challenges, a case study to access the awareness practices of municipalities in managing their road infrastructure and a conceptual framework for local road infrastructure management.
This paper aims to encourage change in the processes, systems and management of local roads, so that further deterioration and infrastructure instability can be suppressed, resulting in a longer life for road assets.
A concept framework for next steps in local road infrastructure management is presented in Figure 4. This framework presents a potential way forward for local road maintenance practices.
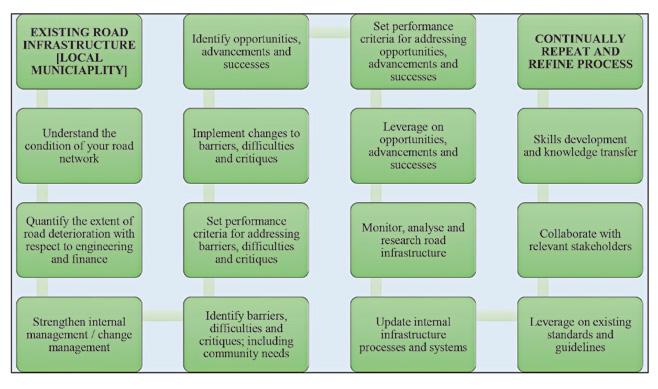
MISA, 2020. Municipal Infrastructure Support Agent: Strategic Plan for 2020 – 2025. Department of Cooperative Governance. Republic of South Africa.
Trestanto, F., Hadiwardoyo, S. P., Sumabrata, J and Lumingkewas, R. H, 2024. Road repair delay costs in improving the road rehabilitation strategy through a comprehensive road user cost model. International Journal of Engineering.
Department of Transport, 2025. South African Department of Transport. Webpage: www.transport.gov.za.
SAICE, 2022. South African Institution of Civil Engineering, SAICE, 2022 Infrastructure Report Card, South Africa. www.saice.org.za
Freight News, 2021. Crumbling road infrastructure more than doubles truck maintenance costs.
Issa, A. & Abu-Eisheh, S., 2017. Evaluation of implementation of municipal roads’ maintenance plans in Palestine: A pilot case study. International Journal of Pavement Research and Technology, Volume 10, p. 454–463.
Mubaraki, M., 2012. Maintenance strategies at project level for low volume urban roads. International Journal of Pavement Research and Technology, 5 (4), pp. 225-233.
Huang, L. L., Lin, J. D, Huang, W. H, Kuo, C. H, Chiou, Y. S and Huang, M. Y, 2024. Developing Pavement Maintenance Strategies and Implementing Management Systems. Infrastructures 2024, 9, 101.
Makovska, J., 2020. Method of evaluation of road routine maintenance strategies. Economics, Finance and Management Review, Volume 4, pp. 106-112.
Rampersad, A., Mvelase, G. M., Simelane, M. N and Harrilall, K. 2023. Variations in pavement performance assessments using the visual condition index and deduct point methods for maintenance prioritization. 13th Conference on Asphalt Pavements for Southern Africa.
Poór, P., Ženíšek , D. & Basl, J., 2019. Historical overview of maintenance management strategies: Development from breakdown maintenance to predictive maintenance in accordance with four industrial revolutions. Pilsen, Czech Republic, Proceedings of the International Conference on Industrial Engineering and Operations Management. https://www. researchgate.net/publication/335444202
Chang, C., Rodriguez, E., Yapp, M. & Pierce, L., 2018. Consequences of delayed maintenance of pavement networks. Pretoria, South Africa, 37th Annual Southern African Transport Conference.
Alipour, A., Shafei, B., Mock, A. & Prajapat, K., 2020. Development of a LifeCycle Cost Analysis Tool for Improved Maintenance and Management of Bridges. Project TR-737, Iowa State University: Institute for Transportation. Mao, I. & Haung, R., 2015. Lifecycle Assessment of Maintenance, Repair and Rehabilitation Costs: A Deterioration Modelling Approach for Bridge Components. Journal of the Chinese Institute of Civil and Hydraulic Engineering, 27(1), pp. 47-57.
Anochie-Boateng, J., Sampson, L., Agyekum, P. & Ampadu, K., 2017. Life-cycle cost comparison of alternative surfacing for steep slopes on low-volume roads in Ghana.
Sarsam, S., 2016. Pavement maintenance management system: A review. Trends in Transport Engineering and Applications, 3 (2), pp. 19-30.
Ross, D. & Townshed, M., 2019. The road maintenance backlog in South Africa. 38th Annual Southern African Transport Conference. Pretoria, South Africa. https://repository.up.ac.za/items/e8bef1b9-c070-4529a7d5-a96d25ce64e5
Maphela, B. & Adanlawo, E. F., 2025. Road infrastructure in South Africa: What is missing? International Journal of Business Ecosystem and Strategy: Vol 7, No 2, pp. 470-478
Shongwe, B. R. & Meyer, D. F., 2023. Service Delivery Challenges within Rural Communities: The Case of the Nkomazi Local Municipal Area. Administratio Publica: Vol 31, No 2, pp. 136-159.
Denison, C., Paramski, D. & Sergesketter, B., 2024. Preserving Roads: Ensuring Municipalities’ Sustainable Infrastructure Future. Purdue Road School 2024, Road School Lecture Presentation: Session 177.
AGSA, 2024. Consolidated General Report on Local Government Audit Outcomes: 2023 – 24. Auditor General of South Africa. www.agsa.co.za Bele, K., 2022. Analysis of impact of maintenance practices on road infrastructure, Johannesburg: University of Johannesburg. Master of Engineering Thesis.
Sutherland, C., 2024. Performance monitoring for executives in road maintenance and service delivery. Cape Town, 2024 Conference for The Institute of Municipal Engineering of Southern Africa, pp. 182-188.
Mabugu, R. E and Rakabe, E., 2024. South Africa’s municipalities aren’t fixing roads, supplying clean water or keeping the lights on: new study explains why. Article – The Conversation. Published online: 29/09/2024. www. theconversation.com
Wall, K., 2024. South Africa’s municipal roads authority: Are they built on a weak foundation? 2024 Southern African Transport Conference. Pretoria, South Africa.
Daulat, S., Rokstad, M. M., Klein-Paste, A., Langeveld, J and Tscheikner-Gratl, F, 2022. Challenges of integrated multi-infrastructure asset management: a review of pavement, sewer, and water distribution networks. Structure and Infrastructure Engineering, Volume 20 (4), p. 546–565.
Gertler, P. J., Gonzalez-Navarro, M., Gračner, T. & Rothenberg, A. D., 2024. Road maintenance and local economic development: Evidence from Indonesia’s highways. Journal of Urban Economics, Vol 143.
Afridi, M., Erlingsson, S. & Sjögren, L., 2023. Municipal street maintenance challenges and management practices in Sweden. Frontiers in Built Environment, Volume 9, ISSN: 2297-3362. https://www.frontiersin.org/ journals/built-environment/articles/10.3389/fbuil.2023.1205235/full
Alm, J., Paulsson, A. & Jonsson, R., 2021. Capacity in municipalities: Infrastructures, maintenance debts and ways of overcoming a run-tofailure mentality. Local Economy: Volume 36, Issue 2, pp. 81-97.
Ismail, A., Razelan, I. S. M., Yusof, L. M., Zulkiple, A and Masri, K. A., 2021. An Overview of Pavement Maintenance Management Strategies in Malaysia. Institute of Physics Publishing, Volume 682 (1).
Gibson, J. P. & Marshall, W. E., 2022. Disparate Approaches to Maintaining Roads and Sidewalks: An Interview Study of 16 U.S. Cities. Transportation Research Record, 2676 (9), pp. 553-567
DPME, 2024. Medium Term Development Plan 2024-29, South Africa: Department: Planning, Monitoring and Evaluation.
SABITA, n.d. Information Sheet: Maintaining Surfaced Roads, South Africa: Southern African Bitumen Association.
Tetley, S., Balaram, Y., Schmidt, B. & Lewis, T., 2022. The management of road maintenance in South Africa 2022 - Observation on current practice and a modus operandi towards addressing service delivery. 2022 Conference for The Institute of Municipal Engineering of Southern Africa, Paper 16, Gauteng, South Africa, pp. 146-153.
Dzulkifli, N., Sarbini, N. N., Ibrahim, I. S., Abidin, N. I., Yahaya, F. M and Azizan, N. Z. N., 2021. Review on maintenance issues toward building maintenance management best practices. Journal of Building Engineering: Volume 44, December 2021.
Simelane, M and Rampersad, A. 2024. Evaluation of road condition indices methods and applicability for use in machine learning. 2024 Southern African Transport Conference. Pretoria, South Africa. https://www. researchgate.net/publication/390266872
Sajid, S., Haleem, A., Bahl, S., Javail, M., Goyal, T and Mittal, M., 2021. Data science applications for predictive maintenance and materials science in context to Industry 4.0. Materials Today: Proceedings 45, pp. 4898-4905.
Ferdous, W., Manalo, A., Siddique, R., Mendis, P., Zhuge, Y., Wong, H. S., Lokuge, W., Aravinthan, T and Schubel, P., 2021. Recycling of landfill wastes (tyres, plastics and glass) in construction – A review on global waste generation, performance, application and future opportunities. Resources, Conservation and Recycling: Volume 173, October 2021.
Chen et al. 2021. New innovations in pavement materials and engineering: A review on pavement engineering research 2021, Journal of Traffic and Transportation Engineering, English Edition, Volume 8, Issue 6, 2021, Pages 815-999, ISSN 2095-7564. Article online: https://www.sciencedirect. com/science/article/pii/S209575642100101X
Municipalities of South Africa. Website retrieved: 2025, June 18. Retrieved from Municipalities of South Africa: https://municipalities.co.za/ municipalities/type/3/local
2023-2024 Municipal Finance Management Act: General Report, 2024. Consolidated General Report on Local Government Audit Outcomes. Auditor-General South Africa.
Dr. Dinos Constantinides1 and Dr. Petros Kolovopoulos2, Utility Management Expert, Hydro-Comp1 Asset Management Expert, Hydro-Comp2
Water and Sanitation Service Providers are faced with many challenges including the aging infrastructure often resulting in crisis and service interruptions, inaccurate data and inappropriate asset registers, high non-revenue water (both in terms of leakage and commercial losses), higher customer expectations in terms of services as well as water quality information and low productivity mainly because of inefficient processes and systems.
The best way to face these challenges is the introduction of best practices in integrated asset management (ΙΑΜ), where IAM can be best defined as: “An integrated approach to monitoring, operating, maintaining, upgrading, and disposing of assets cost-effectively, while maintaining a desired level of service and is intended for improving the overall business performance”.
Although well defined, it is easier said than done. Traditional vendors are very product and services focussed and, in most cases, grossly
underestimate the amount of business processes that occur within a Utility, their importance and the required interaction between them. In fact, to exercise proper IAM all the departments of the organisation must be involved and interact in between them. This oftens leaves service providers stranded with many disjointed products and services addressing pieces of the puzzle but rarely putting the puzzle together.
This paper looks at available technology, best-practices, and a practical approach, applied within the ISO 55000 Standards framework, towards building capacity for IAM. Main functions are well defined and most importantly their interaction and importance in addressing challenges is highlighted and explained. The process of implementation results from relevant case studies are also presented.
The main components of an Integrated Asset Management system appropriate for a Water Service provider addressing the entire lifecycle management of assets, and challenges faced by the provider, as well as the required Asset Management processes and workflows are explained. Necessary functionality, challenges addressed, best-practice practices for implementation and benefits arising are explained for each step of the
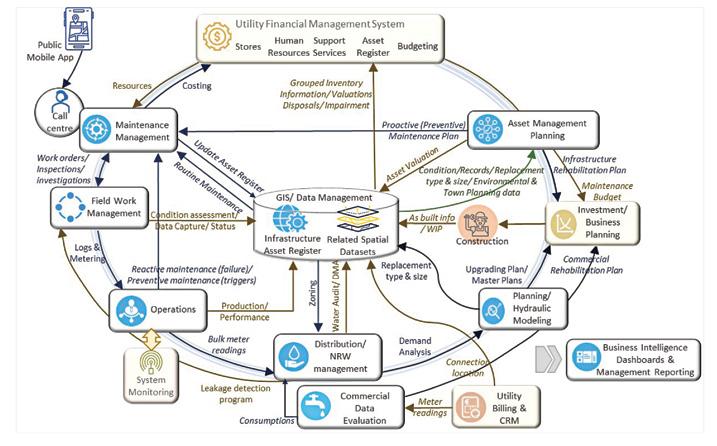
system implemented. Examples are given from case studies in some of the stages.
Infrastructure challenges faced by Water & Sanitation Utilities and the way the proposed system addresses the are explained. Such challenges include 1) Inappropriate and Inaccurate Infrastructure Asset Register, 2) Ageing Infrastructure & Challenges in securing funding, 3) Low productivity, 4) High Non-Revenue Water (NRW) and 5)High Electricity Pumping Costs, 6) High Chemical Costs, 7) Ringfencing W&S services financially. Recommendations stemming from lessons learned are given for the procurement and implementation of an Integrated Asset Management system.
The diagram below outlines the main components of an Integrated Asset Management (IAM) system for water and sanitation utilities, addressing asset lifecycle management and the challenges described. It also outlines the key processes and workflows, which are further detailed in the following sections. Practical applications are illustrated through accompanying case studies.
The primary objective of Network Data Management is to maintain a reliable and sustainable asset register for Water & Sewerage Infrastructure. A robust geographical database is essential to support all technical functionalities, providing the necessary tools for capturing, structuring, maintaining, and managing all relevant graphical data effectively.
Main features should include:
1) Data Structure: The Asset register must support all required functions without necessitating data duplication, such as Mapping, Maintenance, Operations, Hydraulic Modelling and Rehabilitation planning.
2) Data Elements: Must include all standard assets in the areas of Water & Sewerage Bulk Supply and Distribution, as well as any other fixed assets the department might have and maintain. Further the system should allow for the (a) the generation of custom elements (asset types) to monitor their maintenance. (b) the attachment of documents, pictures, videos and any other relevant information.
3) Libraries: System libraries must be maintained for key elements such as pipes and pumps, ensuring standardization across the system.
4) Hierarchical Structure: Must offer the functionality to present the network data in a tree-like structure, reflecting inheritance and functional dependencies, allowing for a clear, logical representation of the plants and network and their component.
5) Data Handling: The system must address the entire spectrum of data management that includes (1) Network data capture/ editing and (2) Network data acquisition from other sources.
6) Projects Register (project tracking): The system must enable the registration and tracking of both proposed and completed projects, facilitating the management of rehabilitation and expansion efforts.
7) Network data analysis & evaluation: The system must provide a list of exceptions based on validation rules and business logic and ensures that exceptions are classified intelligently to highlight critical problems for timely action.
8) Enquiries, Reports, Dashboards & Mapping: The system offers a wide range of querying options, including standard queries, graphical templates, thematic mapping, and numerical reports. A selection of common reports is pre-configured, while users can also create custom reports tailored to specific needs. Additional reporting features include:
(a) Bills of Quantities, (b) Profiles, (c) Thematic mapping with labels and legends, and (d) Custom-made reports.
9) Financial Asset Register integration: The system should also be able to export infrastructure asset data in a user-defined format, facilitating consolidation into the Financial Asset Register
Apart from data conversion and training the Consultant implementing the system should carry out the following important activities.
1) Data Quality Standards: Data Structures must be defined, agreed with the Client and set up in the system bearing in mind:
a. The geographical nature of the assets
b. The fact that the Asset Register will be used to enable additional functionality regarding Operations (Logs), Maintenance Management, Distribution/ NRW Management, Asset Management Planning and Infrastructure Planning.
c. The hierarchical nature of the assets, especially when dealing with major infrastructure components such as treatment plants, pumpstations, etc.
2) Data Management Procedures must be defined, agreed with the Client and set up in the system address all relevant aspects, including:
a. Document Management Control Procedures,
b. Procedures for updating Asset changes due to Maintenance/ Rehabilitation works as well as GIS updates,
c. Procedures for capturing new assets arising from New Works/ Projects, making allowance for work-in-progress (WIP).
d. Procedures for capturing new assets arising from Internal Projects
3) Network data evaluation: The Consultant must review the asset inventory status and assess data quality; analyse the networks regarding connectivity and identify suspect areas that need to be investigated further as well as identify areas with missing networks from the asset register. Missing parameters per element regarding dimensions, make, material, type, date of installation must also be identified for further investigation by the Client.
4) Zoning: The system should be able to generate zones automatically and the consultant should generate such zones and compare with the perceived zones by the authority. In most cases there are many discrepancies implying that zones are not isolated. In one case recirculation around a pump station was even identified.
5) Desktop editing : The Consultant must assist the Service provider is sorting out the obvious problems in the Asset register, especially regarding disconnected networks and zoning and at the end of the exercise redo the Network data evaluation exercise reissuing a discrepancy report, identifying critical errors, that can be used in field investigations by the Service Provider.
The table below summarizes the issues and discrepancies identified during the initial conversion and analysis of the iLembe District Municipality’s water supply data. While the municipality’s GIS department demonstrated considerable expertise, these discrepancies could not have been detected using a conventional GIS system.
Maintenance Management must cover all facets of maintenance, including routine, proactive and preventive maintenance, as well as the management and optimal operation of the supply at the Utility. It should address all types of assets maintained by the Utility including
Water Supply, Sanitation, Properties, Buildings, Vehicles and Equipment. Maintenance Management is also important for (a) the provision of cost information per activity for Budgeting purposes (OPEX) and (b) keeping of maintenance records important for condition assessment.
1) The system should deal with the scheduling and management of work orders and the management of maintenance activities relating to Water & Sewerage networks, connections, and meters.
2) Maintenance Management: The system must allow the following functions: (a) Recording and processing of maintenance requests, (b) Predefined industry specific maintenance activities, (c) Allocation of maintenance resources, (d) Scheduling and management of resources (manpower, stores and support services) for work orders, (e) Work order management (including job card scheduling & processing), (f) Routine/ Preventive/ Proactive/ Reliability-driven maintenance programs, (g) Maintenance decision matrices, (h) Monitoring of networks, job costing,
record keeping of history, generation of thematic maps and Maintenance Management reporting.
3) Network & Plant Maintenance: The system must include industry specific templates and procedures to handle all relevant Network and Plant (Water and Effluent Treatment) maintenance activities such as: Investigations, Inspections, Operations (logs, meter reading, etc..), Opening/ Closing of Valves, Installation of bulk (flow) meters, Leak detection, Repairs/ Outage management, Pipe/ other asset replacement, Servicing (Routine, Preventive Maintenance).
The system must integrate with the Service Provider’s ERP systems where applicable. In the absence of such systems, it should be capable of storing the relevant data within its own database. The integration encompasses the following components:
1) Stores: to track availability and costs of goods and to forward requisitions.
2) Support Services: to establish availability of plant, equipment and costs and requisition as needed.
3) Human resources (HR): to track skills and workload availability.
1) Maintenance Management Reporting: The system must be able to export scheduling to MS Project, create a budget per maintenance activity and compare planned budgets with actual expenditures.
2) Work in Progress Reporting: The system must report on work in progress for any action request at any given stage of execution as well as generate a daily operations work report and issue network fault reports.
3) Maintenance Isolation Instructions: In case any maintenance activity requires isolation of the network (for example for broken transmission TABLE 1: iLembe Municipality Water Network
lines) the system must be able to automatically identify the valves to be opened and allow printing of a map/ forward map to tablet held by field personnel to include with relevant instructions/Job Cards.
4) Maintenance Data Analysis: The system must keep historical records of all maintenance activities and provide data analysis for work historical analysis, generating job costing analysis per activity, crew/ employee usage/ performance reports and provide audit trail reports.
5) Failure and reliability analysis: The system must be able to perform Failure and reliability analysis based on the assets’ maintenance history, importance and condition and suggest appropriate action.
The Maintenance Management system should have an integrated Call Centre System. The Call Centre system is used for complaints management and enquiries. The system should be able to record the problems as well as the outcome of their investigation.
Features should include: (a) Automatic diversion, (b) Task Assignment, (c) Geographical display of the location of problem, (d) Management of resources including costing, (e) a User-friendly Dashboard, (f) Link calls for the same problem, (g) Integration with the Maintenance system, (h) Reporting, (i) Customer/ public Feedback and (j) Storing and analysing of customer satisfaction levels
A mobile application should be available that could be used by any members of the public to be able to report incidents they observe in the field. This will ensure timely action by the Provider, enhancing service responsiveness and community engagement.
The Incident Reporting function should allow for:
1) Instant issue reporting for critical infrastructure problems.
2) Precise geolocation with ability to refine exact problem location.
3) Flexible incident reporting using predefined lists or custom descriptions.
4) Intelligent incident management identifying and merging duplicate incidents.
5) Universal accessibility should be enabled through secure verification for all users.
6) Real-time resolution notifications to keep customers informed.
7) Map-based visualization that shows all incidents geographically for efficient response coordination.
TABLE 2: Upgrading Plan – Case Study, Kimberley (South Africa) –Before and after Conditions Before After
• Only 4 zones
• Under Average Demand (75.1 Ml./day) the network copes relatively well with a few violations. Lower pressures calculated are 11.8 meters under pumping (Riverton pumps) and 9.7 meters under gravity.
• Under Present Peak Demand (183.8 Ml/day) – very low pressures (well below zero). undersized pipes highlighted in red in the diagram,
• 15 zones
• Copes well even under fully developed peak demand conditions
• Electricity reduced by 25% Remedial work includes:
• 31 new joints, 5 to be undone
• Pipes decommissioned - 25,857 meters (7.5% of the network)
• 5,980 meters of new pipework
• 3,786 meters of pipes are replaced/ upgraded.
• Pump changes
The main purpose of the Asset Management Planning system is the formulation of rehabilitation and preventive maintenance plans with the objectives of (a) Minimizing the costs of asset ownership, (b) Maintaining required service levels, and (c) Sustaining the infrastructure over time. Additionally, the system must perform financial asset valuation, which is essential for balance sheet reporting and meeting regulatory requirements.
The system must make use of the Reliability Cantered Asset Management Methodology (RCAM) that combines the condition and importance of each asset to determine risk of failure. This analysis determines the most appropriate Asset Management (AM) approach, which may include Corrective Maintenance, Extended Time-Based Maintenance, Time-based maintenance, Asset Refurbishment or Asset Replacement.
The system must record historical information of asset valuations, refurbishments, and condition assessments providing a comprehensive view of asset performance over time.
A Field Work Management (FWM) module should exist as a Mobile App or a web-enabled module that allows employees to perform daily maintenance, data management, and operational tasks while on the field. Main features should include:
1) Secure web access, following standard security protocols.
2) Support of QR (quick response) bar coding for easy identification and coding of components.
3) Integration with Google maps for easy location reference and locating incidents/ problems.
4) Multimedia Support to accept pictures, documents, and GPS coordinates for any asset.
The system must be able to have support various applications including:
1) Enquiries, Production of Reports
2) Field Data Capture: An online portal to the GIS/ Data Management system, enabling inspections and surveys for data collection (asset attributes) as well as capture of new assets.
3) Field Maintenance: An online portal to the Maintenance Management System, allowing the user to record a new problem or update an existing, preview various reports and in general, perform most of the maintenance operations as if he/she was in front of desktop application.
4) Condition Assessment: An online portal to the GIS/ Data Management system, enabling inspections and surveys for condition assessment of above ground assets, using predefined templates.
5) Recording of Logs and Readings: An online portal to the Operations module, allowing users to manage, store, evaluate, and verify any kind of logs and readings captured.
It should be noted that “ticketing systems” widely used in South Africa do not support most of the features required above and are not integrated to any of the main Asset Management systems mentioned above.
Hydraulic analysis can be used in various ways. Under calibration mode and linked to Operations, getting flow and pressure readings, it can localise (to the nearest node) and quantify leakage.
Furthermore, it plays a critical role in evaluating and optimizing existing networks, resulting in an “Upgrading Plan”. It enables effective rezoning and optimization of the system to balance pressure distribution and ensure proper flow conditions. An optimized network reduces leakage, lowers the likelihood of future leaks, simplifies leakage control, and extends the
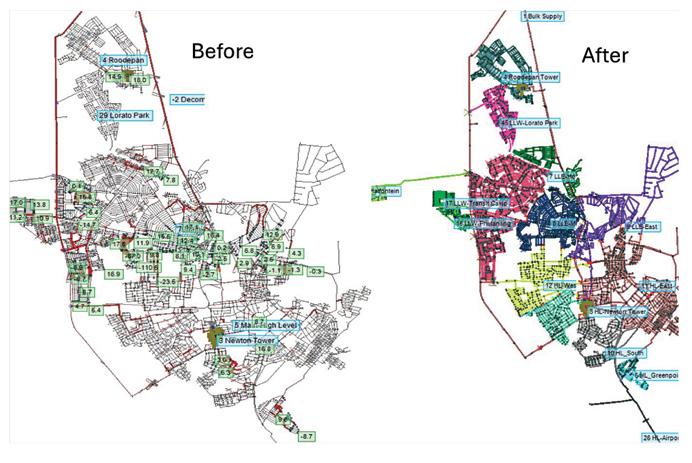
network’s lifespan. Often, the Upgrading Plan’s simple, low-cost remedial works are sufficient to achieve these results.
The illustrations below depict the before and after situation for Kimberley in South Africa (Constantinides 2025B). Note the notes in the diagrams. One wonders. “If this Upgrading Plan was not carried out, what would one do with the 26km of mostly corroded, decommissioned pipes when compiling a rehabilitation plan? Replace them?”
The main purpose of the Operations system is to monitor and record data and events required for (a) capturing information (b) triggering maintenance requests when problems arise, (c) statistical analysis for maintenance and rehabilitation planning purposes, (d) distribution/ NRW management and (e) planning - demand Analysis. Additionally, the system should be able to evaluate the performance of bulk meters, pump stations, and production units.
Non-Revenue Water is comprised of both Commercial losses (connection, meter, billing problems and illegal connections) and technical losses (leakage). The main purpose of the Commercial Data Evaluation System is the extraction and analysis of data and information from the Billing/ Customer Services system both for Meter Management purposes as well as for the Improvement of the Commercial function. The module should produce discrepancy lists and summaries addressing the problems listed in Table 3.
Furthermore, the system should carry out a detailed demand analysis per connection that can be used for the Water Audit as well as to quantify
financial implications, calculating components such as: Metered demand, metering inaccuracies, wastage and internal leakage, over/under billing, Finally, the financial implication for each problematic connection should be calculated both in terms of the sum of lost revenue and extra production cost (due to wastage & internal leakage).
Non-Revenue Water is comprised of both Commercial losses (connection, meter, billing problems and illegal connections) and technical losses (leakage). The Distribution/ NRW Management System should handle technical losses and be in line with all the best practices recommended by the International Water Association (IWA). The system should provide an automated solution for the effective management, monitoring, and auditing of District Metered Areas (DMA).
The system should link production, consumption, bulk meter flows, and infrastructure assets through zones automatically generated by the system. The system should automatically:
1) Allocate each connection/plot to a DMA/ Balancing area based on its location
2) Generate “equations” relating bulk meters to Balancing areas
3) Perform demand projections per DMA. In the case of real-time readings utilize profiles of consumption
4) Compare supply with demand
5) Perform night flow analysis, identifying base flow leakage
6) Perform a comprehensive NRW Audit
7) In the case of real time readings, real-time mass balancing should also be possible.
TABLE 3: Commercial Data Evaluation Results
A
1
B
2
3
4
C Database Problems
5 Property Data Problems
Connections with meter, few meter readings & estimates
5.1 Problematic Property data [overlapping polygons, duplicate polygons, missing data, etc..]
5.2 Property numbers found in the Billing Database that are not found in the Property database
6 Suspect Illegal/ unauthorized connections 6.1 Known Properties that do not have a connection
Business Intelligence enables the user to Explore, Visualize and Report on the Provider’s data at any desired level (operational, supervisory, departmental, managerial or at stakeholder level) through dashboards, maps, reports, and queries. It plays a key role in monitoring and evaluating the asset management maturity level of the service provider and further supports the implementation of corrective actions.
Main features should include:
1) Effective management reporting at all levels in the form of dashboards.
2) Operational dashboards should be primarily designed to trigger corrective actions. Departmental dashboards and reports on the other hand should align with objectives and performance targets, while management reports should focus on strategic and financial goals.
3) Management reports/dashboards should cover relevant areas of the business regarding money earned or spent and include appropriate Key performance Indicators (KPIs).
4) Users should be able to “drill down” from management reports, i.e., progressively go down to any level of information influencing the outcome of a report.
The diagram below illustrates the challenges faced by Water Service Providers, overlaid onto the proposed Integrated Asset Management system. It highlights the role each component plays in addressing these challenges. The sub-sections that follow give a brief description of how the proposed system handles these challenges. NRW component challenges and dealt with in the section that follows.
Inappropriate and Inaccurate Infrastructure Asset Register
The GIS/ Network data management system evaluation mode identifies data
problems regarding (a) network connectivity, (b) Missing or unidentified assets in the register and (c) Missing or incomplete asset attributes. A desktop exercise usually follows where most of the problems, especially the ones dealing with connectivity, are resolved. The knowledge of people in the field is invaluable during this exercise. Following the desk-top exercise, the evaluation is repeated, and critical problems are highlighted for field investigation.
The data structure of the GIS/ Network data management system is such so that it can be used for all relevant departmental functions, such as mapping, maintenance, condition assessment, rehabilitation planning and hydraulic Modeling. As such multiple data sets are not required.
Ageing Infrastructure & Challenges in securing funding
Ageing Infrastructure results in increased risk of asset failures and service disruptions, frequent breakdowns leading to high maintenance costs. Often Service providers have difficulty in justifying raising finance for necessary infrastructure upgrades.
The AMP (Asset Management Planning) sub-modules will perform condition assessments of infrastructure and calculate both replacement value and net asset value based on remaining useful life (as opposed to depreciated accounting value). The Rehabilitation planning module will result in the most optimal manner for maintaining/ rehabilitating/ replacing assets ranked in terms of risk. Action plans can be formulated as per budgetary constraints.
Banks want to see that a utility is financially sound, well-managed, and that the project is technically and economically viable, with safeguards against risks to loan money. Certain banks, like the World Bank and European Investment Bank often want to see an Asset Management system and best practices in place prior to lending money for capital works or major infrastructure rehabilitation projects.
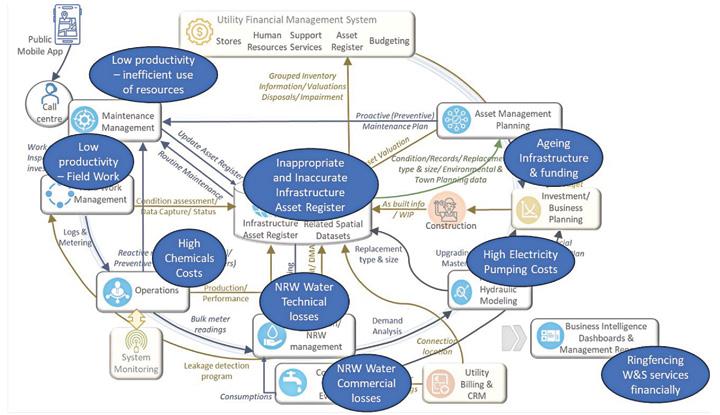
The use of an integrated field work module with maintenance management, resource management (manpower, stores, vehicles and equipment) and the asset registry results in increases is productivity, in some cases more than 30%. Problems addressed include:
a. High downtime in field validation, maintenance, and asset condition assessment.
b. Inefficiencies in data capture and structuring.
c. Time-consuming leakage detection processes. Additional modules of the proposed systems address:
a. Slow incident reporting and resolution – through the Call Operational Centre System and the Public Mobile Application
b. Inefficient data analysis for operational and financial decision-making –through the Business Intelligence (BI) module
c. Delays in management reporting due to extensive data processing requirements – through BI live dashboards.
Pumping costs can account for up to 40% of operational expenditure. The Operations-pump performance module evaluates pump efficiency and inefficient pumps are identified for maintenance. In addition, distribution system inefficiencies, including bottlenecks and poor zoning, lead to excessive energy consumption. Optimizing distribution through proper rezoning using Hydraulic analysis can reduce pumping energy requirements by up to 30%. (25% in Kimberley).
The Operations module can keep logs and produce statistics of chemical dosage. Furthermore, logs can be linked to a function of recommending dosage of say Chlorine or Flocculant, thus determining optimal dosages.
Ringfencing water and sanitation services financially refers to separating the financial management, accounting, budgeting, and reporting of water and sanitation services from other municipal services. All such information is found in the proposed systems and can be effectively summarised in reports and dashboards in the Business Intelligence module.
The diagram below presents the components of Non-Revenue Water (NRW) overlaid onto the proposed Integrated Asset Management system, indicating how each system component contributes to addressing the respective NRW elements. A small description of how the proposed system addresses these NRW components follows.
All components leading to commercial losses including Stuck/ broken meters, malfunctioning (slow) meters, illegal/ unknown connections, poor meter reading practices, inaccurate data in Billing systems and wastage & internal leakage by consumers are addressed using the Commercial Data Evaluation module. Problematic Connections can be ranked in terms of their financial implication so that rehabilitation plans can e drawn up.
1) Visible Bursts/ Leaks: The Public mobile App together with an efficient call centre ensure that such leaks are reported and addressed timely through the Maintenance and field work management modules.
2) High & irregular pressures as well as unnecessary pipes (to be decommissioned) are addressed through hydraulic analysis and the compilation of a Network Optimisation/ Upgrade Plan.
3) The Real time water balancing module can alert the department of a visible or non-visible leak to act in a specific zone
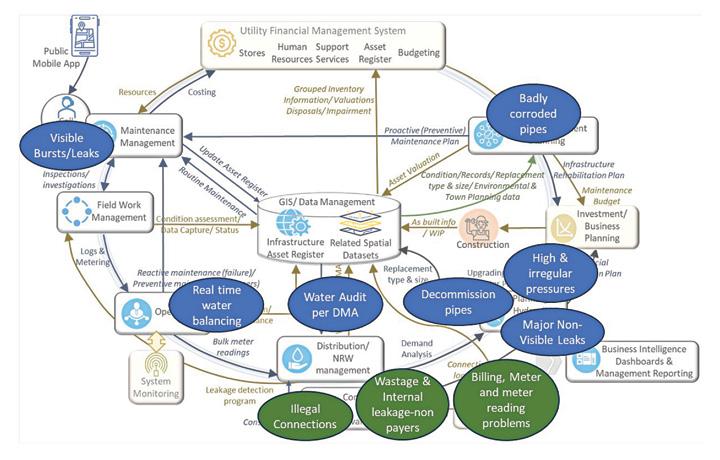
4) The Water Audit per DMA module can assist the department in prioritising DMAs that need specific attention.
5) Major non-visible leaks: The Hydraulic analysis module in conjunction with pressure and flow readings taken in problematic DMA can be used to locate and quantify major leaks.
6) Badly corroded pipes: The Asset Management planning module, through pipework condition and risk assessment identifies pipes that must be rehabilitated/ replaced. The network optimisation plan provides the type and size of the pipe to be used in the replacement.
A comprehensive Integrated Asset Management (IAM) system is presented. The following points summarize the key aspects of such a system and the critical factors for its successful implementation in pursuit of Asset Management excellence within the organization:
1) Asset Management requires an integrated approach to monitoring, operating, maintaining, upgrading, and disposing of assets cost-effectively, while maintaining a desired level of service and improving overall business performance.
2) The GIS/ Data Management system serves as the primary Infrastructure Asset register. Data must be structured correctly and in such a way to serve all purposes (Mapping, operations, maintenance, hydraulic modelling, etc.).
3) An appropriate Asset Management information system forms the basis of AM. It must encompass all functionality relating to Assets lifecycle and ensure proper service delivery in a sustainable manner. Integration and nodata duplication is of extreme importance.
4) Challenges: The AM system must have enough functionality to addresses the challenges faced by the Service Providers, i.e.: 1) Inappropriate and Inaccurate Infrastructure Asset Register, 2) Ageing Infrastructure &
Challenges in securing funding, 3) Low productivity, 4) High Non-Revenue Water (NRW) and 5) High Electricity Pumping Costs.
5) Capacity building of the organisation is of paramount importance. ICT is imperative as it forces/ brings about permanent change. During implementation Change Management is the foundation of capacity building.
6) Studies: Several data and planning studies are required to optimize performance and maximize Asset value. “Correct” data, operational and maintenance records are essential for meaningful results. Consultants can again play an important role in assisting in follow up projects.
Asset Management tenders in South Africa, guided by legislation and mainly Accountants, tend to focus on Condition Assessment exercises, concentrated on above ground assets. Such exercises involve a lot of expertise of various engineering disciplines and specialised Accountants. Furthermore, there are incomplete as pipework is often ignored. The cost of such intensive work overshadows the cost and importance of a proper Asset Management System as outlined in this paper. It is advisable that the Service Provider sees the Integrated Asset Management system as part of its SAMP (Strategic Asset Management Plan) and procures it separately. Implementing such a system requires a longer time commitment by the Service provider as such a system is basically a “game changer” redefining the way the Provider operates and investing a lot in building capacity within is organisation.
The implementation of the Integrated AM system can be done in phases as outlined in the paper. However, when procuring software, the Consultant must show that the proposed system has all the required components to ensure a fully Integrated Asset Management solution at the end of the chosen roadmap.
It is not recommended that any Software be bought without having the vendor responsible for properly implementing the software, both in terms of converting and structuring the data correctly and in terms of setting up agreed business processes and workflows. When this approach was taken in the past the result was a very expensive and lengthy implementation with compromised overall results. In some cases (e.g., Jordan, Qatar), after substantial investments and several years, both utilities issued tenders requesting vendors to supply systems with the “missing functionality” and to ensure integration of all existing systems—yet this proved to be another futile exercise. The points presented in this paper can assist Water Service Providers in drafting Technical Terms of References when procuring.
Constantinides 2025A, “Fundamental Pillars of Asset Management for Sustainable Service Delivery”, Master Class at National Local Government Service Delivery Indaba, Durban South Africa.
Constantinides 2025B, “Integrated Planning & Value Creation through existing Infrastructure Assets “, paper at National Local Government Service Delivery Indaba, Durban South Africa.

Drone Labs is a pioneering company that leverages advanced drone technology to transform agriculture, creative engineering, and professional training. In agriculture, their state-of-the-art Unmanned Aircraft Systems, equipped with high-resolution imaging and multispectral sensors, deliver real-time data on crop health, soil moisture, and pest infestations, enabling farmers to optimise resource use and boost yields.
Complementing these technical advancements, Drone Labs offers comprehensive training programs; from pilot certification courses to hands-on technical workshops, ensuring that both novices and professionals are equipped with the skills necessary to operate and maintain these sophisticated systems.
Drone agriculture offerings typically include a range of services and solutions that leverage drone technology to enhance agricultural operations.
MONITORING
From tracking wildlife to assessing climate changes, drone technology enhances monitoring capabilities while reducing environmental impact.
Drones provide high-resolution imagery, real-time monitoring, and data-driven insights that enhance efficiency and decision-making.


Drone mining services typically include a range of solutions that leverage drone technology to enhance mining operations.
INSPECTION
Drone technology has revolutionised infrastructure inspection, offering a safer, faster, and more cost-effective alternative to traditional methods.
These drone-based services streamline data collection, improve decision-making, and enhance project planning across multiple industries.


Drone academies offer a variety of courses and training programs to equip students with the necessary skills and knowledge to become certified drone pilots.
Drones play a critical role in enhancing public safety and security by providing rapid aerial support and improved response capabilities.
Drone Creative offerings typically include a range of services that leverage drone technology to capture stunning visuals.