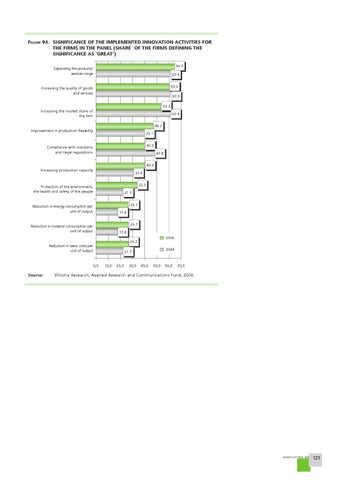
FIGURE 94. SIGNIFICANCE OF THE IMPLEMENTED INNOVATION ACTIVITIES FOR THE FIRMS IN THE PANEL (SHARE OF THE FIRMS DEFINING THE SIGNIFICANCE AS ‘GREAT’) 66.7
Expanding the products/ services range
60.9 60.0
Increasing the quality of goods and services
60.9 53.3
Increasing the market share of the firm
60.9 46.7
Improvement in production flexibility
39.1 40.0
Compliance with standarts and rlegal regulations
47.8 40.0
Increasing production capacity
30.4 33.3
Protection of the environment, the health and safety of the people
21.7 26.7
Reduction in energy consumption per unit of output
17.4 26.7
Reduction in material consumption per unit of output
17.4
2004
21.7 0,0
Source:
2006
26.7
Reduction in labor costs per unit of output
10,0
20,0
30,0
40,0
50,0
60,0
70,0
Vitosha Research, Applied Research and Communications Fund, 2006.
I N N O VAT I O N . B G
121