1 A concise and insightful breakdown of the Phoenix Metro real estate market
2 Leveraging The Cromford Index™ to assess supply and demand dynamics through critical market metrics.
3-4 A deep dive into detailed market data, analyzing past and present trends for a comprehensive perspective
OVERALL INSIGHTS
For the monthly period ending August 15, the average sales price per square foot across ARMLS was $283 82 This reflects a 1 6% drop from July’s $288 48, landing at the lower end of our forecast range. Pending listings are also showing weakness, with an average list price per square foot of $316.16 down 1.1% from last month This suggests that closed sales prices will likely continue to decline over the next four to five weeks
Looking ahead, our forecast for September 15 calls for an average sales price per square foot of $281.10, down another 1% from current levels We are 90% confident results will fall between $275 48 and $286 72 Market distress remains minimal, with the vast majority of pending sales being normal transactions, though REOs ticked up slightly this month.
Supply has trended lower for the past two months, though it remains near normal levels Demand has inched upward in recent weeks but is still well below typical. With Greater Phoenix firmly in a buyer’s market, the overall price trend is expected to remain negative. As we move into autumn, we anticipate a second wave of new listings, particularly within the luxury and 55+ segments
For buyers, today’s market feels far different from the frenzied conditions of 2021–2022 Competition has eased significantly, with attractive listings no longer sparking multiple offers in days. Sellers, meanwhile, face a quieter environment, but the stability in nominal pricing compared to three years ago means that homes are actually more affordable in real terms, given wage growth and inflation over that period
Nicole Kobrinsky PRESIDENT & BROKER OF RECORD
HIGHLIGHTS
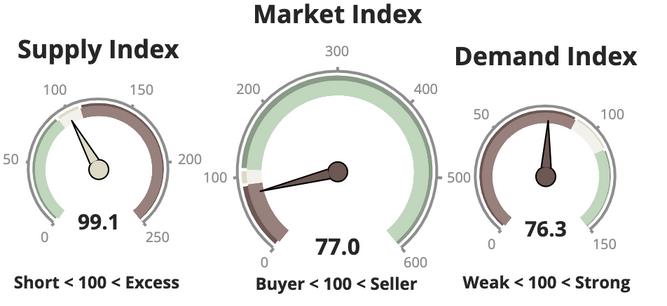
MARKET TYPE
SUPPLY TREND
The Supply Trend Index has has decreased slightly.
MARKET INDEX
The 100 mark represents the index value for a balanced market. A value above 100 represents a market that favors a seller. A value below 100 represents a market that favors a buyer.
DEMAND TREND
The Demand Index Trend has remained steady.
TRENDS
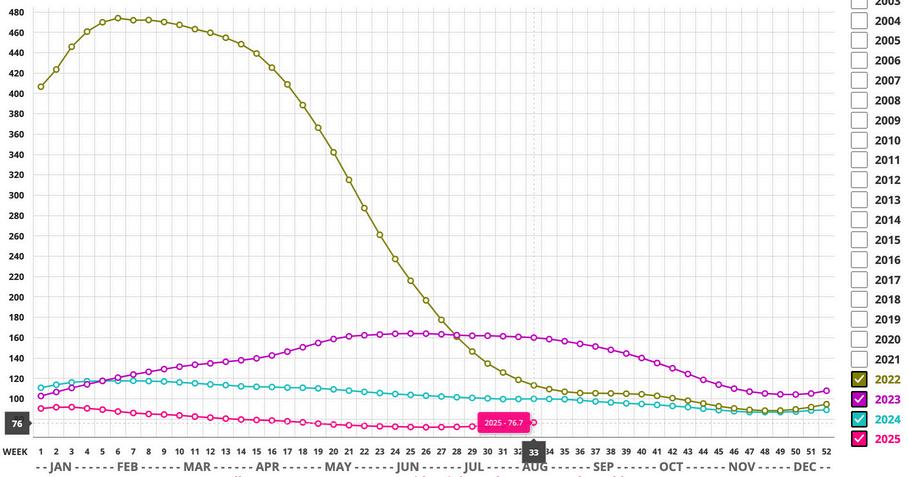
CROMFORD MARKET INDEX
MARKET HIGH
The Market Index was 514 at the height of the market in May 2021.
EXPECTATIONS
The Cromford® Market Index is down to 77 and we consider this unusually low. Yes, we saw much lower values in the CMI during the crash of 2006-2009, but we are not in a crash situation.
DATA SOURCE: ARIZONA REGIONAL MULTIPLE
MARKET LOW
In the late Spring of 2022, the market decelerated quickly. A Market Index of 88.3 was seen in December 2022.
The monthly median sales price decreased by 1.8%. The monthly average price per square foot trends down 0.6% YOY.
PRICING
Questions or Comments? Email Report author: Nicole Kobrinsky at nicole@housegallery com
6901 East 1st St Suite 103 Scottsdale, Arizona 85251 480 808 1223 | housegallery com
IF YOUR PROPERTY IS CURRENTLY LISTED WITH ANOTHER REAL ESTATE BROKER, OR YOUR ARE UNDER A BUYER REPRESENTATION CONTRACT WITH ANOTHER REAL ESTATE BROKER, PLEASE DISREGARD THIS OFFER. IT IS NOT OUR INTENTION TO SOLICIT THE OFFERINGS OF OTHER REAL ESTATE BROKERS