An exploration of the latest market shifts, buyer behaviors, and investment patterns shaping the Phoenix real estate landscape.
Overall Insights
1 A concise and insightful breakdown of the Phoenix Metro real estate market
2 Leveraging The Cromford Index™ to assess supply and demand dynamics through critical market metrics.
3-4 A deep dive into detailed market data, analyzing past and present trends for a comprehensive perspective
OVERALL INSIGHTS
September saw stronger demand as lower interest rates boosted activity, especially in the first half of the month Listings under contract rose 1 8 percent compared to a year earlier, and closed sales were up 12 percent, although about 5 percent of that gain is due to one extra working day in 2025.
Prices rebounded after four months of decline and now sit higher than a year ago, partly because of more luxury sales in recent weeks. For sellers, not all indicators are positive. Supply increased by more than 5 percent in September and is expected to keep rising through November Demand that spiked in midAugust faded by the end of September as rates ticked back up The Cromford Market Index is trending lower, driven by growing supply.
As of October 15, the average sales price per square foot is $287 85, up 1 2 percent from September The average pending price per square foot is $324 45, an increase of 2 5 percent, suggesting that closed prices are likely to rise further. Distressed listings are also creeping higher, with 1.4 percent in preforeclosure compared to 0.8 percent a year ago. The forecast for November 15 puts the average sales price per square foot at $295 17, within a likely range of $289 to $301
Overall, the market has moved beyond the summer slowdown Prices typically strengthen between October and December, and with renewed activity, especially at the high end, values are expected to continue improving over the next month.
Nicole Kobrinsky
PRESIDENT & BROKER OF RECORD
HIGHLIGHTS
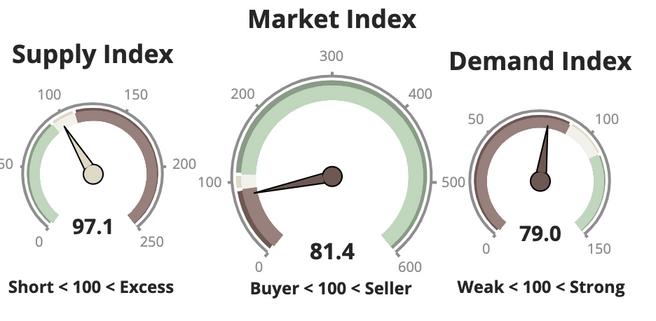
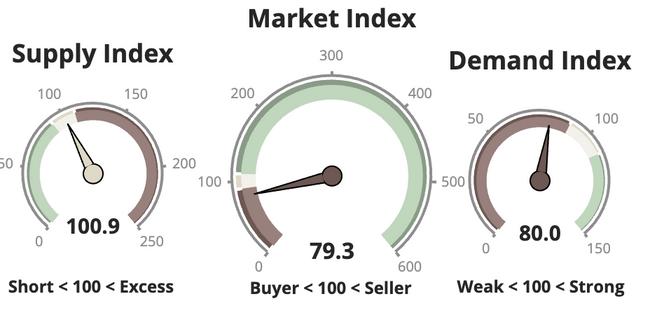
MARKET TYPE
MARKET INDEX
SUPPLY TREND
The Supply Trend Index has increased slightly.
The 100 mark represents the index value for a balanced market. A value above 100 represents a market that favors a seller. A value below 100 represents a market that favors a buyer.
DEMAND TREND
The Demand Index Trend has increased slightly.
TRENDS
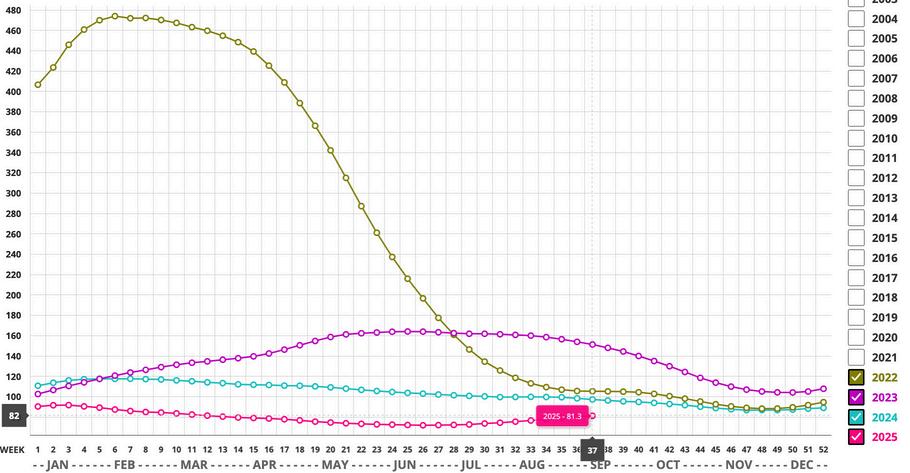
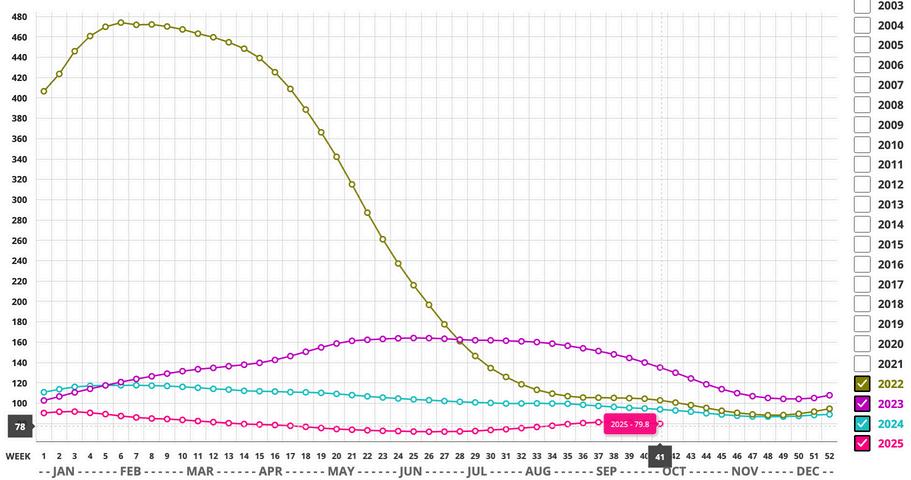
CROMFORD MARKET INDEX
MARKET HIGH
The Market Index was 514 at the height of the market in May 2021.
EXPECTATIONS
The Cromford® Market Index is at 79, and we consider this unusually low. Yes, we saw much lower values in the CMI during the crash of 20062009, but we are not in a crash situation.
DATA SOURCE: ARIZONA REGIONAL MULTIPLE
MARKET LOW
In the late Spring of 2022, the market decelerated quickly. A Market Index of 88.3 was seen in December 2022.
The monthly median sales price increased by 2.6%. The monthly average price per square foot trends up 0.8% YOY.
PRICING
Questions or Comments? Email Report author: Nicole Kobrinsky at nicole@housegallery com
6901 East 1st St Suite 103 Scottsdale, Arizona 85251 480 808 1223 | housegallery com
IF YOUR PROPERTY IS CURRENTLY LISTED WITH ANOTHER REAL ESTATE BROKER, OR YOUR ARE UNDER A BUYER REPRESENTATION CONTRACT WITH ANOTHER REAL ESTATE BROKER, PLEASE DISREGARD THIS OFFER. IT IS NOT OUR INTENTION TO SOLICIT THE OFFERINGS OF OTHER REAL ESTATE BROKERS