Overall Insights
1 A concise and insightful breakdown of the Phoenix Metro real estate market
2 Leveraging The Cromford Index™ to assess supply and demand dynamics through critical market metrics.
3-4 A deep dive into detailed market data, analyzing past and present trends for a comprehensive perspective
OVERALL INSIGHTS
Supply grew faster than demand once again in October, but the supply trend is weakening now Despite some lower mortgage rates, demand remains subdued and the market is still suffering from lower than average volumes, despite an improvement compared with last year.
The monthly average $/SF for closed listings rose between September and October and is now 2.7% higher than a year ago, almost as much as the increase in the CPI. However the median sales price fell back during October and is currently unchanged from a year ago. The reason for the discrepancy between these two signals of pricing is once again the divergence of the luxury market from everything else Home-buyers with lots of capital are doing very nicely.
First-time home-buyers are still scarce and move-up buyers appear to be uncertain about their future Luxury and super-luxury buyers are far more confident.
For the monthly period ending November 15, we are currently recording a sales $/SF of $294 74 averaged for all areas and types across the ARMLS database This is up 2 3% from the $288 15 we now measure for October 15 Our forecast range mid-point was $295.17. Pricing has been almost as strong as we anticipated, with only a 43c difference between our forecast and the actual result
On November 15 the pending listings for all areas and types show an average list $/SF of $324.45, up 2.3% from the reading for October 15. This suggests that closed prices are likely to rise again over the next 4 weeks as we head into the holiday season Among those pending listings we have 97 8% normal, 0 9% in REOs and 1 3% in pre-foreclosures (including a very small number of short sales). The level of distress is down slightly from last month, but up from a year ago when we had 98.8% normal.
Our mid-point forecast for the average monthly sales $/SF on December 15 is $300 49, which is up 1 9% from the November 15 reading We have a 90% confidence that it will fall within ± 2% of this mid point, i.e. in the range $294.48 to $306.50.
As expected, the upward trend in supply has reached its peak and we can expect falling active counts through to the end of December Demand has responded to lower interest rates by giving us higher pending and UCB counts than last year (up 11%). In addition we are seeing more closings per month than this time last year (up 4%) Since we also have 18% more supply than last year, the market balance still favors buyers However the trend in demand is up and the trend in supply is down, which is something sellers can be pleased about.
Prices usually move higher between midOctober and mid-November in most years, so we are reasonably confident this will happen in 2025 too.
Nicole Kobrinsky
PRESIDENT & BROKER OF RECORD
TRENDS
CROMFORD MARKET INDEX
MARKET HIGH
The Market Index was 514 at the height of the market in May 2021.
EXPECTATIONS
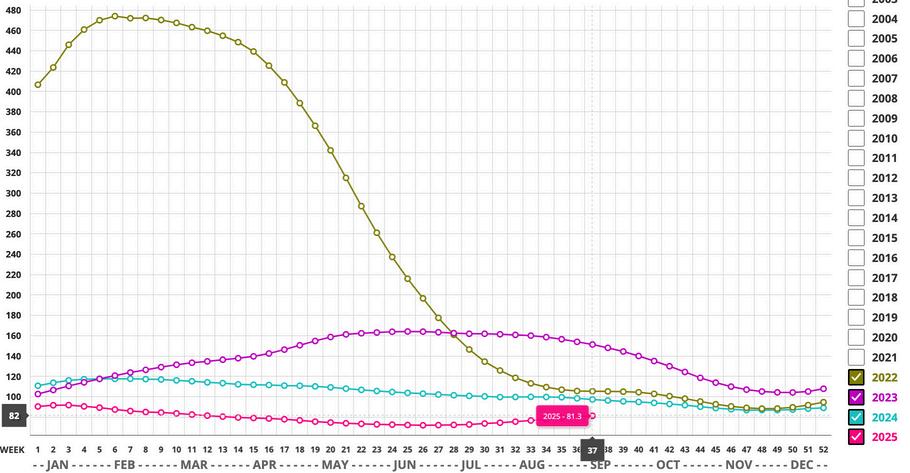
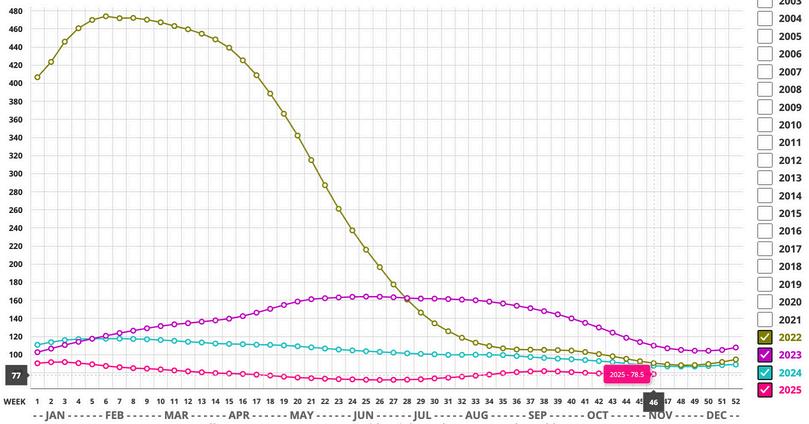
The Cromford® Market Index is at 78.5, and we consider this unusually low. Yes, we saw much lower values in the CMI during the crash of 20062009, but we are not in a crash situation.
DATA SOURCE: ARIZONA REGIONAL MULTIPLE
MARKET LOW
In the late Spring of 2022, the market decelerated quickly. A Market Index of 88.3 was seen in December 2022.
The monthly median sales price decreased by 0.9%. The monthly average price per square foot trends up 1.0% YOY.
AVERAGE
PRICING
Questions or Comments? Email Report author: Nicole Kobrinsky at nicole@housegallery com
6901 East 1st St Suite 103 Scottsdale, Arizona 85251 480 808 1223 | housegallery com
© 2025 HOUSE GALLERY COLLECTIVE ALL WORLDWIDE RIGHTS RESERVED ALL MATERIAL PRESENTED HEREIN IS INTENDED FOR INFORMATION PURPOSES ONLY WHILE, THIS INFORMATION IS BELIEVED TO BE CORRECT, IT IS REPRESENTED SUBJECT TO ERRORS, OMISSIONS, CHANGES OR WITHDRAWAL WITHOUT NOTICE THIS INFORMATION IS BASED ON DATA FROM ARIZONA REGIONAL MULTIPLE LISTING SERVICE, INC (ARMLS), CROMFORD ASSOCIATES LLC , REALTORS PROPERTY RESOURCE®, LLC AND INTERPRETED BY HOUSE GALLERY COLLECTIVE, LLC DATA HAS BEEN LIMITED TO SALES REPORTED WITHIN THE COUNTY OF MARICOPA BOUNDARIES
IF YOUR PROPERTY IS CURRENTLY LISTED WITH ANOTHER REAL ESTATE BROKER, OR YOUR ARE UNDER A BUYER REPRESENTATION CONTRACT WITH ANOTHER REAL ESTATE BROKER, PLEASE DISREGARD THIS OFFER. IT IS NOT OUR INTENTION TO SOLICIT THE OFFERINGS OF OTHER REAL ESTATE BROKERS