HOUSE
R E P O R T
TRENDS
An overview into which trends to watch
EXPERT GUIDANCE
Navigate this year’s market with confidence
INSIDER INSIGHT
Words of wisdom from Nicole Kobrinsky
1 A quick and insightful look at the realities of the real estate market in Phoenix Metro
2 We utilize The Cromford Index™ which is a set of market indicators to measure the balance of supply and demand
3-4 A comprehensive look at more detailed market statistics from a past and current perspective
OVERALL INSIGHTS
The re-sale market continues in the doldrums and has reacted very little so far to the lower mortgage rates that have emerged since July Under contract listings went down a further 8.6% during August rather than staging a recovery. Demand appears to be stronger in the new home sector but that has a relatively modest effect on the MLS statistics because the bulk of new homes are not listed on the MLS. However one look at the stock price charts for the major homebuilders will tell you they are in a good mood
Re-sale supply usually rises between August and November, but this year the trend got off to an early start and we have 5.5% more listings active and without a contract than a month ago. With demand weak and supply rising, sellers are not getting the break they were probably hoping for. Concession to buyers and price cuts continue to be common and widespread.
The Cromford® Market Index slipped below 100 at the end of July and spent all of August hovering between 99 and 100 We rarely see such little movement in the CMI The contract ratio is somewhat less stable, falling from 42 to 36 and this represents a further cooling in the market. It seems many potential buyers want to see rates drop below 6% before they make a move
The only bright spot for sellers is that pricing improved during August with the average $/SF rising 1 3% from July However the median sales price was unchanged and is up only 1 1% from a year ago. This is less than inflation so in real terms homes are cheaper than this time last year. This statement does not apply to the very top end of the market which has significantly risen in price over the last 12 months. In fact we saw a new record of almost $32 4 million paid for a new home just completed in Paradise Valley's Mummy Mountain Estates Unusually, this was a spec home and it sold for more than $2,000 per sq ft The market over $5 million is not seeing the same conditions as the regular market.
It would take a resurgence in demand to pump more life back into this dormant regular market. The question now is whether the recent drop in the rate will be an event or a snooze for home buyers.
As usual we will have to wait and see Look to the under contract count to be the first thing to show any pick-up in demand
Nicole Kobrinsky PRESIDENT & BROKER OF RECORD
HIGHLIGHTS
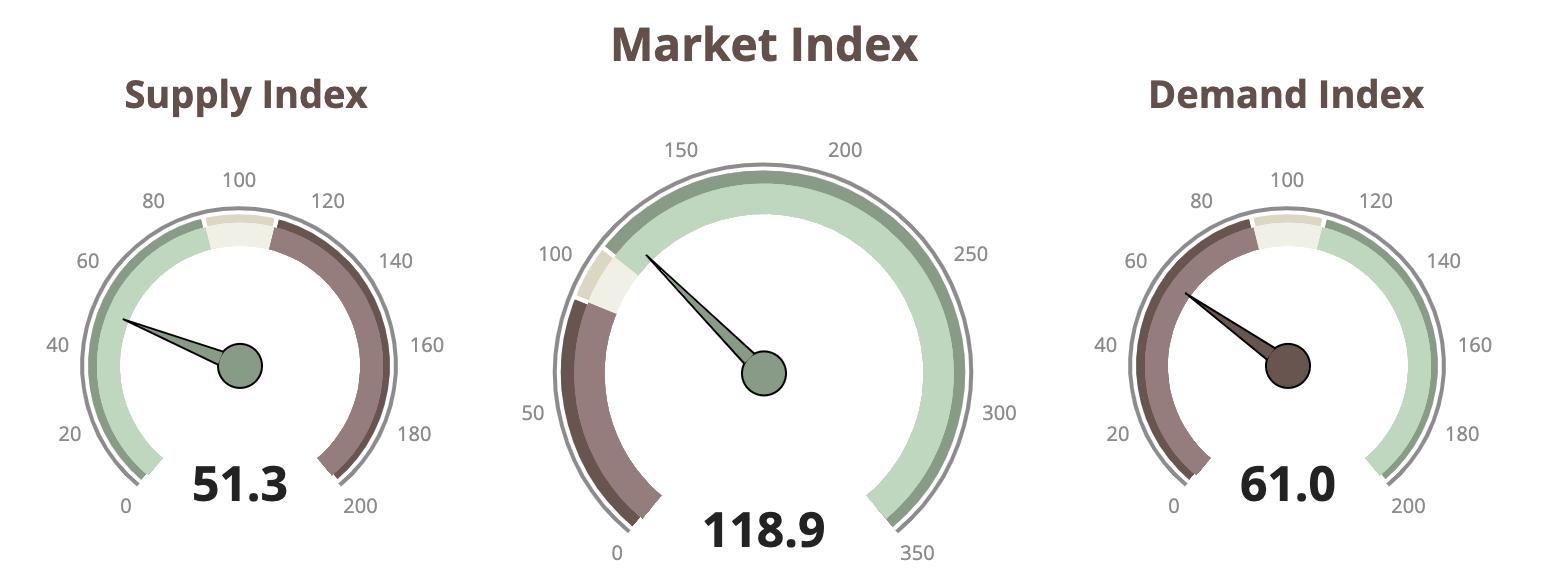
MARKET TYPE
SUPPLY TREND
The Supply Trend Index has has increased 2 5pts since last month
MARKET INDEX
The 100 mark represents the index value for a balanced market A value above 100 represents a market that favors a seller A value below 100 represents a market that favors a buyer. The Market Index Trend is down a large 10 9pts in the last month
DEMAND TREND
The Demand Index Trend is down a small 2 3 pts in the last month
TRENDS
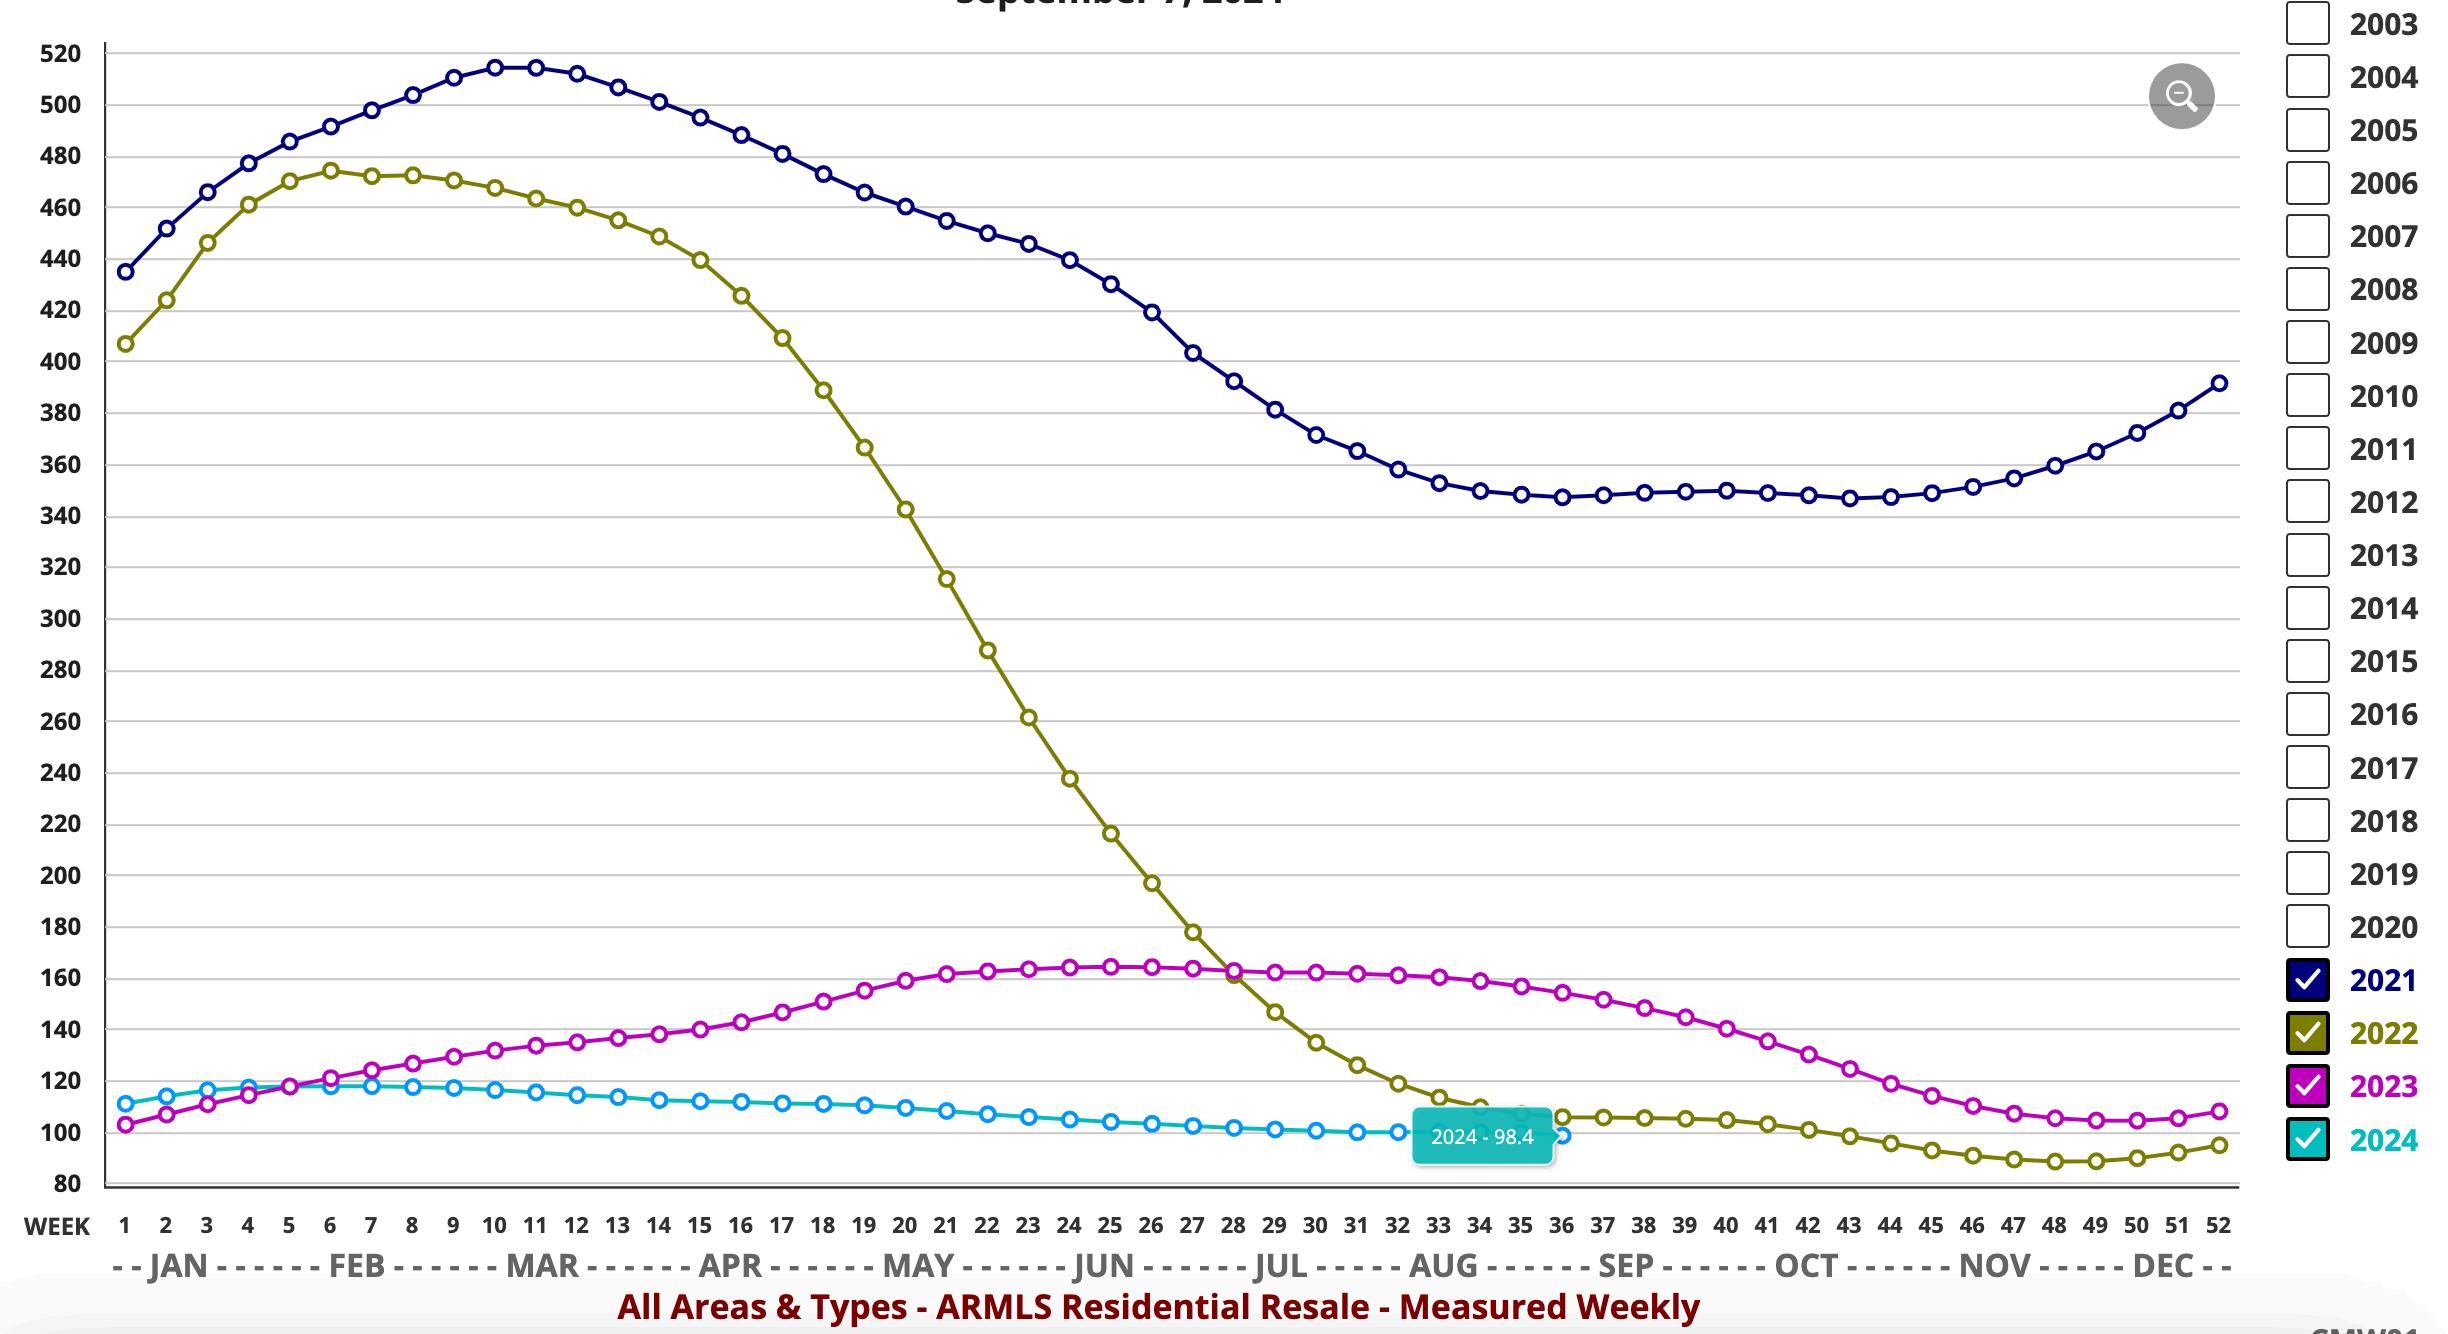
MARKET HIGH
The Market Index was 514 at the height of the market in May 2021
EXPECTATIONS
After low volumes and months of seasonal price weakness, the market is likely to pick up steam again in October.
MARKET LOW
In the late Spring of 2022, the market decelerated quickly The lowest Market Index of 88.3 was seen in December 2022.
CROMFORD MARKET INDEX
PRICING
The monthly median sales price trends down 8 5% since last month The monthly average price per square foot trends up 3% YOY
INVENTORY
Active listings (excluding UBC) are up 54% YOY and months of inventory is up 70% from 2 to 3 4 months YOY Prices are likely to inch upward in the coming months
VOLUME
Overall volume of residential sales for the year is down 9 3% compared to September 2023
Questions or Comments? Email Report author: Nicole Kobrinsky at nicole@housegallery com
6901 East 1st St Suite 103 Scottsdale, Arizona 85251
(480)808-1223 | housegallery com
© 2024 HOUSE GALLERY COLLECTIVE ALL WORLDWIDE RIGHTS RESERVED ALL MATERIAL PRESENTED HEREIN IS INTENDED FOR INFORMATION PURPOSES ONLY WHILE, THIS INFORMATION IS BELIEVED TO BE CORRECT, IT IS REPRESENTED SUBJECT TO ERRORS, OMISSIONS, CHANGES OR WITHDRAWAL WITHOUT NOTICE THIS INFORMATION IS BASED ON DATA FROM ARIZONA REGIONAL MULTIPLE LISTING SERVICE, INC (ARMLS), CROMFORD ASSOCIATES LLC , REALTORS PROPERTY RESOURCE®, LLC AND INTERPRETED BY HOUSE GALLERY COLLECTIVE, LLC DATA HAS BEEN LIMITED TO SALES REPORTED WITHIN THE COUNTY OF MARICOPA BOUNDARIES
IF YOUR PROPERTY IS CURRENTLY LISTED WITH ANOTHER REAL ESTATE BROKER, OR YOUR ARE UNDER A BUYER REPRESENTATION CONTRACT WITH ANOTHER REAL ESTATE BROKER, PLEASE DISREGARD THIS OFFER IT IS NOT OUR INTENTION TO SOLICIT THE OFFERINGS OF OTHER REAL ESTATE BROKERS