HOUSE
R E P O R T
TRENDS
An overview into which trends to watch
EXPERT GUIDANCE
Navigate this year’s market with confidence
INSIDER INSIGHT
Words of wisdom from Nicole Kobrinsky
1 A quick and insightful look at the realities of the real estate market in Phoenix Metro
2 We utilize The Cromford Index™ which is a set of market indicators to measure the balance of supply and demand
3-4 A comprehensive look at more detailed market statistics from a past and current perspective
OVERALL INSIGHTS
At last we can see some signs of life in the re-sale housing market after an extended period in limbo Reaction to the lower mortgage rates that have emerged since July has been slow in coming but is now detectable. Under contract listings went up over 9% during the course of September and are almost 12% higher than this time last year.
Sales volumes during September remained painfully low, but the housing market does not turn on a dime We should start to see better closing numbers during October as long as the under contract counts keep improving.
Pricing fell back again after a short term increase during August In fact the average $/SF is very slightly lower than it was a year ago. However the median sales price is up 2.3% from last year, so there is no need for despair. Pricing is very stable, as it should be when the Cromford® Market Index is slightly above or below 100
Re-sale supply is increasing, as it usually does between August and November, so the extra demand is being exceeded by extra supply. This means we can expect the CMI to drift lower for another month and buyers will continue to have favorable negotiating power. If supply starts to fall sometime in November, which we would normally expect then we can reasonably expect the CMI trend to reverse and move higher again by the end of 2024.
The contract ratio has edged up very slightly from 36 1 to 37 over the course of September Both figures represent a balanced market, but edging up is better than drifting down If we are going to see significantly more favorable conditions for sellers, then look for this number to reach 45. This is where we stood last June.
PRESIDENT & BROKER OF RECORD
Nicole Kobrinsky
HIGHLIGHTS
MARKET TYPE
SUPPLY TREND
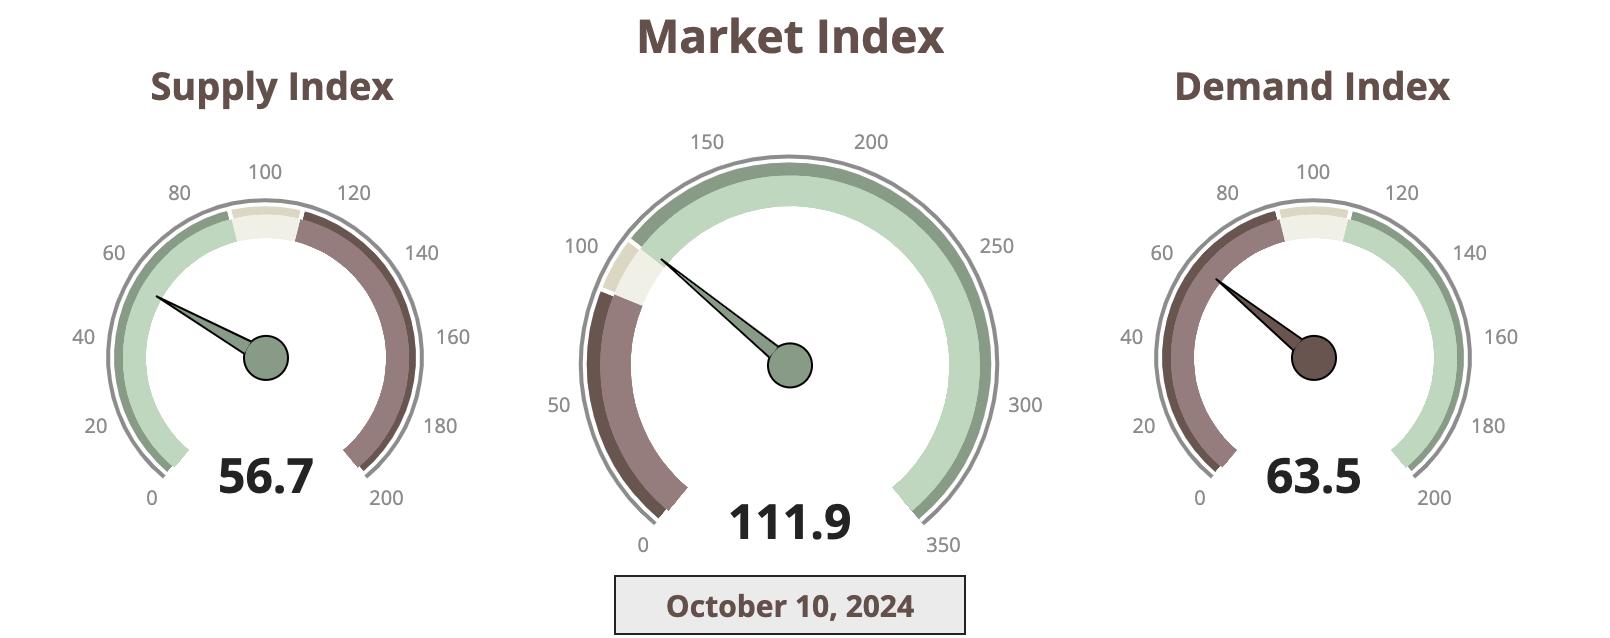
The Supply Trend Index has has increased 5 4 pts since last month
MARKET INDEX
The 100 mark represents the index value for a balanced market A value above 100 represents a market that favors a seller A value below 100 represents a market that favors a buyer. The Market Index Trend is down a large 7pts in the last month
DEMAND TREND
The Demand Index Trend is up a small 2 5 pts in the last month
TRENDS
MARKET HIGH
The Market Index was 514 at the height of the market in May 2021
EXPECTATIONS
After low volumes and months of seasonal price weakness, the market is starting to pick up steam again.
MARKET LOW
In the late Spring of 2022, the market decelerated quickly The lowest Market Index of 88.3 was seen in December 2022.
CROMFORD MARKET INDEX
PRICING
The monthly median sales price trends up a small 0 5% since last month The monthly average price per square foot trends slightly down at 0 3%% YOY
INVENTORY
Active listings (excluding UBC) are up 47% YOY and months of inventory is up 46 1% from 2 6 to 3 8 months YOY Prices are likely to inch upward in the coming months
VOLUME
Overall volume of residential sales for the year is down 2 3% compared to October 2023
Questions or Comments? Email Report author: Nicole Kobrinsky at nicole@housegallery com
6901 East 1st St Suite 103 Scottsdale, Arizona 85251
(480)808-1223 | housegallery com
© 2024 HOUSE GALLERY COLLECTIVE ALL WORLDWIDE RIGHTS RESERVED ALL MATERIAL PRESENTED HEREIN IS INTENDED FOR INFORMATION PURPOSES ONLY WHILE, THIS INFORMATION IS BELIEVED TO BE CORRECT, IT IS REPRESENTED SUBJECT TO ERRORS, OMISSIONS, CHANGES OR WITHDRAWAL WITHOUT NOTICE THIS INFORMATION IS BASED ON DATA FROM ARIZONA REGIONAL MULTIPLE LISTING SERVICE, INC (ARMLS), CROMFORD ASSOCIATES LLC , REALTORS PROPERTY RESOURCE®, LLC AND INTERPRETED BY HOUSE GALLERY COLLECTIVE, LLC DATA HAS BEEN LIMITED TO SALES REPORTED WITHIN THE COUNTY OF MARICOPA BOUNDARIES
IF YOUR PROPERTY IS CURRENTLY LISTED WITH ANOTHER REAL ESTATE BROKER, OR YOUR ARE UNDER A BUYER REPRESENTATION CONTRACT WITH ANOTHER REAL ESTATE BROKER, PLEASE DISREGARD THIS OFFER IT IS NOT OUR INTENTION TO SOLICIT THE OFFERINGS OF OTHER REAL ESTATE BROKERS